Transcription
The Floor Trader System(“Forex Strategies Revealed” - Advanced System ERVirtually all of the information in this paper was sourced from the “Forex Strategies Revealed” website. Some of thecomments posted by users and the site host were incorporated in the document along with the original strategy “TheFloor Traders System” in order to present the strategy and follow-up notes in one easy-to-read document. Thisdocument may contain errors of interpretation of the original text on the website, errors in rewriting concepts in plainerlanguage, errors of spelling and grammar, errors in understanding the many aspects and concepts of the strategy,typing errors and errors of any other nature. The person who collated the information in this document is NOT anexperienced trader of any instrument and accepts no responsibility for any of the abovementioned errors or omissionsor responsibility for any adverse outcomes that readers may experience through reading this document and acting onits contents. Readers must access the abovementioned website and read all the material in order to satisfythemselves of the accuracy of the contents this document.Readers must ensure they thoroughly understand the strategy and all the concepts involved AND personally confirmthe accuracy of all statements for their own benefit before they trade. No correspondence will be entered into.
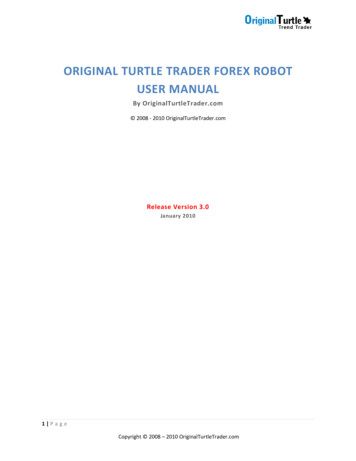
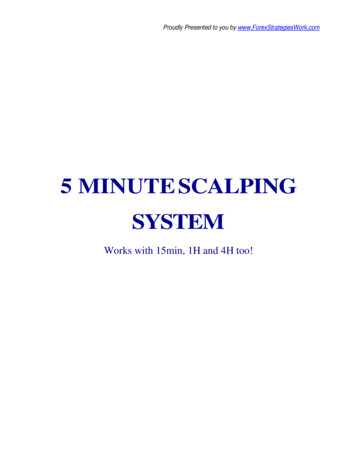
Floor Trader System(“Forex Strategies Revealed” - Advanced System #13)The Floor Trader System (Scalping)This is a retracement-then-continuation trading method. It identifies entries by combining trendidentification (by using moving averages) with the technical analysis technique of price candlepattern-recognition. Despite all the narrative below, this is a relatively simple system for L1 & L2.The primary candle pattern to look for is called the “Price Reversal Candle” - in conjunction with aretracement within the current trend.Currency pairs:Chart Time frame:Indicators:Trading Time:Risk:Any (Try EUD/USD, GBP/USD, EUR/GBP, USD/JPY)3-minute & 5-minute, 1-hour (for support & resistance), daily (for trend)8 EMA, 18 EMA (Set to closing price). Some traders prefer 9 & 30 EMABollinger Bands are used on some of the charts0730 – 1230 GMT (EUR/USD)1% (2% maximum)Suggestion:Only take the Level 1 signals.Trade Entry SignalsThere are three types of entry signals (which are explained in detail later in this document): Level 1 (L1) (a suggestion is that inexperienced traders confine themselves to L1 and L2) Level 2 (L2) (L2 signals may appear before L1 signals and may be utilised for same) Level 3 (L3) (L3 signals are not common)Stops: Place a stop above or below a swing high or swing low, but no less than 15 pips away forthe entry. Placing stops behind high or low swings is a good idea for any time frame if you canmanage the risk.System Overview & BasicsRetracements: A retracement within a downtrend is a minor rally. A retracement within an uptrend is a minor decline.4312In diagram "A", the areas 1 and 2 are rally retracements in the overall downtrend - minor rallies thatended with descents to new lows. A rally retracement has candles with higher lowsSimilarly, the areas 3 and 4 are decline retracements in the overall uptrend - minor dips that endedwith rallies to new highs. A decline retracement has candles with lower highs.The Price Candle Reversal after a decline retracement: This is a BUY signal.FX Floor Trader Strategy.docPage 2 of 1424/07/10
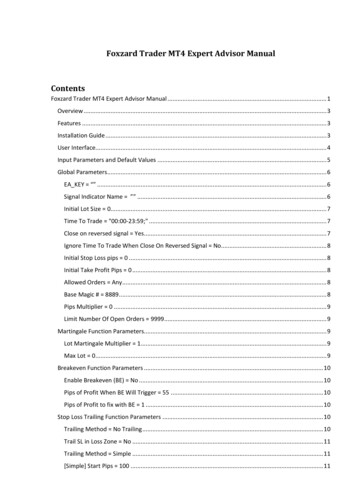
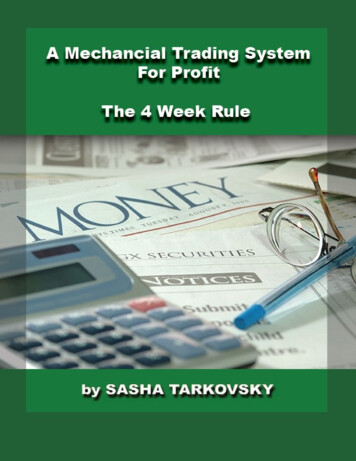
Floor Trader System(“Forex Strategies Revealed” - Advanced System #13)Diagram "B" shows two examples of decline retracements. The two candles marked "X" are the firstcandles that rally above the high of the previous candles in each of the decline retracements.During an uptrend, traders should be alert for the formation of a decline retracement. If the MovingAverages (see later) indicate that the uptrend should resume, then the trader should buy the upsidebreakout (candles at “x” above) of the temporary decline.The entry is achieved by noting the high of the previous candle relative to the current candle (x).The trader should BUY when the price of the current candle rallies above the high of the previouscandle by one or more ticks.Stops: a trailing sell stop would be placed and adjusted to the high of each successive descendingcandle - at a distance of no less than 15 pips.The Price Candle Reversal after a Rally Retracement: This is a SELL signal.Diagram CDiagram “C” shows examples of three rally retracements; the candles marked "X" trigger a shortsale.During a downtrend, traders should be alert for the formation of a rally retracement. If the MovingAverages indicate that the downtrend should resume, then the trader should sell the downsidebreakout (candles at “x” above) of the temporary rally.The entry is achieved by noting the low of the previous candle relative to the current candle (x). Thetrader should SELL short when prices within the current candle fall below the low of the previouscandle by one or more ticks.Stops: a trailing sell stop would be placed and adjusted to the low of each successive ascendingcandle - at a distance of no less than 15 pips.Diagram DThe Number of Candles in the RetracementThe best retracements opportunities will contain 2-5 candles before the reversal occurs. In volatileprice moves a 1-candle retracement is sometimes valid.In general, rally retracements in a downtrend will be steeper and will contain fewer candles thandecline retracements in an uptrend. A rally retracement lasting longer than six candles must beconsidered suspect as it could form a new uptrend.FX Floor Trader Strategy.docPage 3 of 1424/07/10
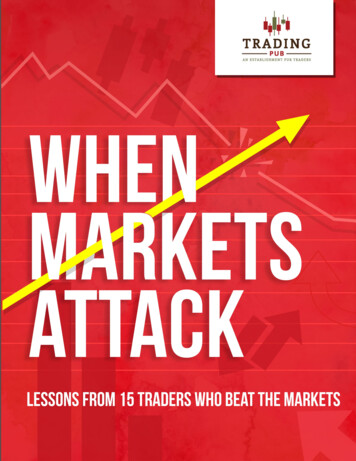
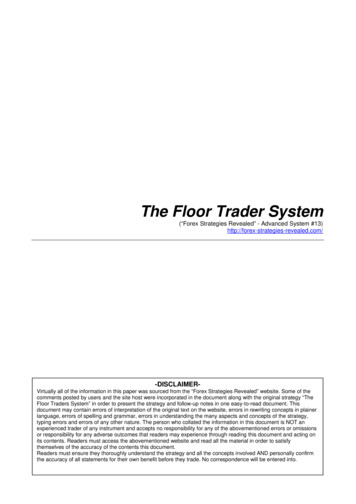
Floor Trader System(“Forex Strategies Revealed” - Advanced System #13)(Comment from forum: The only requirement is for a retracement to have a length of over 4 candles. After thatit could be 6, 7 or 8, it doesn't matter. Note that more candles will generate fewer signals and, hopefully,better accuracy.)Chart 1 below shows an example of counting the candles in a retracement.On the chart, the letter “B” indicates the lowest low in the downtrend. However, in order for thecandle at point “B” to be the lowest on the chart, we have to wait for the next candle to make sure itdoes not reach, or equal, the lowest price level of the previous candle (B).From point “B” count the candles 1, 2, 3, 4 . . . these are the retracement candlesticks.Chart 1Retracement Shape & Candle ShapeThe characteristic that makes the retracement patterns ideal is their "V" shape when the candlereversal occurs. The best trades are usually from symmetrical “V” patterns.The size of the candles in the retracement is important. The optimum formation consists of candleswhich become shorter in their price range as the retracement progresses. (See example “A” indiagram “D” above, for SELL entries.)Candles of equal size are also valid, as in "B" above (Dia. D).Patterns with lengthening candles, as in "C" (Dia. D), are less reliable and any entry signals shouldbe ignored. This is an area where individual judgment is needed.When BUYING into an uptrend, examples "D" and "E" (Dia. D) are ideal formations; howeverexample "F" is questionable.Moving Average Indicators (Exponential)Uptrends and downtrends can be identified by examining the candle formations in conjunction withtwo EMA’s, one 9-period and one 18-period. Once the trend is identified, the trader then waits forthe retracement to appear.Recall from Basic Strategy #1, when a fast MA crosses up through a slow MA, an uptrend isexpected; whereas, when the fast MA crosses the slow MA downwards, a downtrend is expected.Always check for the trend first.An Uptrend is identified by:1. The fast EMA crosses the slow EMA upwards,2. Prices trading above both EMA's3. The 9-EMA line is above the 18-EMA line.4. The slope of one or both of the EMA's is upwards.FX Floor Trader Strategy.docPage 4 of 1424/07/10
Floor Trader System(“Forex Strategies Revealed” - Advanced System #13)(Exception: occasionally the 9-EMA will be under the 18, but curving upward and about to cross it.This formation is allowed.)Number 1 above is the primary identifier; prices must first trade above both EMA lines - subject tothe two conditions below:1. Trading above the lines should last for at least 3 candles, or2. Trading should take place at a "significant" distance above the lines (before retracing totouch the EMA lines).A Downtrend is identified by:1. The fast EMA crossing the slow EMA downwards,2. Prices trading below both EMA's,3. The 9-EMA line is below the 18-EMA line.4. The slope of one or both of the EMA's is downwards.(Exception: occasionally the 9-EMA will be above the 18, but curving down and about to cross it.This formation is allowed.)Point number 1 above is the primary identifier; prices must first trade below both EMA lines andthen comply with the two conditions below:1. Trading below the lines should last for at least 3 candles, or2. Trading should take place at a "significant" distance below the lines (before retracing totouch the EMA lines).ENTRY SIGNALSTrade Entry SignalsThere are three types of entry signals: Level 1 (L1) (a suggestion is that inexperienced traders confine themselves to this level) Level 2 (L2) (L2 signals may appear before L1 signals and may be utilised) Level 3 (L3.)The LEVEL 1 Buy signal:After determining that there is an uptrend and a decline retracement is identified, then watch for: Prices to trade lower and enter the zone between the 9 and 18 EMA lines, and One or more candles touch the 18-EMA line (or penetrate slightly below it)Once the 18-EMA has been touched, watch the price for a rally that breaks above the high of thepreceding candle by one or more ticks (the Price Candle Reversal), this is the L1 buy signal.The LEVEL 2 Buy signal: (similar to the L1 signal and may appear before it)After determining that there is an uptrend and a decline retracement is identified, then watch for: Prices to trade lower and they enter the zone between the 9 and 18 EMA lines, and However, In the L2 method, a Price Candle Reversal buy signal occurs before the 18-EMA istouched.That is, the market begins to rally without touching the 18-EMA (which would normally trigger the L1signal).However, Level 2 buy signals are subject to the following condition: Do not act on an L2 buy signal immediately after a Cross-back Top (see below), instead,wait for a Level 1 entry signal.Cross-back Top means, “If a candle’s close makes a new high and the next candle reaches higherbut "crosses back" and closes under the previous high”.Cross-back Low means, “If a candle’s close makes a new low and the next candle reaches lowerbut "crosses back" and closes over the previous low”.FX Floor Trader Strategy.docPage 5 of 1424/07/10
Floor Trader System(“Forex Strategies Revealed” - Advanced System #13)The LEVEL 3 Buy Signal:After determining that there is an uptrend and a decline retracement is identified, then watch for: Prices to trade lower but they DO NOT enter the zone between the 9 and 18 EMA lines, or theprice just touches the 9-EMA line.In this case, the market begins to rally above both EMA lines (or just touches the 9-EMA line) after ashallow retracement.However, Level 3 buy signals are subject to the following conditions:1. The Cross-back Top condition as with the L2 signal, and2. Only ever take an L3 buy signal if it is the first buy signal in a new uptrend.Qualified L3 buys are not common. The best ones form when the market is trading at new highs in a"runaway" rally, or in mid-range after a strong bottoming formation.The following entry signal setups may be actioned in any order, although it is recommended fornovices to act on Level 1 signals only.The LEVEL 1 Sell signal:After establishing that there is a downtrend and a rally retracement is identified, then watch for: Prices trade higher to enter the zone between the 9 and 18-EMA lines. One or more candles touch the 18-EMA line or penetrate slightly above it.Once the 18-EMA line has been touched, watch for a price decline that breaks below the low of thepreceding candle by 1 tick or more (the Price Candle Reversal), this is the L1 sell signal.The LEVEL 2 Sell Signal:This situation, when a Level 2 signal appears first, will occur during the rallies and selloffs when theprice have a chance to fully retrace and touch the 18-EMA line. The EMA qualifiers are the same as with the L1 sell signal, and the price rallies in a retracefrom below the EMA lines to enter the zone between the lines. However, in the L2 method a Price Candle Reversal sell signal occurs before the 18 MA istouched.That is, the market begins to fall without touching the 18-EMA line (which would normally trigger anL1 signal).However, Level 2 sells are subject to this condition: Do not act on an L2 sell immediately after a Cross-back Bottom (explained previously).Instead wait for a Level 1 signal.The LEVEL 3 Sell Signal:In this case the Price Candle Reversal takes place below both EMA lines or just touches the 9-EMAline after a shallow retracement.Two qualifiers:1. The Cross-back Bottom condition, as with the L2 signal, and2. Only take an L3 sell signal if it is the first sell signal in a new downtrend.Qualified L3 sells are the best when the market is trading at new lows in a "panic" decline or inmidrange after a strong topping formation.Continuation Entry SignalsContinuation buy signals are additional buy signals given after the first buy signal in the sameuptrend.FX Floor Trader Strategy.docPage 6 of 1424/07/10
Floor Trader System(“Forex Strategies Revealed” - Advanced System #13)Continuation sell signals are (the reverse) and are additional sell signals given after the first sellsignal in the same downtrend.The rules are somewhat different for continuation buy and sell signals:Continuation Buy Signals: It is essential to closely monitor the first buy signal in a new uptrendfor, regardless of whether or not it is taken, if th
(“Forex Strategies Revealed” - Advanced System #13) FX_Floor_Trader_Strategy.doc Page 2 of 14 24/07/10 The Floor Trader System (Scalping) This is a retracement-then-continuation trading method. It identifies entries by combining trend identification (by using moving averages) with the technical analysis technique of price candle