Transcription
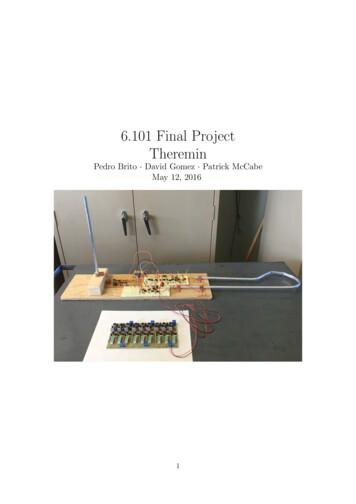
6.101 Final ProjectThereminPedro Brito · David Gomez · Patrick McCabeMay 12, 20161
AbstractThe goal of this project is to create a theremin. A theremin is a musical instrument that is played without physical contact. This is achieved by usingtwo antennas, one controls the pitch and the other the volume, which arecapacitively coupled to the player’s hands. By moving their hands aroundthese antennas, the player can change the capacitance of the coupling. Thischange in capacitance is then detected allowing a tone that varies in pitchand volume based on distance from the antennas to be produced.Playing a theremin, specifically producing a desired pitch, is difficultbecause there is no physical reference point to know where a hand shouldbe moved. To aid in this, a pitch visualizer has also been included in thisproject. This visualizer has several LED indicators that illuminate whenthe theremin plays certain musical notes to give an easy reference to theplayer.2
Contents1 Motivation52 System Architecture2.1 High Level . . . . . . . . . . . . . . . . . . . . . . . .2.2 Pitch Oscillators (David) . . . . . . . . . . . . . . . .2.2.1 Purpose . . . . . . . . . . . . . . . . . . . . .2.2.2 Theory - Sine Wave Oscillator . . . . . . . . .2.2.3 Theory - Detecting Capacitance Change . . .2.2.4 Circuit - Variable Pitch Oscillator . . . . . . .2.2.5 Theory - Fixed Frequency Oscillator . . . . .2.2.6 Circuit - Fixed Pitch Oscillator . . . . . . . .2.3 Volume Oscillator (David) . . . . . . . . . . . . . . .2.3.1 Purpose . . . . . . . . . . . . . . . . . . . . .2.3.2 Design - Volume Oscillator . . . . . . . . . . .2.3.3 Circuit - Volume Oscillator . . . . . . . . . . .2.4 Audio Generation (Patrick) . . . . . . . . . . . . . .2.4.1 Purpose . . . . . . . . . . . . . . . . . . . . .2.4.2 Theory - Signal Mixing . . . . . . . . . . . . .2.4.3 Circuit - Signal Mixing . . . . . . . . . . . . .2.4.4 Theory - Frequency to DC Voltage Conversion2.4.5 Circuit - Frequency to DC Voltage Conversion2.4.6 Theory - Voltage Controlled Attenuator . . .2.4.7 Circuit - Voltage Controlled Attenuator . . . .2.5 Frequency Visualization (Pedro) . . . . . . . . . . . .2.5.1 Purpose . . . . . . . . . . . . . . . . . . . . .2.5.2 Design . . . . . . . . . . . . . . . . . . . . . .2.5.3 Circuit - Gain Stage . . . . . . . . . . . . . .2.5.4 Circuit - Band-Pass Filtering Stage . . . . . .2.5.5 Circuit - Amplitude Detection Stage . . . . .2.5.6 Circuit - LED Visualization Stage . . . . . . .2.5.7 Visualizer Circuit Schematic and PCB . . . 233 Integration264 Conclusion30List of Figures1234567High level block diagram .LC Sine Wave Oscillators .Variable Pitch Oscillator .A Relaxation Oscillator . .Fixed Pitch Oscillator . .Tuning Sensitivity . . . . .Volume Oscillator . . . . .3.56910111214
891011121314151617181920212223Mixer Circuit . . . . . . . . . . . . . . . .Frequency To DC 1 . . . . . . . . . . . . .Frequency To DC 2 . . . . . . . . . . . . .Voltage Controlled Attenuator . . . . . . .Frequency Visualizer with Tuning Column.Frequency Visualizer Block Diagram . . .Gain Stage . . . . . . . . . . . . . . . . . .Band-Pass Filter Stage . . . . . . . . . . .Band-pass filter Bode Plot . . . . . . . . .Amplitude Detection Stage . . . . . . . . .LED Visualization Stage . . . . . . . . . .Frequency Visualizer PCB . . . . . . . . .Completed Theremin . . . . . . . . . . . .Antennas . . . . . . . . . . . . . . . . . .Assembled Circuit Boards . . . . . . . . .Assembled Visualizer PCB . . . . . . . . .4.15171719202021212222242526272829
1MotivationThe theremin is a great project because it is an uncommon instrument that isfun to watch and play. The theremin is also a completely analog device and gaveour team some great experience with oscillators, amplifiers, and signal processing.Along with this general knowledge some of the specific operating principals usedin the theremin have applications in many different products. For instance, thecapacitive sensing techniques used to control the theremin are seen in many devicessuch as cell phone touch screens and the heterodyne process used to get the pitchfrequency is used in many different signal transmitting and receiving systems.2System Architecture2.1High LevelThe theremin has three main parts which were each designed independently byone member of our team. A block diagram of these parts can be see in figure 1.Figure 1: High level block diagram Pitch and Volume Oscillators A set of oscillators that vary in frequencywhen the capacitance of the antennas change Audio Generation Transforms the changing frequency of the oscillatorsinto changes in the pitch and volume of the audio signal5
Frequency Visualization Lights up LEDs accorinding to the frequency ofthe audio signal being producedWith these three parts our team was able to achieve the goal of producing anaudio signal at line level that could vary in pitch from 100Hz - 3kHz and vary involume from loud to silent. We are also able to visualize a large range of musicalnotes throughout this pitch range.2.22.2.1Pitch Oscillators (David)PurposeThe pitch oscillator circuits are responsible for detecting the change incapacitance from the pitch antenna (and therefore the change in hand position)and translating it into a changing frequency to be fed into the audio generationcircuits to produce a tone.2.2.2Theory - Sine Wave OscillatorA simple way which most theremins use to detect changing capacitance isconnecting the antenna to an LC resonant tank oscillator. When the capacitanceof the LC tank changes, the resonant frequency of the tank also changesproducing the capacitance dependent frequency needed. The sine wave producedby such oscillators is also part of what gives theremins their distinctive sound.(b) System Representation(a) Circuit RepresentationFigure 2: LC Sine Wave OscillatorsLC tank resonant tanks do not oscillate on their own though. In order to get thetank to oscillate feedback must be applied. In figure 2, two representations of anLC sine wave oscillator circuit can be seen, a circuit and system view. The6
system view shown in figure 2b is particularly useful because it ensures that thecircuit will oscillate by satisfying the Barkhausen Stability Criterion which statesthat a system will oscillate under two conditions: The open loop gain is unity in magnitude, βA 1 The phase shift shift is zero or a multiple of 2π, 6 βA 2πn, n 0, 1, 2.The open loop gain of this system is:V0V f V0 β(jω)AViV i VfSo to satisfy the gain criterion of Barkhausen:1AWhere A is the open loop gain of the Opamp and β(jω) is defined as thecombined transfer function of the rest of the circuit: β(jω) β(jω) H(jω) β(jω) p6(1)LjωR2R2 2R1 R2LC(jω) R3 Ljω R3 R1 R2pR22 R32 (LCω 2 1)2 R12 L2 ω 2 )(R1 R2 )2 R32 (1 2LCω 2 L2 C 2 ω 4 ) (R1 R2 )2 L2 ω 2 R3β(jω) tan 1Lω LCω 2When the circuit is operating at its resonant frequency, the equations simplifyand make it clear which values could lead to Barkhausen being satisfied:R1 Lω0R1 (R1 R2 )Lω0R R2! 1R3β(jω) tan 1 qL 1C β(jω) 6To satisfy the gain criterion of Barkhausen, the ratio of R1 and R2 must simplybe set to satisfy equation 1. Since A is not known exactly, a potentiometer canbe used to adjust the ratio of R1 and R2 . To satisfy the phase criterion R3 musttheoretically be set to zero; however, this does not consider the non-idealcomponents of the circuit and that the opamp may introduce some phase in itsgain A that is not shown in the math. Because of this complexity, the simplestthing to do is to make R3 a variable resistor.2.2.3Theory - Detecting Capacitance ChangeSection 2.2.2, has shown how make an LC resonant tank oscillate; however, LCvalues and through that, the resonant frequency must still be selected. This is achallenging problem because a hand moving around the antenna was only able to7
create a change in capacitance of around 3pF which must be turned into afrequency change of 3kHz to meet the pitch change requirements in our goals. Aswill be shown in this section, meeting these requirements requires a carefulchoice of values.To begin, the resonant frequency of the oscillator made in section 2.2.2 isgiven by:1 (2)2π LCRearranging this and taking the partial derivative of frequency with respect tocapacitance:r F 1L F0(3)3 C2C4π LCF0 These equations make some important design decisions apparent. The derivativeshown in figure 3 is negative so frequency decreases as capacitance increases.Since capacitance increases as the hand moves closer to the antenna, one mightthink the resonant frequency of the LC tank could be set such that it is 3kHzwhen no hands are near and then the additional 3pF from a hand would beenough to get the necessary frequency drop. This is unfortunately not feasible.The antenna’s normal capacitance is around 12pF, to get a resonant frequency of3kHz an impractically huge inductor of a few hundred henry would be needed. Fof only tens of hertz per picofarad, notThese values would also result in a Cnearly enough to met the goals set.From equation 3, it can be can see that our sensitivity to capacitancechanges can be increased by increasing our resonant frequency or maximizinginductance for a given resonant frequency. A resonant frequency of 264kHz with Fofa 3.3mH inductor and 110pF capacitor was chosen to give a theoretical CkHz1.2 pF and a range of 3.6kHz.Of course, this strategy creates a new problem which is that the resonantfrequency is now out of the range of human hearing so it cannot be used directlyas the audio signal. This problem is solved by adding a second oscillator andheterodyning them. This is discussed further in section 2.4.2; however, at a highlevel, by adding a second oscillator at a fixed frequency the signals can be mixedto create a new signal containing the difference between their frequencies. This isvery useful since another fixed oscillator that runs at the resonant frequency ofthe variable oscillator connected to the antenna when no hands are near it canbe added. When a hand moves closer to the antenna, the variable oscillator’sfrequency decreases but the fixed oscillator holds its frequency resulting in anincreasing frequency difference between them. The frequency differencetheoretically will vary from 0Hz to the maximum the variable oscillator’sfrequency can decrease, in this case 3.6kHz, making it perfect to be directly usedas an audio signal.8
2.2.4Circuit - Variable Pitch OscillatorFigure 3 shows the final schematic of the Variable Pitch Oscillator (VPO). Thisoscillator uses the topology discussed in section 2.2.2. As stated in section 2.2.3,the the values used in the resonant tank (L2 and C5 ) are 3.3mH and 110pF for atheoretical resonant frequency of 264kHz. The antenna is also shown connectedthrough L1 . Since the antenna acts as a capacitor this gives us a series LC tankconnected to our parallel tank which is a commonly used technique in theremindesign to couple the antenna capacitance to the resonant tank. Unfortunately, itwas not simple to calculate the resonant frequency of the total system and L1had to be determined experimentally but was initially sized to give a 264kHzresonant frequency with the 12pF antenna capacitance to match the LC tank.Upon connecting the tank LC to the antenna LC and soldering the circuit onto aproto-board, a resonant frequency of about 225kHz was found. This was likelycaused by an inability to properly model the antenna LC and also parasiticcapacitance from connecting wires, which are likely on the order of pico faradswhich is a problem when the tank capacitance and antenna capacitance are110pF and 12pF respectively. While the resonant frequency fell short of whatwhat predicted, the range was within our expectations. In the playing area, a3kHz frequency change was easily produced. The total frequency change waseven more, but involved placing a hand very close to the antenna. The areadirectly near the antenna is unusable for playing since the capacitance change isnot nearly as linear as it is farther from the antenna.Figure 3: Variable Pitch OscillatorThe sine wave output is taken directly from the LC tank and buffered throughU2A before going through a voltage divider and buffer that drops the 24Vp psignal down to a 2.6Vp p signal needed for the mixer input. LF356 opamps areused exclusively because of their high speed and availability in the 6.101 lab.9
There are also 0.1µF capacitors placed closely to the power pins of all the opamps to help provide a clean power supply.2.2.5Theory - Fixed Frequency OscillatorAs discussed in section 2.2.3, heterodyning a high frequency fixed and variableoscillator allows us to sense the very small antenna capacitance change andtransform it into an audio signal. The design of this oscillator has threeimportant considerations.1. Must be highly stable - Since the audio frequency is the between the fixedand variable oscillators, frequency drifts of even a few hundred hertz couldbe noticeable. Since this oscillator operates in the 200kHz range thisnecessitates high stability2. Frequency Tunability - The fixed oscillator should be set to the resonantfrequency of the variable oscillator; however, because the ambientcapacitance and frequency drift of the oscillators can change that resonantfrequency, the fixed pitch oscillator must be tunable3. Sine or Square wave output - The mixer accepts both of these waveformsas shown in section 2.4.2An oscillator topology that satisfiesall three of these constraints is therelaxation oscillator, shown in figure4. This oscillator uses a comparatorand a RC circuit to generatea fixed frequency square wavethat switches between the positiveand negative voltage rails. When theoutput voltage of the comparator is atthe positive supply rail, C1 is chargedthrough R3 producing an increasingvoltage on the inverting input of thecomparator while the non-invertinginput is held at a constant voltageset by the R1 and R2 voltage divider.After enough time, C1 will haveFigure 4: A Relaxation Oscillatorcharged to a greater voltage than theconstant voltage on the non-invertinginput at which point the comparator’s output will go to the negative supply rail.After this, C1 will begin to discharge through R3 until it’s voltage reaches thevoltage at the non-inverting input of the comparator causing the output to gohigh again at which point the whole cycle will repeat forever.Since the comparator flips between high and low, a square wave outputwith a frequency given by equation 4 is produced.10
f 12ln(3)R3 C1(4)From equation 4 it is also evident that the frequency is only dependent on theR3 C1 time constant which is highly convenient because frequency tunability canbe added be simply replacing R3 with a potentiometer. Since it does not affectthe frequency, we can also simply set R1 equal to R2 .2.2.6Circuit - Fixed Pitch OscillatorFigure 5 shows the complete schematic of the Fixed Pitch Oscillator (FPO). Thefirst thing to note is the choice of the U1A as an LT1011A comparator for use inthe relaxation oscillator designed as in section 2.2.5. This was the fastestcomparator available in lab. The speed of the comparator actually ended upbeing an issue since at 225kHz (the frequency required to match the VPO) thesharp transition between the 12V power rails was very difficult to generatewithout seeing rounded edges on the square wave. Even the LT1011A was notfast enough to generate good square waves at 225kHz but fortunately since themixer only required a 2Vp p square wave the rounded square wave was able to beclipped which left a very nice square waveform. The clipping circuitry wascomposed of first a voltage divider with R11 and R14 which was needed becauseLF356 U2A had issues accepting the full signal. After this divider, there is abuffer and then a set of diodes. These diodes clip the output signal at 2V and-2V because the Vf of the 1N914 is 1V and there are two in series in oppositepolarities relative to ground.Figure 5: Fixed Pitch OscillatorThe LT1011A has an open collector output so connecting pin 1 to -12V andadding a pullup resistor to 12V allows us to get rail to rail output. The pullup11
resistor is actually three pullup resistors, R8 , R9 , and R10 , in parallel for acombined 500Ω. All three of these resistors were 21 Watt and placing them inparallel reduced the current seen by each one. This was done after finding that asingle 510Ω 18 Watt resistor got very hot and since heat could be a cause offrequency instability we wanted to avoid this.C10 was recommended to be placed between the balance pins by the datasheet. Other capacitors by the power rails are for supply filtering.The frequency of this oscillator was set to be around 225kHz which as seenin section 2.2.4 is the frequency that could be realized for the VPO. In figure 5,C8 and the resistor combination made by R5 , R6 , and R7 replace C1 and R3 fromequation 4 to determine the frequency of oscillation. C8 is set to be the low valueof 1.5nF as a low capacitance was found to help improve the quality of thesquare wave. The purpose of the resistor combination is to maximize the tuningsensitivity of the oscillator. It was shown in 2.2.5 that R3 from equation 4 couldbe replaced with a potentiometer to provide tunability. The challenge withtuning is that it must be highly sensitive because even slight variations of a fewhundred hertz create large change in the pitch. Early testing with a half turnpotentiometer was unsuccessful because it was difficult to turn the potentiometera small enough amount to get the desired frequency change. To get betterresolution, a 25 turn potentiometer was used instead so that the same amount ofturn produced less of a change in resistance and therefore less of a change infrequency. This resolution can be improved even further by placing a resistor inparallel with the potentiometer and taking advantage of the non-linearity of thetotal resistance of resistors in parallel.(a) Change in total resistance through po- (b) Change in frequency per turn of potententiometers full rangetiometerFigure 6: Tuning SensitivityFigure 6a shows the change in the total resistance of the resistor combination asgiven by the following equation:Rtotal R5 R6 R7R6 R7When the potentiometer R6 is near its upper limit the change in total resistanceis small compared to the change in potentiometer resistance. By properly sizing12
R5 and R7 , the frequency of 225kHz can be centered in this low slope area toprovide maximum tuning resolution. As shown in figure 6b, near 225kHz atuning resolution of around 1kHz per turn is achieved.The only remaining components are R12 and R13 which were made identicalbecause as discussed in section 2.2.5 their value does not affect the frequency.2.32.3.1Volume Oscillator (David)PurposeSimilar to the pitch oscillators, the volume oscillator (VO) is responsible fordetecting a capacitance change to produce a change in the audio output, in thiscase the volume. However, instead of producing a variable frequency audiosignal, the VO only needs to produce a frequency changing sine wave which aslater seen in section 2.4.4 will be transformed into a changing DC value toattenuate the volume of the audio signal.2.3.2Design - Volume OscillatorSince the VO only needs to produce a sine wave that changes frequencydepending on the capacitance of the antenna and hand, the oscillator topologycreated in 2.2.2 can be used with only some minor modifications. Noheterodyning is required because the voltage attenuation circuitry is capable ofdealing with the signals on the order of 100kHz range necessary to give goodsensitivity to changing capacitance. A resonant frequency of 455kHz with a 1mHinductor and 120pF capacitor in parallel with a 2-100pF variable capacitor was Fofselected. The higher frequency was chosen to give a higher theoretical CkHz1.87 pF . The variable capacitor was used because unlike in the pitch oscillators,where tuning to the ambient capacitance could be done through the FPO, thetuning for the VO must be done with the oscillator itself.2.3.3Circuit - Volume OscillatorFigure 7 shows the complete schematic of the VO. The design is almost identicalto the VPO from section 2.2.4. L1 and L2 were also chosen experimentally asthey were with the VPO. The VO was able to achieve a resonant frequency of450kHz and had a range of almost 12kHz.The output of the LC tank is buffered and then scaled down just as with theVPO; however, instead of a fixed voltage division we use potentiometer R2 toallow the output scaling to be modified.13
Figure 7: Volume Oscillator2.42.4.1Audio Generation (Patrick)PurposeThe audio generation circuitry has two roles: creating the audible pitch andcontrolling its volume. The pitch has to be extracted from the difference infrequency of the fixed pitch oscillator and the variable pitch oscillator. Thevolume has to be controlled using the variable frequency output of the volumeoscillator.The audio generation circuitry can be broken into three modules: a signalmixer, a frequency to DC voltage converter, and a voltage controlled attenuator.2.4.2Theory - Signal MixingThe fixed pitch oscillator (FPO) is tuned such that its output frequency is equalto the output of the variable pitch oscillator (VPO) when there is not a handnear the pitch antenna. This means that the difference in frequency betweenthese two signals is 0Hz when the theremin is not being played. As themusician moves their hand closer to the pitch antenna the variable pitchoscillator’s output will increase in frequency. This causes the difference betweenthe VPO’s frequency and the FPO’s frequency to increase. This differencereaches approximately 3KHz at its maximum. By building circuitry that cangenerate a sinusoid at this frequency difference the theremin can generate a pitchwith range 0Hz-3KHz. Performing this operation is the job of the mixer circuit.Given two sinusoids, y1 and y2 , with two different frequencies, f1 and f2 ,the multiplication of y1 y2 will lead to the creation of two sinusoids. One ofthese sinusoids will have frequency f1 f2 and the other will have frequencyf1 f2 . This is the principle of mixing two signals to generate a new signal of adifferent frequency. This multiplication operation is what the mixing cicuitryuses to generate a sinusoid with a frequency equal to the difference between theVPO’s frequency, fV P O , and the FPO’s frequency, fF P O . Along with outputting14
a sinusoid of frequency fV P O fF P O , which ranges from 0Hz-3KHz, themultiplication also generates a signal with a frequency of fV P O fF P O , which isnot the frequency we are interested in. However, this sum frequency isapproximately 500KHz, which means it can be easily filtered out since it issignificantly higher than the audible range.It is worth noting that it is not necessary for both of the input signals ofthe mixer to be sinusoids. In fact, our design uses a sinusoid for the variablepitch oscillator and a square wave for the fixed pitch oscillator. The generatedoutput of the mixer is still a sinusoid with a frequency equal to the difference ofthe two inputs. The reason this works can be seen in the fourier transform of asquare wave: 114sin(wo t) sin(3wo t) sin(5wo t) . . .(5)square(t) π35Due to the low-pass filtering on the mixer’s output only the sinusoid at thesquare wave’s fundamental frequency is of importance.2.4.3Circuit - Signal MixingThe signal mixing circuit can be seen in figure 8.Figure 8: Mixer CircuitThis is a single transistor mixer topology. The mixer circuit gates the output ofthe variable pitch oscillator by using a 2N3904 transistor and the output of thefixed pitch oscillator as the control signal. When the fixed pitch oscillator’soutput is a square wave, as it is in our case, this has the effect of producing anoutput that is the multiplication of the VPO’s output by the FPO’s output.The output of this multiplication is fed into a first order low-pass RC filter.This filter is used to remove any DC bias from the multiplication output. The-3dB point of this filter is 2Hz. This was a selected to be a decade below thelowest audible frequency, which is 20Hz. The output of this filter is bufferedbefore going into the next stage of the mixer.The next stage of the mixer removes the high frequency sinusoids that areproduced in the multiplication operation. This is done using a Sallen-Key secondorder low-pass filter. The cut-off frequency of this filter is 12,242Hz. This cut-off15
frequency is not quite a decade above our highest producable frequency (3KHz).This means the design sacrifices some attenuation of the higher frequencies for areduction in unwanted signals.Lastly, there is a variable, non-inverting voltage amplifier stage on theoutput of the mixer. The gain of this stage can be adjusted using a 10Kpotentiometer. The voltage gain can range from 1 to 2. This stage sets themaximum amplitude of the final line-level audio signal - thereby also setting themaximum volume that can be generated. The magnitude of the resulting mixeroutput signal can be adjusted from 680mVP P to 1.3VP P . The consumer gradeline-level standard for audio uses a maximum voltage of 890mVPP. So thisadjustable gain stage allows the instrument to be tuned to output a line-levelstandard voltage. While this stage outputs a maximum volume signal, thevoltage controlled attenuator (the details of which are covered in a later section)allows the musician to decrease the volume when playing the instrument.2.4.4Theory - Frequency to DC Voltage ConversionThe musician can control the volume of the instrument’s audio signal by movingtheir hand near the volume antenna. The volume oscillator outputs a sinusoidwhich varies in frequency based off of the distance of the musician’s hand to thevolume antenna. This varying frequency signal needs to be converted into a DCvoltage so that it can be used to control the voltage controlled attenuator. It isthe voltage controlled attenuator that will adjust the volume of the audio.The method used for converting a variable frequency signal to a variableDC voltage signal can be broken down into two steps. The first step is to passthe variable frequency signal through a low pass filter, with the goal ofattenuating the signal. The second step is to pass the output of the filterthrough a peak detector circuit.The first step of this process uses a low pass filter with a cut-off frequencybelow that of the input signal’s frequency. The output of this filter will be anattenuated version of the input signal. The magnitude of the attenuation willdepend on the input frequency. The higher the input frequency the more thesignal will be attenuated. So as the player moves their hand near the volumeantenna the frequency of the volume oscillator changes and the magnitude of thefilter’s output signal changes.The next step of this process passes the output of the low-pass filterthrough a peak detector. The peak detector detects the magnitude of theattenuated signal and produces a corresponding DC voltage. So after this stepthe variable frequency signal has been converted to a variable DC voltage signal.2.4.5Circuit - Frequency to DC Voltage ConversionThe frequency to DC voltage converter circuit can be seen in figure 9 and 10.For visibility this circuit has been cut in two. The output of figure 9 flows intothe input of figure 10.The first block in figure 9 is a third order Sallen-Key low-pass filter with acut-off frequency of 300KHz. This filter implements the low-pass filter stage16
Figure 9: Frequency To DC 1Figure 10: Frequency To DC 2discussed in section 2.4.4. The third order filter provides a -60dB/decattenuation above the cut-off frequency. The cut-off frequency was selected to belower than the 450KHz volume oscillator signal, but not low enough to vastlyattenuate the signal. This filter was chosen to be a third order filter to produce alarge range of attenuation over the relatively small frequency change produced17
by the volume oscillator.The second block in figure 9 is a peak detector circuit. This circuitconverts the changing frequency/amplitude signal from the output of thelow-pass filter into a DC voltage. It does this by first rectifying the signal using a1N914 diode and then low-passing that rectified signal. The output of thisdetector circuit is buffered before being passed to the next block in the circuit.The next block in the circuit can be seen in figure 10. This block, at the top leftof the figure, is an adder circuit. The transfer function for this block is:vout R9(v1 v2 )1000(6)R9 is a 1Meg potentiometer. So this stage has a voltage gain that ranges from 0to 1000. This adder allows the instrument to be tuned such that the outputvolume is silenced when there is no hand near the volume antenna. When thereis no hand near the volume antenna there is a non-zero DC voltage produced atthe output of the peak detector. This signal needs to be shifted down to 0V sothat it will produce silent audio when used to control the voltage controlledattenuator.So the output of the peak detector, v1 , is shifted down by the negativevoltage v2 . The voltage v2 is generated by the circuit block at the bottom offigure 10. This block is a voltage follower that is following the out
6.101 Final Project Theremin Pedro Brito David Gomez Patrick McCabe May 12, 2016 1. Abstract The goal of this project is to create a theremin. A theremin is a musical in-strument that is played without physical contact. This is achieved by using two antennas, one controls the pitch and the other the volume, which are