Transcription
NetworkX:Network Analysis with PythonSalvatore ScellatoFrom a tutorial presented at the 30th SunBelt Conference“NetworkX introduction: Hacking social networks using the Python programming language”by Aric Hagberg & Drew Conway1Thursday, 1 March 2012
Outline1. Introduction to NetworkX2. Getting started with Python and NetworkX3. Basic network analysis4. Writing your own code5. You are ready for your own analysis!2Thursday, 1 March 2012
1. Introduction to NetworkX.3Thursday, 1 March 2012
Introduction to NetworkX - network analysisVast amounts of network data are being generated and collected Sociology: web pages, mobile phones, social networks Technology: Internet routers, vehicular flows, power gridsHow can we analyse these networks?Python NetworkX!4Thursday, 1 March 2012
Introduction to NetworkX - Python awesomeness5Thursday, 1 March 2012
Introduction to NetworkX - Python in one slidePython is an interpreted, general-purpose high-level programming languagewhose design philosophy emphasises code readability.“there should be one (and preferably only one) obvious way to do it”. Use of indentation for block delimiters (!!!!) Multiple programming paradigms: primarily object oriented and imperativebut also functional programming style. Dynamic type system, automatic memory management, late binding. Primitive types: int, float, complex, string, bool. Primitive structures: list, tuple, dictionary, set. Complex features: generators, lambda functions, list comprehension, listslicing.6Thursday, 1 March 2012
Introduction toNetworkX“Python package for the creation,manipulation and study of thestructure, dynamics and functions ofcomplex networks.” Data structures for representing manytypes of networks, or graphs Nodes can be any (hashable) Pythonobject, edges can contain arbitrary data Flexibility ideal for representingnetworks found in many different fields Easy to install on multiple platforms Online up-to-date documentation First public release in April 20057Thursday, 1 March 2012
Introduction to NetworkX - design requirements Tool to study the structure and dynamics of social, biological, andinfrastructure networks Ease-of-use and rapid development Open-source tool base that can easily grow in a multidisciplinaryenvironment with non-expert users and developers An easy interface to existing code bases written in C, C , andFORTRAN To painlessly slurp in relatively large nonstandard data sets8Thursday, 1 March 2012
Introduction to NetworkX - object modelNetworkX defines no custom node objects or edge objects node-centric view of network nodes can be any hashable object, while edges are tuples with optional edgedata (stored in dictionary) any Python object is allowed as edge data and it is assigned and stored in aPython dictionary (default empty)NetworkX is all based on Python Instead, other projects use custom compiled code and Python: Boost Graph,igraph, Graphviz Focus on computational network modelling not software tool development Move fast to design new algorithms or models Get immediate results9Thursday, 1 March 2012
Introduction to NetworkX - how to chooseWhen should I USE NetworkX to perform network analysis? Unlike many other tools, it is designed to handle data on a scale relevant tomodern problems. Most of the core algorithms rely on extremely fast legacy code Highly flexible graph implementations (a graph/node can be anything!) Extensive set of native readable and writable formats Takes advantage of Python’s ability to pull data from the Internet or databasesWhen should I AVOID NetworkX to perform network analysis? Large-scale problems that require faster approaches (i.e. massive networkswith 100M/1B edges) Better use of memory/threads than Python (large objects, parallel computation)10Thursday, 1 March 2012
Introduction to NetworkX - quick exampleUse Dijkstra’s algorithm to find the shortest path in a weighted andunweighted network: import networkx as nx g nx.Graph() g.add edge(’a’,’b’,weight 0.1) g.add edge(’b’,’c’,weight 1.5) g.add edge(’a’,’c’,weight 1.0) g.add edge(’c’,’d’,weight 2.2) print nx.shortest path(g,’b’,’d’)[’b’, ’c’, ’d’] print nx.shortest path(g,’b’,’d’,weighted True)[’b’, ’a’, ’c’, ’d’]11Thursday, 1 March 2012
Introduction to NetworkX - Python’s Holy TrinityPython’s primary libraryfor mathematical andstatistical computing.Containing sub-libs for Numeric optimisation Linear algebra .and many othersThe primary data typein SciPy is an array, sodata manipulation issimilar to that ofMATLAB.NumPy is an extensionof the SciPy data typeto includemultidimensionalarrays and matrices.Provides manyfunctions for workingon arrays and matrices.Both SciPy and NumPyrely on the C libraryLAPACK for very fastimplementation.matplotlib is primaryplotting library inPython Supports 2- and 3-Dplotting API allows embeddingin appsAll plots are highlycustomisable andready for professionalpublication.12Thursday, 1 March 2012
Introduction to NetworkX - drawing and plotting It is possible to draw small graphs within NetworkX and to export networkdata and draw with other programs (i.e., GraphViz, matplotlib)13Thursday, 1 March 2012
Introduction to NetworkX - official websitehttp://networkx.lanl.gov/14Thursday, 1 March 2012
Introduction to NetworkX - online resourcesOnline documentation and active mailing list with helpful developers andcontributors hursday, 1 March 2012
2. Getting started with Python and NetworkX.16Thursday, 1 March 2012
Getting started - import NetworkXStart Python (interactive or script mode) and import NetworkX: import networkx as nxThere are different Graph classes for undirected and directed networks. Let’screate a basic Graph class g nx.Graph() # empty graphThe graph g can be grown in several ways. NetworkX includes many graphgenerator functions and facilities to read and write graphs in many formats.17Thursday, 1 March 2012
Getting started - add nodes# One node at a time g.add node(1) # method of nx.Graph# A list of nodes g.add nodes from([2 ,3])# A container of nodes h nx.path graph(10) g.add nodes from(h) # g now contains the nodes of h# In contrast, you can remove any node of the graph g.remove node(2)18Thursday, 1 March 2012
Getting started - node entitiesA node can be any hashable object such as strings, numbers, files,functions, and more. This provides important flexibility to all your projects. import math g.add node(math.cos) # cosine function fh open(’tmp.txt’,’w’) # file handle g.add node(fh) print g.nodes()[ built-in function cos , open file ’tmp.txt’, mode ’w’at 0x30dc38 ]19Thursday, 1 March 2012
Getting started - add edges# Single edge g.add edge(1,2) e (2,3) g.add edge(*e) # unpack edge tuple# List of edges g.add edges from([(1 ,2) ,(1 ,3)])# Container of edges g.add edges from(h.edges())# In contrast, you can remove any edge of the graph g.remove edge(1,2)20Thursday, 1 March 2012
Getting started - access nodes and edges g.add edges from([(1 ,2) ,(1 ,3)]) g.add node(‘a’) g.number of nodes() # also g.order()4 g.number of edges() # also g.size()2 g.nodes()[1, 2, 3, ‘a’] g.edges()[(1, 2), (1, 3)] g.neighbors(1)[2, 3] g.degree(1)221Thursday, 1 March 2012
Getting started - Python dictionariesNetworkX takes advantage of Python dictionaries to store node and edgemeasures. The dict type is a data structure that represents a key-value mapping.# Keys and values can be of any data type fruit dict {"apple":1,"orange":[0.23,0.11],42:True}# Can retrieve the keys and values as Python lists (vector) fruit dict.keys()[ "orange" , "apple" , 42 ]# Or create a (key,value) tuple fruit 2,True)]# This becomes especially useful when you master Python listcomprehension22Thursday, 1 March 2012
Getting started - access nodes and edgesAny NetworkX graph behaves like a Python dictionary with nodes as primary keys (only foraccess!) g.add node(1, time ’5pm’) g.node[1][’time’]’5pm’ g.node[1] # Python dictionary{’time’: ’5pm’}The special edge attribute ’weight’ should always be numeric and holds values used byalgorithms requiring weighted edges. g.add edge(1, 2, weight 4.0 ) g[1][2][‘weight’] 5.0 # edge already added g[1][2]{‘weight’: 5.0}23Thursday, 1 March 2012
Getting started - node and edge iteratorsMany applications require iteration over nodes or over edges: simple and easy inNetworkX g.add edge(1,2) for node in g.nodes():print node, g.degree(node)1, 12, 1 g.add edge(1,3,weight 2.5) g.add edge(1,2,weight 1.5) for n1,n2,attr in g.edges(data True): # unpackingprint n1,n2,attr[‘weight’]1, 2, 1.51, 3, 2.524Thursday, 1 March 2012
Getting started - directed graphs dg nx.DiGraph() dg.add weighted edges from([(1,4,0.5), (3,1,0.75)]) dg.out degree(1,weighted True)0.5 dg.degree(1,weighted True)1.25 dg.successors(1)[4] dg.predecessors(1)[3]Some algorithms work only for undirected graphs and others are not well defined fordirected graphs. If you want to treat a directed graph as undirected for somemeasurement you should probably convert it using Graph.to undirected()25Thursday, 1 March 2012
Getting started - multigraphsNetworkX provides classes for graphs which allow multiple edges between any pairof nodes, MultiGraph and MultiDiGraph.This can be powerful for some applications, but many algorithms are not welldefined on such graphs: shortest path is one example.Where results are not well defined you should convert to a standard graph in a waythat makes the measurement well defined. mg nx.MultiGraph() mg.add weighted edges from([(1,2,.5), (1,2,.75),(2,3,.5)]) mg.degree(weighted True){1: 1.25, 2: 1.75, 3: 0.5}26Thursday, 1 March 2012
Getting started - graph operatorsClassic graph operationssubgraph(G, nbunch) - induce subgraph of G on nodes in nbunchunion(G1,G2) - graph uniondisjoint union(G1,G2) - graph union assuming all nodes are differentcartesian product(G1,G2) - return Cartesian product graphcompose(G1,G2) - combine graphs identifying nodes common to bothcomplement(G) - graph complementcreate empty copy(G) - return an empty copy of the same graph classconvert to undirected(G) - return an undirected representation of Gconvert to directed(G) - return a directed representation of G27Thursday, 1 March 2012
Getting started - graph generators# small famous graphs petersen nx.petersen graph() tutte nx.tutte graph() maze nx.sedgewick maze graph() tet nx.tetrahedral graph()# classic graphs K 5 nx.complete graph(5) K 3 5 nx.complete bipartite graph(3,5) barbell nx.barbell graph(10,10) lollipop nx.lollipop graph(10,20)# random graphs er nx.erdos renyi graph(100,0.15) ws nx.watts strogatz graph(30,3,0.1) ba nx.barabasi albert graph(100,5) red nx.random lobster(100,0.9,0.9)28Thursday, 1 March 2012
Getting started - graph I/ONetworkX is able to read/write graphs from/to files using common graph formats: edge lists adjacency lists GML GEXF Python pickle GraphML Pajek LEDA YAMLWe will see how to read/write edge lists.29Thursday, 1 March 2012
Getting started - read and write edge listsGeneral read/write format g nx.read format(“path/to/file.txt”,.options.) nx.write format(g,“path/to/file.txt”,.options.)Read and write edge listsg nx.read edgelist(path,comments '#',create using None,delimiter ' ',nodetype None,data True,edgetype None,encoding 'utf-8')nx.write edgelist(g,path,comments '#',delimiter ' ',data True,encoding 'utf-8')Formats Node pairs with no data:1 2 Python dictionary as data:1 2 {'weight':7, 'color':'green'} Arbitrary data:1 2 7 green30Thursday, 1 March 2012
Getting started - draw a graphNetworkX is not primarily a graph drawing package but it provides basic drawingcapabilities by using matplotlib. For more complex visualization techniques itprovides an interface to use the open source GraphViz software package. import pylab as plt #import Matplotlib plotting interfaceg nx.erdos renyi graph(100,0.15)nx.draw(g)nx.draw random(g)nx.draw circular(g)nx.draw spectral(g)plt.savefig(‘graph.png’)Note that the drawing package in NetworkX is not (yet!) compatible with Pythonversions 3.0 and above.31Thursday, 1 March 2012
3. Basic network analysis.32Thursday, 1 March 2012
Basic network analysis - graph propertiesLet’s load the Hartford drug users network: it’s a directed graph with integers asnodes.hartford nx.read edgelist('hartford.txt',create using nx.DiGraph(),nodetype int)N,K hartford.order(), hartford.size()avg deg float(K)/Nprint "Nodes: ", Nprint "Edges: ", Kprint "Average degree: ", avg deg33Thursday, 1 March 2012
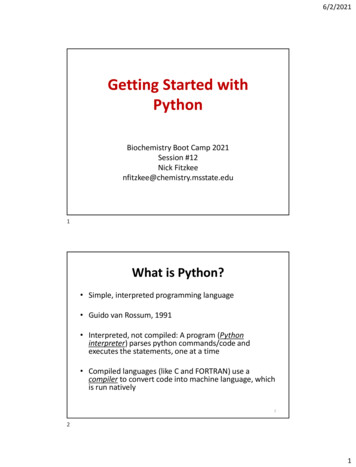
Basic network analysis - degree distributionLet’s compute in- and out-degree distribution of the graph and plot them. Don’t try this methodwith massive graphs, it’s slow.!in degrees hartford.in degree() # dictionary node:degreein values sorted(set(in degrees.values()))in hist [in degrees.values().count(x) for x in in values]plt.figure()plt.plot(in values,in hist,'ro-') # in-degreeplt.plot(out values,out hist,'bv-') # t.xlabel('Degree')plt.ylabel('Number of nodes')plt.title('Hartford drug users network')plt.savefig('hartford degree distribution.pdf')plt.close()34Thursday, 1 March 2012
Basic network analysis - degree distribution35Thursday, 1 March 2012
Basic network analysis - clustering coefficientWe can get the clustering coefficient of individual nodes or of all the nodes (but the first we convertthe graph to an undirected one):hartford ud hartford.to undirected()# Clustering coefficient of node 0print nx.clustering(hartford ud, 0)# Clustering coefficient of all nodes (in a dictionary)clust coefficients nx.clustering(hartford ud)# Average clustering coefficientccs nx.clustering(hartford ud)avg clust sum(ccs.values()) / len(ccs)36Thursday, 1 March 2012
Basic network analysis - node centralitiesNow, we will extract the main connected component; then we will compute nodecentrality measures.hartford components nx.connected component subgraphs(hartford ud)hartford mc hartford components[0]# Betweenness centralitybet cen nx.betweenness centrality(hartford mc)# Closeness centralityclo cen nx.closeness centrality(hartford mc)# Eigenvector centralityeig cen nx.eigenvector centrality(hartford mc)37Thursday, 1 March 2012
Basic network analysis - most central nodesTo find the most central nodes we will learn Python’s list comprehension technique to dobasic data manipulation on our centrality dictionaries.def highest centrality(cent dict):"""Returns a tuple (node,value) with the nodewith largest value from Networkx centrality dictionary."""# Create ordered tuple of centrality datacent items [(b,a) for (a,b) in cent dict.iteritems()]# Sort in descending ordercent items.sort()cent items.reverse()return tuple(reversed(cent items[0]))38Thursday, 1 March 2012
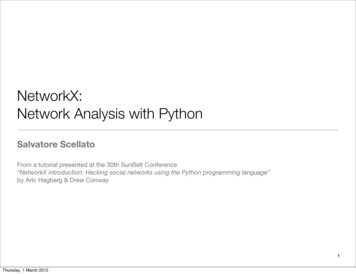
Basic network analysis - plotting resultsRecall Python’s scientific computing trinity: NumPy, SciPy and matplotlib.While NumPy and SciPy do most of the behind the scenes work, you will interactwith matplotlib frequently when doing network analysis.We will need to create a function that takestwo centrality dict and generates this plot:1. Create a matplotlib figure2. Plot each node label as a point3. Add a linear best-fit trend4. Add axis and title labels5. Save figure on a file39Thursday, 1 March 2012
Basic network analysis - plotting resultsdef centrality scatter(dict1,dict2,path "",ylab "",xlab "",title "",line False):# Create figure and drawing axisfig plt.figure(figsize (7,7))ax1 fig.add subplot(111)# Createitems1 items2 xdata [bydata [bitems and extract s())for a,b in items1]for a,b in items2]# Add each actor to the plot by IDfor p in xrange(len(items1)):ax1.text(x xdata[p], y ydata[p],s str(items1[p][0]), color "b")40Thursday, 1 March 2012
Basic network analysis - plotting results.continuing.if line:# use NumPy to calculate the best fitslope, yint plt.polyfit(xdata,ydata,1)xline plt.xticks()[0]yline map(lambda x: slope*x yint,xline)ax1.plot(xline,yline,ls '--',color 'b')# Set new x- and y-axis limitsplt.xlim((0.0,max(xdata) (.15*max(xdata))))plt.ylim((0.0,max(ydata) (.15*max(ydata))))# Add labels and saveax1.set title(title)ax1.set xlabel(xlab)ax1.set ylabel(ylab)plt.savefig(path)41Thursday, 1 March 2012
Basic network analysis - export resultsEven though NetworkX and the complementing scientific computing packages inPython are powerful, it may often be useful or necessary to output your data foradditional analysis because: suite of tools lacks your specific needyou require alternative visualisationyou want to store results for later analysisIn most cases this will entail either exporting the raw network data, or metrics fromsome network analysis1. NetworkX can write out network data in as many formats as it can read them,and the process is equally straightforward2. When you want to export metrics we can also use Python’s built-in XML andCSV libraries, or simply write to a text file.42Thursday, 1 March 2012
Basic network analysis - write results to fileLet’s export a CSV file with node IDs and the related centrality values on each line:this can be then used to plot without computing again all centrality measures.results [(k,bet cen[k],clo cen[k],eig cen[k])for k in hartford mc]f open('hartford results.txt','w')for item in n')f.close()43Thursday, 1 March 2012
4. Writing your own code.44Thursday, 1 March 2012
Write your own code - BFSWith Python and NetworkX it’s easy to write any graph-based algorithmfrom collections import dequedef breadth first search(g, source):queue deque([(None, source)])enqueued set([source])while queue:parent,n queue.popleft()yield parent,nnew set(g[n]) enqueuedenqueued newqueue.extend([(n, child) for child in new])45Thursday, 1 March 2012
Write your own code - network triadsExtract all unique triangles in a graph with integer node IDsdef get triangles(g):for n1 in g.nodes:neighbors1 set(g[n1])for n2 in filter(lambda x: x n1, nodes):neighbors2 set(g[n2])common neighbors1 & neighbors2for n3 in filter(lambda x: x n2, common):yield n1,n2,n346Thursday, 1 March 2012
Write your own code - average neighbours’ degreeCompute the average degree of each node’s neighbours (long and one-liner version).def avg neigh degree(g):data {}for n in g.nodes():if g.degree(n):data[n] float(sum(g.degree(i) for i in g[n]))/g.degree(n)return datadef avg neigh degree(g):return dict((n,float(sum(g.degree(i) for i in g[n]))/g.degree(n)) for n in g.nodes() if g.degree(n))47Thursday, 1 March 2012
5.You are ready for your own analysis!48Thursday, 1 March 2012
What you have learnt today about NetworkX How to create graphs from scratch, with generators and by loading localdata How to compute basic network measures, how they are stored in NetworkXand how to manipulate them with list comprehension Getting data out of NetworkX as raw network data or analytics How to use matplotlib to visualize and plot results (useful for final report!) How to use and include NetworkX features to design your own algorithms/analysis49Thursday, 1 March 2012
Useful links Code&data used in this lecture: http://www.cl.cam.ac.uk/ ss824/stna-examples.tar.gz NodeXL: a graphical front-end that integrates network analysis into Microsoft Office and Excel.(http://nodexl.codeplex.com/) Pajek: a program for network analysis for Windows (http://pajek.imfm.si/doku.php). Gephi: an interactive visualization and exploration platform (http://gephi.org/) Power-law Distributions in Empirical Data: tools for fitting heavy-tailed distributions to data(http://www.santafe.edu/ aaronc/powerlaws/) GraphViz: graph visualization software (http://www.graphviz.org/) Matplotlib: full documentation for the plotting library (http://matplotlib.sourceforge.net/)50Thursday, 1 March 2012
Questions?Salvatore ScellatoEmail: salvatore.scellato@cl.cam.ac.ukWeb: www.cl.cam.ac.uk/ ss824/51Flickr: sean dreilingerThursday, 1 March 2012
Getting started - Python dictionaries NetworkX takes advantage of Python dictionaries to store node and edge measures. The dict type is a data structure that represents a key-value mapping. # Keys and values can be of any data type fruit_dict {"apple":1,"orange":[0.23,0.11],42:True} # Can retrieve the keys and values as Python lists (vector)