Transcription
Report to the Governor’s Task Force on ClimateChangeSTRATEGIES TO IMPROVE WISCONSIN’S CLIMATE RESILIENCE ANDREADINESSSubmitted: July 31, 2020Wisconsin Initiative on Climate Change Impacts (WICCI):A partnership of the University of Wisconsin-Madison Nelson Institute for Environmental Studiesand the Wisconsin Department of Natural Resources40 Science Hall550 North Park StreetMadison, Wisconsin 53706www.wicci.wisc.edu
Table of ContentsIntroduction: Improving Wisconsin’s Climate Resilience and Readiness3Climate Science Update4Subcommittee on Energy, Housing & Infrastructure11Making climate information available and usable for Wisconsin Communities13Wisconsin’s infrastructure is a source of greenhouse gases and vulnerable to climate impacts14Mississippi River commodity transportation, tourism, and ecology are seeing large scale lossesdue to climate impacts18Great Lakes coastal industry and community stability are at risk from climate change20Subcommittee on Healthy Communities & Strong Economy23Protecting human health by accelerating Wisconsin’s transition to clean, renewable energy25Tourism and outdoor recreation face declining seasonal recreation opportunities27Building climate-resilient communities to improve human health and safety30Subcommittee on Land Use & Conservation32Keeping agricultural fields green year-round to benefit Wisconsin agriculture andenvironmental health35Big shifts are needed to protect Wisconsin’s rivers, lakes, and wetlands from climate impacts37Coastal natural resources vital to Great Lakes communities and Tribal Nations are at risk fromclimate change41Plants and natural community threats and extinction rates are accelerating due to climate change43Deer browsing and milder winters are threatening Wisconsin’s forests and forest industry47Iconic coldwater fisheries are at risk from climate change49Wisconsin Initiative on Climate Change Impacts Working Groups253
Introduction: Improving Wisconsin’s Climate Resilience and ReadinessThrough Executive Order 52, Governor Tony Evers directed theDepartment of Natural Resources to make its scientific data available tothe Task Force by working with the Wisconsin Initiative on Climate ChangeImpacts (WICCI) and University of Wisconsin-Madison Nelson Institute forEnvironmental Studies to collect updated, impartial scientific data on therate of climate change in Wisconsin and its impact on Wisconsin’s naturalenvironment. The WICCI is a statewide collaboration of scientists andstakeholders formed in 2007 as a partnership to evaluate climate changeimpacts on Wisconsin. Our working groups are made up of scientists,experts, and practitioners. With this report, we present information onimpacts from climate change specific to Wisconsin and science-basedsolutions and strategies to address these impacts. While we provide somepolicy ideas to consider, our primary aim is to help inform policy prioritiesby providing expert analysis on key issues for consideration by theGovernor’s Task Force on Climate Change. For a video overview of climateimpacts in Wisconsin, please visit the WICCI website.3Environmental/Social JusticeThroughout this report, we highlightissues of environmental justice whereclimate impacts put Blackcommunities, Tribal Nations, othercommunities of color, and lowincome communitiesdisproportionately at risk. Justicerequires the fair treatment andmeaningful involvement of all people,regardless of race, color, nationalorigin, or income.
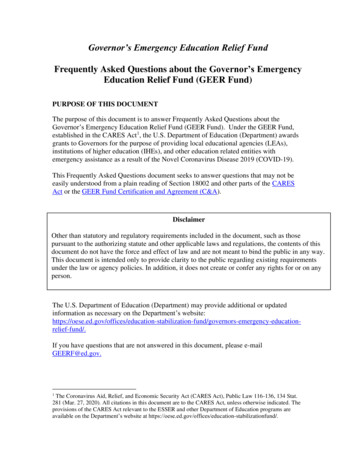
Climate Science UpdateOur climate is changing in many ways. From record melting of Arctic sea ice to more extreme storms, massivewildfires, and prolonged drought, communities around the world are already experiencing the impacts. The sciencelinking these climatic changes to human-caused increases in greenhouse gasses – especially carbon dioxide – is clear.Indeed, since the middle of the 19th century, scientists have known that:“An atmosphere of [carbon dioxide] would give to our earth a high temperature; and if as some suppose, atone period of its history the air had mixed with it a larger proportion [of carbon dioxide] than at present, anincreased temperature must necessarily have resulted.” (Eunice Foote, 1856)Over the last 165 years Eunice Foote’s scientific hypothesis about our planet’s past has been borne out in a livedexperiment that we carry into our future. And, as carbon dioxide continues to accumulate in our atmosphere, we willcontinue to experience its effects in our changing climate.In Wisconsin, our climate is changing along with the rest of the world. And, like elsewhere, Wisconsin citizens andbusinesses are already feeling the impacts. In the decade since WICCI released its 2011 Assessment Report1, theWICCI Climate Working Group has continued to advance our understanding of climate change in Wisconsin. Threemain findings have emerged: New analyses of historical climatic changes over the last ten years – especially seasonal warming,precipitation changes, and increases in extreme climatic events – are consistent with findings and projectionsfrom WICCI’s 2011 Assessment ReportAdditional information from new climate model simulations and analyses continue to support the findingsand projections from WICCI’s 2011 Assessment ReportNew scientific findings and analyses add additional confidence to findings from WICCI’s 2011 AssessmentReport, and provide new insight on specific climatic impacts that are relevant for WisconsinThis section provides a brief update to the climate science presented in the WICCI 2011 Assessment Report.Historical Temperature and Precipitation ChangesOne of the clearest signs of climate change is the increase in temperature that our planet is experiencing. Since 1880,average global temperatures have increased by about 1.8 F. According to National Oceanic and AtmosphericAdministration (NOAA), average annual global temperatures have increased steadily since the 1960’s. Figure 1 showsdeviations from the average global temperature (depicted as the horizontal line at 0.00 degrees C. Every blue bar is ayear that was colder than average temperature of the 20th century; red bars are years that were warmer than the 20thcentury average. Nineteen of our planet’s twenty warmest years have occurred since 2001 with 1998 (the warmestWisconsin’s Changing Climate: Impacts and Adaptation. 2011. Wisconsin Initiative on Climate Change Impacts. Nelson Institute forEnvironmental Studies, University of Wisconsin-Madison and the Wisconsin Department of Natural Resources, Madison, Wisconsin.14
year in the 20th century) being the twentieth.In fact, it is likely that the coldest year we willexperience in the next century will still bewarmer than 1998. Global temperature isprojected to continue to warm by anadditional 2.7 F by 2050 and 3.6-7.2 F by21002.Wisconsin is warming. To determine changesin Wisconsin’s climate, the WICCI ClimateWorking Group analyzed regional data from aglobal network of observations compiled byFigure 1. Global temperature anomalies from 1880-2019.the National Climatic Data Center3. ThisNational Oceanic and Atmospheric Administration (NOAA). Plotdataset shows that Wisconsin has becomeproduced by the Wisconsin Initiative on Climate Change Impacts.2.1oF warmer since the 1950s, with wintersClimate Working Group.warming more rapidly than summer (Figure2). Further, the updated trends confirm that nighttime low temperatures are warming faster than daytime hightemperatures4. These seasonal and daily temperature changes are consistent with global climate model predictionsreported in the WICCI 2011 Assessment Report.Wisconsin is becoming wetter. In fact, since the 2011 WICCI Assessment report was released, all nine of Wisconsin’sclimate divisions have reported their wettest decade in recorded history. Since 1950, Wisconsin’s annual precipitationhas increased by about 4.5 inches, or about 15% (Figure 3). Winter precipitation has increased by over 20% since1950, which is consistent with statistically significant increases in snowfall over the state since 19505. Most ofWisconsin’s precipitation occurs during the warm season, but over much of the state annual increases are dominatedby increases during spring and fall. It is worth noting that the drastic increase in annual precipitation is larger thanexpected from climate change alone: the recent increases in precipitation are likely due to some combination ofclimate change and (random) natural variations. The robust precipitation increases during winter and spring areconsistent with projections made in the 2011 WICCI Assessment Report.Chapter 12 of the IPCC Fifth Assessment Report: Collins, M., R. Knutti, J. Arblaster, J.L. Dufresne, T. Fichefet, P. Friedlingstein, X. Gao,W.J. Gutowski, T. Johns, G. Krinner, M. Shongwe, C. Tebaldi, A.J. Weaver and M. Wehner, 2013: Long-term Climate Change: Projections,Commitments and Irreversibility. In: Climate Change 2013: The Physical Science Basis. Contribution of Working Group I to the FifthAssessment Report of the Intergovernmental Panel on Climate Change [Stocker, T.F., D. Qin, G.K. Plattner, M. Tignor, S.K. Allen, J.Boschung, A. Nauels, Y. Xia, V. Bex and P.M. Midgley (eds.)]. Cambridge University Press, Cambridge, United Kingdom and New York, NY,USA. https://www.ipcc.ch/report/ar5/syr/3 See https://data.nodc.noaa.gov/cgi-bin/iso?id gov.noaa.ncdc:C00005; Vose, R. S., and Coauthors, 2014: Improved HistoricalTemperature and Precipitation Time Series for U.S. Climate Divisions. J. Appl. Meteor. Climatol., 53, 1232–1251, https://doi.org/10.1175/JAMC-D-13-0248.14 Additional graphics are available from the WICCI website at http://www.wicci.wisc.edu5 From Wisconsin State Climatology Office: -00-snow-djf.gif25
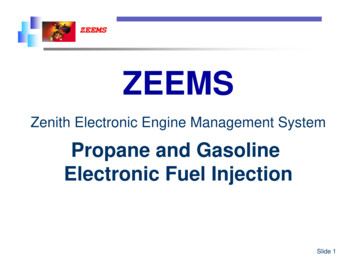
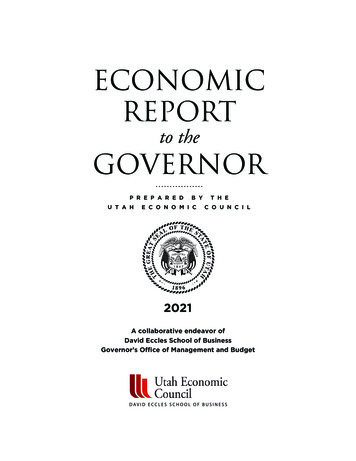
Figure 2. Changes in (left) annual, (middle) winter, and (right) summer mean temperature from 1950-2019.Changes are calculated as trends over the time period 1950-2019 ( F per year) times the number of years (70yr).Asterisks indicate that the trend is statistically significant. Data source: NOAA NCDC nClimDiv./Extreme precipitation events are becoming more common in Wisconsin. Increases in extreme precipitation since the2011 report have taken a significant toll on Wisconsin communities, inflicting tens to hundreds of millions of dollars ofdamage over the last decade. Figure 4 shows that numerous communities have experienced 100 year or greaterrainfall events over the last decade and that the 2010s was Wisconsin’s wettest decade in recorded history. Floodingrelated to these events has led to significant damage to business and residential infrastructure, agriculturalcommunities, and human health and well-being. While increases in extreme precipitation were predicted in the 2011WICCI Assessment report, new research since 2011 has led to significant improvements in our understanding of howclimate change is likely to affect these events. Most notably, research shows that VERY extreme events – 100 year,Figure 3. Changes in (left) annual, (middle) winter, and (right) summer precipitation from 1950-2019. Changes arecalculated as trends over the time period 1950-2019 ( F per year) times the number of years (70yr). Asterisksindicate that the trend is statistically significant. Data source: NOAA NCDC nClimDiv.6
6.00100yr Precipitation Event (in) andExtreme Events during 2010-20209.655.436.255.134.486.257.316.00 7.186.155.976.52Future Projections5.186.005.755.505.257.5010.52Inches500 year, or 1000 year events like thoseexperienced in Northern Wisconsin during2012, 2016, and 2018; or in August 2018 inSouth Central Wisconsin – are most stronglyaffected by a warming climate. While theseevents are rare, they are also exceedinglydamaging and are becoming disproportionatelymore common globally as our climate warms.5.00To produce projections of temperature and4.755.75precipitation into the 21st century, the 20117.567.1011.634.50WICCI Assessment Report used the University6.334.256.12of Wisconsin Probabilistic Downscaling DataVersion 1. This data uses a “statisticalNOTES: The extreme rainfall events are the largest independent events that exceeded the 100yr threshold.If an extreme event was recorded at numerous locations, only the largest recorded value was showed.downscaling” technique in which global scaleAny two-day events were classified by their largest value recorded.Figure 4. Climatological100yr rainfall event magnitudeSOURCE: Nelson Institute, Center for Climatic Research, UW-MadisonDATA: UWPD Downscaled Dataclimate model projections are combined with(shading) together with historical extreme rainfall events overlocal observations to produce estimates ofthe time period 2010-2020 (dots with numbering). Each eventclimate variations and change over a moreis the largest daily rainfall recorded at a given location over thelocalized scale. This update uses the Universitytime period 2010-2020. For multi-day events, only the day withof Wisconsin Probabilistic Downscaling Datathe largest rainfall is recorded. Data from WICCI and E.Version 3 (WICCI Data), which is based onHopkins, State Climatology Office.updated global models and an improvedmethodology. The WICCI Data includes nearly twice as many global models and, like the 2011 Assessment Report,results are presented either as an average over all models (maps), or as a range (10th-90th percentile) of possiblechanges that account for simulated natural variability as well as differences in physical processes across global modelsimulations (e.g. annual warming of 2.5 -7.5 F). The WICCI Climate Working Group has also produced “dynamicallydownscaled” projections in which the global models are used to force high-resolution regional climate models. Thesesimulations provide additional information about potential climatic changes in Wisconsin, and results are reportedfrom the dynamically downscaled projections where relevant.In addition to a change in data source, the methodology for calculating future projections has changed since the 2011WICCI Assessment Report. One major change is that future projections are now calculated relative to a baselineclimatology of 1981-2010 rather than 1960-1999, in order to be consistent with new standards for defining a “climatenormal.”6 Two different emissions scenarios are included where relevant: the RCP4.5 scenario is a “low-end” globalemissions scenario over the next century and the RCP8.5 scenario is a “high-end” or “business as usual” normals7
Figure 5. Projected changes in mid-21st-century (2041-2060) (left) annual, (middle) winter, and (right) summeraverage temperature for RCP4.5 “low-end” emissions scenario. WICCI Data.The WICCI projections show very similar climatic changes to those in the 2011 WICCI Assessment Report. In particular,the WICCI projections show that under the low-end emissions scenario Wisconsin is expected to warm by 2.5 -7.5 Fby mid-century, with maximum warming during winter (3 -8 F) and minimum warming during summer (1.5 -7.5 )(Figure 5). Dynamically downscaled results are similar but have larger warming rates for summer due to increased drysoil conditions. For mid-century, projections for the high-end emissions scenario are very similar to the low-endscenario, with annual mean warming of about 3 F-9 F by mid-century. By late century (2081-2100) projections ofannual mean temperature for the low-end and high-end emissions scenarios differ substantially with the low-endemissions scenario projecting annual mean changes of 3 -10 F, and the high-end emissions scenario projectingchange of 7 -16 F (Figure 6). These drastic warming rates for the high-end emissions scenario indicate the importanceof mitigation for reducing impactsof climate change.Changes in mean temperature arealso manifest on a daily basis bychanges in the characteristics ofextreme heat events. By midcentury, the number of extremelyhot days in Wisconsin is likely totriple (defined as the number ofdays where temperature exceeds90 F; Figure 7), and the number ofextremely hot nights is likely toquadruple (defined as the numberof nights when daily temperaturedoes not drop below 70 F). It isFigure 6. Projected changes in late-21st-century (2081-2100) annual averagetemperature for the (left) RCP4.5 “low-end” and (right) RCP8.5 “high-end”emissions scenario. WICCI Data.8
noteworthy that by the late centuryunder the high-emissions scenario,southern Wisconsin may experience80 to 90 days per year – nearly anentire summer – with hightemperatures exceeding 90 F. Theseextreme changes havedisproportionate impacts oncommunities of color, elderly,individuals with existing healthconditions, and economicallydisadvantaged communities wholack cooling capabilities.Figure 7. Annual extreme heat frequency (left) historical and (right)projected mid-21st-century (2041-2060) for the RCP4.5 low-end emissionsscenario. Depicted are the number of days per year when the temperatureexceeds 90 F. WICCI Data.Precipitation is more variable thantemperature, and as a result, futureprojections (Figure 8) have a largerrange of possible changes thantemperature. Annual mean rainfall in Wisconsin is expected to increase by mid-century, but the change variesamong models from a 5% decrease to a 15% increase. During winter, spring, and fall, precipitation is likely to increase,whereas summer precipitation has equal chances of increasing or decreasing. It is likely that extreme precipitationwill increase in Wisconsin, with the very extreme values seeing the largest change. For example, a daily 4”precipitation event typically occurs 6-10 times per 100 year (once every 10-15 year) in Southern Wisconsin. Theseevents are likely to increase in frequency to 10-15 events per 100 year (once every 6-10 years; Figure 9). Thesechanges are even more pronounced for the late-century, high-emissions scenario, which projects 18-22 daily 4”Figure 8. Projected changes in mid-21st-century (2041-2060) (left) annual, (middle) winter, and (right) summeraverage precipitation (percent) for RCP4.5 “low-end” emissions scenario. WICCI Data.9
Figure 9. Projected changes in mid-21st-century (2041-2060) (left) annual,(middle) winter, and (right) summer average precipitation (percent) forRCP4.5 “low-end” emissions scenario. WICCI Data.precipitation events every 100 years (approximately once every 5 years). These extreme precipitation events haveimmense impacts across the state, especially to agricultural communities.Concluding statementNew analyses of observed historical climate trends, as well as new climate projections for Wisconsin provideadditional confidence in expected climate change over the coming century. Observed historical trends showconsistency with greenhouse-gas forced model simulations into the 21st century, especially with respect to observedseasonal changes. Future projections under a low-end emissions scenario suggest Wisconsin will continue to warminto the middle of the 21st century, including a tripling in frequency of extreme heat days. Wisconsin is also likely tobecome wetter in the coming century, with robust increases in winter, spring, and fall. Extreme precipitation eventsare likely to increase in frequency and magnitude. These changes are much larger under a high-end emissionsscenario, pointing to the importance of reducing greenhouse gas emissions in order to limit climate change impacts toWisconsin.10
Subcommittee on Energy, Housing & InfrastructureInvestments in infrastructure are long term. Our rural roads, highways, airports, ports, dams, stormwater andwastewater systems – everything that supports our lives and livelihoods – have been and are currently beingdesigned under climate conditions different than they will encounter during most of their service life. In rebuilding,and in designing new infrastructure, updated climate projections need to drive decisions of how and where to rebuild.Currently, these infrastructure investment decisions often do not take into account expected future changes inextreme weather including precipitation and temperature. This is because specific data on current and future climatevariables are not available or are difficult to access. Although several large infrastructure projects in Wisconsin haveconsidered future climate conditions, most have not, because this is something that is often beyond the limitedresources of infrastructure managers or other decision makers in small communities. Further, many codes andstandards require the usage of climate data that are out of date, and they do not require consideration of anticipatedfuture climate conditions in facility planning. We suggest the following investments and actions to help allcommunities in Wisconsin to have the resources to proactively and efficiently evaluate alternatives and plan repairsand new facilities to consider future climate conditions.Subcommittee on Energy, Housing & InfrastructureStrategies and Solutions TableIssueStrategies and SolutionsClimate DataCreate a State Climate Office and fund staff to more efficiently collect state-wide climate datapublish quantitative data on key climate variables for current and projected future conditions andprovide guidance on ways to promote resiliency to climate change impacts in our communities.InfrastructureEncourage (and require where appropriate) that all new infrastructure planning and designprojects specifically consider vulnerability and risk associated with future climate conditions.Provide new state funding for infrastructure replacement or repair projects to proactively makeinfrastructure more resilient to future changes.Provide a standardized method to evaluate and report embodied carbon emissions from the mostcommonly used construction materials in Wisconsin and create Environmental Product Declarationsfor project development, bid evaluation, etc.Long-term Goals (4-10 years): Pursue climate bonds to accelerate green actionsMississippiRiverDevelop a two-dimensional hydraulic model that will aid in flood forecasting, management,response, and policy on a watershed basis. Use this model to evaluate current and future conditionsfor a variety of scenarios to define transportation, ecological, and planning impacts.11
Subcommittee on Energy, Housing & InfrastructureStrategies and Solutions Table (Continued)IssueStrategies and SolutionsCoastalResilienceConduct vulnerability assessments in coastal communities to identify buildings and criticalinfrastructure such as ports, harbors, and marinas that are highly vulnerable.Promote relocation, elevation, or acquisition/demolition of infrastructure and homes to removethem from hazard areas. Examples: increasing working dock heights, converting marinas to floatingdockage, and relocating water intakes to deeper water.Promote the beneficial use of material dredged from Great Lakes harbors by increasing fundingthat supports harbor dredging that sustainably uses the dredged material or creating new funding.Long-term (4-10 years) prioritiesPromote improved coastal-specific stormwater and groundwater management practices nearcoastal bluff areas through stormwater management plans and ordinances. Coastal-specificstormwater management plans could fund or incentivize practices like directing storm water andseptic discharge away from the bluff, maintaining deep rooted native vegetation, and improvinggroundwater drainage to increase the stability of bluffs.12
Making climate information available and usable for Wisconsin CommunitiesRecent extreme weather events throughout Wisconsin have shown theshortcomings of existing infrastructure and disaster relief systems. Theyhave also highlighted the need for providing communities with the bestavailable weather and climate information. Nearly all states support stateclimate offices, which provide accurate and complete climatologic andweather data to everyone — local governments, residents, businesses,and agencies. Typically, state climate offices also provide the public withcost-effective services like hourly and daily data (including temperature,wind speed, dew point, barometric pressure, frost, and snowfall), climatemonitoring, applied climate research, and long-range forecasts andinterpretations of data, including "value-added" products tailored forusers and impact applications.Environmental/Social JusticeProviding the climate data proposedwill relieve the burden of dataassembly that is disproportionatelyheavy for small, rural, ordisadvantaged communities. Climatedata can also help us identify, engage,and address risks in disadvantagedcommunities.Although the University of Wisconsin-Madison has a Wisconsin StateClimatology Office, the office is the only one in the country to operate as apurely volunteer effort. The office receives no operational funding from any source and is led by two emeritusfaculty/staff members. The lack of ongoing support hinders Wisconsin’s ability to use relevant scientific informationand promote resiliency to climate change impacts in our communities.The Wisconsin State Climatology Office should also develop, maintain, and communicate a comprehensive databasedescribing present and future climate conditions for use by Wisconsin infrastructure planners, engineers, andpolicymakers. This work will include the creation of climate data sets for present and future conditions of criticalclimate variables such as rainfall, temperature, humidity, wind, snow, freeze/thaw and other variables. The data willbe presented in a consistent and easily accessible format. Critically, this effort will also identify state and municipalcodes and standards that should reference this newly developed data, and communicate the use and value of thedata by pilot infrastructure vulnerability and adaptive design demonstration projects for potable water, wastewater,public health, transportation, and water resources projects. Similar examples of the use of future climate data inpublic health and environmental assessments should be developed.To provide appropriate staffing and reliable climate information to the state, we suggest recognizing the StateClimatologist’s role in statute and funding a state climate office.For more background on this topic, please visit the Climate Working Group on the WICCI webpage.13
Wisconsin’s infrastructure is a source of greenhouse gases and vulnerable to climate impactsClimate impacts to Wisconsin’s infrastructure include more frequent andintense precipitation, higher annual precipitation amounts, earlierEnvironmental/Social Justicethawing in the spring and more freeze/thaw cycles combined with agreater number of rainy days, higher water table elevations, the potentialCommunities with lower tax basesfor higher lake levels, and more intense heat waves. The impact of theseoften do not have additional funds tochanges will increase vulnerabilities of our roads and rail systems inrepair or replace infrastructure withWisconsin, create public and environmental safety risks due to flooding,an eye toward climate resiliency. Incause a higher likelihood of bridge and dam failure, and result in damageaddition, infrastructure failures canto and inaccessibility of commercial ports and other coastal facilities.remove the only transportation routeMore roadway damage may lead to a reduction in commerce asfor emergency services, significantlycommunities face the possibilities of more weight limit restrictions onimpacting public health and safetynon-arterial roadways for a greater fraction of the year, difficultyduring extreme storm events.completing construction projects, and impacts to the traveling public andemergency vehicles. Guidance on the methodology of infrastructure riskassessment needs to be developed and publicized to reduce inefficient orinaccurate planning and expenditure due to uncertainty in climate change projections compounded with uncertaintyin vulnerability of specific infrastructure.Mitigating climate change impacts will require major changes to our energy and transportation infrastructure toreduce greenhouse gas emissions. In addition to the design challenges, funding mechanisms will need to be adjusted.For example, our transportation system is based on fossil fuels taxation, which is unsustainable in the long term andmakes it difficult to accelerate activities that support carbon-free energy sources. We suggest that revenue sourcesand financial planning be considered very early in the process of infrastructure greenhouse gas reduction efforts.Many construction materials and construction processes have high-embedded carbon content, resulting ingreenhouse gas emissions. Using lower carbon content materials, particularly in large projects, therefore representsan opportunity for meaningful climate change mitigation. We suggest that Wisconsin join the national trend towardsinfrastructure sustainability programs that encourage the use of sustainable materials, recycling, better planning, andmore efficient construction practices that incorporate reductions in carbon emissions from construction materials.These programs can also benefit the regional economy by encouraging locally sourced materials and spur technicaland business innovations. For such a program to be effective, however, it needs to establish unambiguous andtechnically sound guidelines, while providing simplicity and minimal burden for businesses to participate. Therefore, astudy is necessary to: (1) Review existing infrastructure sustainability programs adopted elsewhere in the U.S.; (2)Evaluate current levels of embodied carbon emissions in construction materials and processes in Wisconsin in orderto identify existing or potential mitigation strategies; (3) Develop practical and fair methods for evaluating andreporting embodied carbon emissions, considering the data available to state agencies and businesses; and (4)Investigate and suggest options to consider embodied carbon emissions in infrastructure project dev
Impacts (WICCI) and University of Wisconsin-Madison Nelson Institute for Environmental Studies to collect updated, impartial scientific data on the rate of climate change in Wisconsin and its impact on Wisconsin's natural environment. The WICCI is a statewide collaboration of scientists and