Transcription
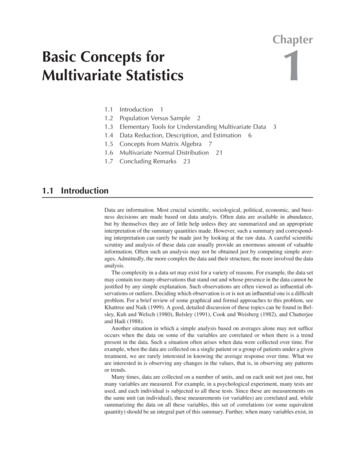
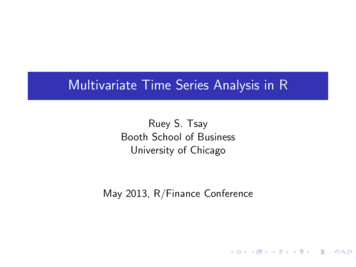
Learning Periods from Incomplete MultivariateTime SeriesAlexander GorovitsAbstract—Time series often exhibit seasonal variations whosemodeling is essential for accurate analysis, prediction andanomaly detection. For example, the increase in consumer product sales during the holiday season recurs yearly, and similarlyhousehold electricity usage has daily, weekly and yearly cycles.The period in real-world time series, however, may be obfuscatedby noise and missing values arising in data acquisition. How canone learn the natural periodicity from incomplete multivariatetime series?We propose a robust framework for multivariate perioddetection, called LAPIS. It encodes incomplete and noisy dataas a sparse representation via a Ramanujan periodic dictionary.LAPIS can accurately detect a mixture of multiple periods inthe same time series even when 70% of the observations aremissing. A key innovation of our framework is that it exploitsshared periods across individual time series even when they timeseries are not correlated or in-phase. Beyond detecting periods,LAPIS enables improvements in downstream applications suchas forecasting, missing value imputation and clustering. At thesame time our approach scales to large real-world data executingwithin seconds on datasets of length up to half a million timepoints.Index Terms—Period learning; Multivariate time series; Missing data imputation; Alternating Optimization;I. I NTRODUCTIONMultivariate time series data arise in many domains including sensor networks [47], social media [29], finance [19],databases [40] and others [14]. Key application tasks include prediction [15], control [5] and anomaly detection [47].Understanding what constitutes “normal” seasonal behavioris critical for such down-stream applications. For example,accurate auto-regression-based forecasting models often include seasonality adjustment as a preliminary step [11]. Inaddition, periodicity learning has enabled the understandingof animal migration [24], effective anomaly detection in webapplications [44] and in ECG readings [36] and periodiccommunity detection [27].Period learning in real-world time series is challenging dueto i) missing values [9], (ii) noise [23] (iii) and multiplicityof periods (e.g., a combination of daily and seasonal oscillations) [38]. Missing data and noise typically arise dueto measurement errors and outages within sensor networkssuch as urban air quality monitoring systems. Moreover theremay be multiple periods in the air quality over time due toWenyu ZhangPetko BogdanovStatistics and Data ScienceCornell UniversityIthaca, U.S.Awz258@cornell.eduComputer ScienceUniversity at Albany—SUNYAlbany, U.S.Apbogdanov@albany.edu Y1LAPISNoisy time serieswith missing n ZhangComputer ScienceComputer ScienceUniversity at Albany—SUNY University at Albany—SUNYAlbany, U.S.AAlbany, U.S.Aagorovits@albany.edulzhang22@albany.eduFFT 0.60.4FFTAUTO0.2Learn010 -2NPM AUTO NPM10 010 2Running Time (sec)10 4Fig. 1: LAPIS encodes noisy periodic time series with missingvalues, Y, via a fixed periodic dictionary D by learning ascale S and an encoding matrix U. Its accuracy in detectingcomplex ground truth periods in the data exceeds that ofalternative approaches without incurring a large computationalcost (right).diverse contributing factors: transportation, agriculture, energyproduction, and others, which are all governed by similarlydiverse periods: time of day, workweek, annual holidays, etc.The above challenges are common to many real-world systemsand obscure the inherent periodicity in data [33].The problem we address in this paper is the detectionof dominant periods from a multivariate time series withmissing observations at random instances of time. Classicalmethodologies for period detection are based on the FourierTransform (FT) [34], auto-correlation [13] and combinationsof the two [42]. The topic has been pursued in multiple research communities: signal processing [38], data mining [23],databases [17]. and bioinformatics [39]. However, to the bestof our knowledge, no prior work considers noise, missingvalues and multiplicity of periods jointly for multivariatetimeseries.We propose LAPIS, an effective framework to learn periodsfrom multivariate time series which addresses all three design challenges: noise, missing values and period multiplicity(Figure 1(left). To deal with period multiplicity, we formulateperiod learning as a sparse encoding problem via a fixedRamanujan periodic dictionary. While prior work has alsoemployed Ramanujan-based encoding [38], our frameworkintroduces a key innovation, namely, it sparsifies whole periodselection by exploiting the group structure in the Ramanujandictionary as opposed to sparsifying individual dictionaryatom selection. This modeling decision improves robustness to
noise and missing values and promotes period sharing amongindividual time series. As a result LAPIS dominates state-ofthe-art baselines in term of accuracy of ground truth perioddetection while ranking among the fastest alternatives in termsof scalability (Figure 1(right).Our main contributions in this work are as follows: Significance: To the best of our knowledge, LAPIS is thefirst model that can perform period learning on multivariatetime series in the presence of missing values, multiple periodsand noise. Robustness: Our method is robust to noise and missingvalues thanks to learning common periods across time seriesby exploiting the group structure in the Ramanujan periodicdictionary. Applicability: Extensive experiments on synthetic data andmultiple real-world datasets demonstrate the superior qualityand scalability of LAPIS.II. R ELATED WORKPeriod Learning: Traditional period learning approachesin time series rely on Fourier transform [22], autocorrelations [13] or combinations of the two [42]. Methodsin this group are sensitive to noise and often require priorinformation. These challenges were addressed in a recent periodic dictionary framework [38]. The general idea behind thisframework was first introduced in the context of periodicitytransforms [35] employed to project signals into a periodicsubspace. This original method is limited to signals lengthsthat are multiples of a given period subspace. Tenneti etal. [38] improved this idea by developing a family of flexible periodic dictionaries. Our method generalizes periodicdictionaries to (i) multivariate time series where we impose agroup structure of shared periodicity and (ii) to scenarios withmissing values. We demonstrate experimentally that LAPISis superior to basic periodic dictionary alternatives. Periodicbehavior in discrete event sequences, as opposed to generaltime series, have also been considered in the literature. Li etal. [24] introduced a clustering-based solution to estimate thedominant period in event sequences. Yuan et al. [46] proposedan alternative probabilistic model for period detection. Methods from this group are effective for event data, however, theyare not applicable to general time series data.Missing Data Imputation: Although our primary goal is notto perform missing value imputation, a part of our modelapproximates missing values to recovery the periodic patternsin data. Therefore, we give a brief introduction on relatedwork of missing value imputation. Missing data estimationin general matrices has wide applications in data miningand analytics [43]. The general idea is to model missingdata under some regularity assumption for the full data, e.g.,low-rank approximations [8], minimal description length [43],matrix profiles [4] and general matrix factorization [45]. Morerecently deep learning approaches for missing data imputationhave also gained popularity including adversarial imitationlearning [10] and structured multi-resolution via adversarialmodels [28]. These deep learning methods have a significanthigh complexity and require sufficient data to train models. Fortime series data, commonly used methods for missing valueimputation are summarized [30], such as spline interpolation.III. P RELIMINARIES AND NOTATIONWe denote with Ai , Aj ,Aij the i-th column, j-th row,and the i, j-th element of a matrix A respectively. In ourdevelopment we will quse the Frobenius norm kAkF , the L2,1PP P 2norm: kAk2,1 ii kAi k2 , and the nuclearj Aij Pnorm: kAk i σi , where σi is the ith singular value ofA. We denote element-wise multiplication and division byand respectively. I denotes the identity matrix.Our framework will employ the Ramanujan basis withinthe nested periodic matrices (NPM) framework as a periodicdictionary [38]. An N P M for period g is defined as:Φg [Pd1 , Pd2 , .PdK ] ,(1)where {d1 , d2 , .dK } are the divisors of the period g sorted inan increasing order; Pdi Rg φ(di ) is a period basis matrixfor period di , where φ (di ) denotes the Euler totient functionevaluated at di . The basis matrix here is constructed based onthe Ramanujan sum [38]:diXej2πkg/di ,Cdi (g) (2)k 1,gcd(k,di ) 1where gcd(k, di ) denotes the greatest common divisor of k anddi . The Ramanujan basis is constructed as a circulant matrixof Ramanujan sums as follows: Cdi (0)Cdi (g 1) . Cdi (1) Cdi (1)Cdi (0). Cdi (2) Pdi (3) . Cdi (g 1) Cdi (g 2) . Cdi (0)The complete dictionary R for periods up to gmax is constructed by stacking basis matrices with periods from 2 togmax as R [Φ1 , ., Φgmax ]. Note that columns in R shouldbe periodically extended to the same length as the time pointsof input time series. For example, the atoms for periods{2, 3, 4} are defined as follows: P2 1 1 2, P3 1 1 2 1 02 , P4 2 10 02 0 2,(4)and are periodically extended for signals of length T 5 asfollows: R 1 11 112 1 12 1 12 1 1220 202020 20 (5)A recent model for period estimation in univariate andcomplete (no missing data) signals proposed by Tenneti andcolleagues [38] aims to obtain a succinct representation of theinput signal through the NPM basis as follows:argmin kHbk1 , s.t. x Rb,b(6)
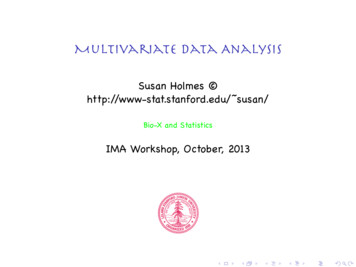
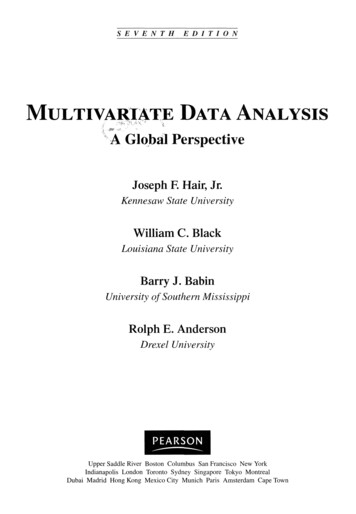
where x is the input signal, b is the learned representationin NPM basis and H is a diagonal matrix encouraging representation through short periods defined as Hii p2 , where pis the period of the i-th column in R. One important choicein this framework is the maximal candidate period gmax as itdetermines the dimensionality of R. While we are not awareof an automated approach to set gmax , small values relativeto T work well in practice since the framework explicitlyencourages fit through short simple periods, e.g., a period of20 could be represented as a mixture of its factors 2, 5.IV. P ROBLEM FORMULATIONThe input in our problem settings is a partially observedmultivariate time series matrix Y RT N with N time seriesof length T in its columns. We define an indicator (or a mask)matrix W of the same size as Y with entries Wij 1 if Yijis observed, and 0 otherwise. Our goal is to learn the inherentperiodicity of time series in Y in a manner that is aware ofthe missing data. We formalize this objective by employingthe Ramanujan periodic dictionary framework as follows:12argmin kY DSUkF J1 (U) J2 (Y),S,U 2(7)where D RH 1 RT L is a “biased” periodic dictionarywhich promotes the selection of short-period atoms via a2diagonal penalty matrix H 1 with elements H 1ii 1/p ,where p is the length of the period containing the i-th atom(column) in the Ramanujan basis dictionary R. The numberof atoms L is determined by the number of columns inthe Ramanujan dictionary. U is the period mixture matrixspecifying the reconstruction of the time series as a linearcombination of dictionary basis atoms.Since individual time series might have different magnitude,we introduce a diagonal matrix S RL L to “absorb”the scale of the periodic reconstruction, thus, ensuring thatloadings in U are of similar magnitude across time series.Note that this allows us to impose sparsity on U (discussedbelow) without bias to high-magnitude time series. We alsoincorporate two regularization terms: one promoting sparsityand grouping by period for the mixing matrix J1 (U) and asecond one handling missing values in the input J2 (Y).Sparsity and grouping by period in J1 (U): Since timeseries typically have only a few inherent periods, we promotea sparse representation in the dictionary loadings through anL1 norm kUk1 similar to other methods based on NPMs. Thisregularization allows for robustness to noise.In addition to a sparse representation, we also expect ourinput time series Y to arise from the same system, and thus,share periods. Such shared periodicity is typical in both naturaland engineered systems. For example, brain waves (or neuraloscillations) govern the neural activity of all brain regions;daily oscillations of weather parameters such as pressure andtemperature are across locations, and energy consumptionwithin the same region of the energy grid observes periodicpatterns with the same periods: days and seasons. Note that,we do not expect correlated behavior across the time series,𝐔 𝐔- 𝐔#𝐔 𝐔,𝐔 𝐔- 𝐔#𝐔 𝐔,𝐏#𝐏 𝐏# 1 1𝐏 1 1𝐏𝟓1 1 1 1𝐔 𝐔- 𝐔#𝐔 𝐔,𝐏# 𝐏 𝐏#𝐏 𝐏𝟓𝐀 𝐔' 𝐔)A𝐏𝟓𝐏𝟓𝐔' 𝐔)𝐔Fig. 2: A sketch of the expected “shape” of a periodic coefficient matrix U for the reconstruction of time series sharing aperiod (left). To impose a banded structure for period-specificatoms we employ a rank norm on an aggregation matrixkA (U U )k , where loadings of atoms corresponding tothe same period are aggregated by absolute value (right).but simply shared periods. Thus, we seek to enforce groupingof time series based on sharing a few periods in their periodicrepresentation.The structure of the mixture matrix U aligned with theshared period assumption discussed above is presented inFig. 2 (left). Intuitively we expect that mixture vectors Uicorresponding to individual time series have non-zero elementsin bands corresponding to their periods, i.e. correspondingperiod-specific sub-matrices Pi . To promote such groupingbanded structure we can employ a rank norm penalty. However, imposing a low-rank constraint directly on U willdisregard the the period-specific band structure and treat selection of individual atoms from the dictionary independently.Instead, we need to impose a low-rank constraint at the period(band) level, by a product with a period aggregation matrixA RP L depicted in Fig. 2(right), which encodes theindices of atoms associated with a period in each of its rows.If we directly aggregate mixture coefficients in U within aperiod, they may cancel out as in general elements of U cantake both positive and negative values. Thus, we “separate”positive and negative values in U by defining two componentmatrices U U U , where U ( U U) /2 andU ( U U) /2. We then form the aggregate productA (U U ) Fig. 2(right) and impose a low rank penalty onit. The overall sparsity and period grouping regularizer J1 (U)is defined as follows: J1 (U) kUk1 A U U .(8)Note that we employ the nuclear norm for the grouping termas it is the convex relaxation of the rank norm.Missing data imputation: Recall that Y is partially observeddue to missing values which prevent us from minimizingdirectly the reconstruction of Y as outlined in Eq. 7. Tohandle this, we define a proxy full data matrix X with allvalues imputed which we represent by the periodic dictionaryand also maintain close to the input Y for observed values.Formally, we define the missing value regularizer J2 (X) as:J2 (X) kW(X Y)k1 ,(9)
where W is a mask matrix with elements of 1 in positionsin which values in Y are observed and 0 otherwise; anddenotes the element-wise product.Our overall objective for the problem of Period learningwith missing values is as follows:12kX DSUkF λ1 kUk1X,S 0,U 2 λ2 A U U λ3 kW (X Y)k1 ,argmin(10)where λ1 , λ2 and λ3 are balance parameters. Note that wehave replaced Y in Eq. 7 with X, i.e. we have integratedthe missing data imputation model within the period learningobjective.V. O PTIMIZATIONNext we derive the optimization algorithm for our problemformulation in Eq. 10. Since variables {X, U, S} are notjointly convex in this objective, it can’t be solved by gradientbased methods. Instead, we develop an efficient solver basedon alternating optimization. More specifically, we decomposeEq. 10 into three variable-specific subproblems and updatethem alternatively as follows: argmin U argminX argminS 012kX DSUk2F λ1 kUk1 λ2 A U U 12kX DSUk2F λ3 kW12kX DSUk2F (X Y)k1A. Optimization of U.We solve the subproblem for U by the Alternating DirectionMethod of Multipliers (ADMM) [6]. We first introduce proxyvariables {P1 , P2 } and rewrite the problem as follows:12kX DSUkF λ1 kP1 k1 λ2 kP2 k U,P1 ,P2 2 s.t P1 U, P2 A U U argmin(14)Problems of this from have a closed form solution due to [26]specified in the following Lemma:2Lemma 1: The objective argminS 21 kS BkF α kSk1 ,where α is a positive scalar has a closed-form solution: Sij sign (Bij ) max ( Bij α, 0), where sign (t) is the signumfunction.1Thus, by letting F1 U Θρ1 , we have the following elementwise update rule for P1 :[P1 ]ij sign([F1 ]ij ) max( [F1 ]ij λ1 /ρ1 , 0)Update for P2 : The P2 subproblem is as follows: argmin λ2 kP2 k ρ2 /2 P2 A U U Θ2 /ρ2P22FThis problem can also be readily solved by employing thesingular value thresholding (SVT) method [7]. Let F2 T2A (U U ) Θbe the singuρ2 and let F2 LΣRlar value decomposition (SVD) of F2 . Then following theSVT approach, we update P2 as P2 LD (Σ) RT , whereD (Σ)h is a thresholding i on Σ that is defined as D (Σ) λ2diag max σi ρ2 , 0 , where σi denotes the ith singularvalue of F2 .Updates for the Lagrange multipliers Θ1 , Θ2 : We updatethe Lagrange multipliers as follows:( t 1ttΘ1 Θt1 ρ1 [Ph 1 U ]i(15)tt tΘt 1 Θ ρP A(U U)2222Since X is involved in an element-wise product term, itselements cannot be optimized simultaneously. To address this,we adopt ADMM approach similar to that for U. We firstintroduce a proxy variable E as follows:R (U, P1 , P2 , Θ1 , Θ2 ) (11)argminX,E1X D̂U22F λ3 kWEk1 , s.t. E X YNext we form the corresponding Lagrangian form:where Θ1 and Θ2 are Lagrange multipliers; ρ1 and ρ2 arepenalty parameters. We perform the optimization of eachvariable in R alternatively and derive the update rules in theremainder of this subsection.Update of U: The subproblem w.r.t. U is:2ρ1Θ112(12)P1 U argmin kX DSUkF 22ρ1 FUWe set its gradient w.r.t. U to zero and obtain: D̂T D̂U X ρ1 (U P1 Θ1 /ρ1 ) 0,Update for P1 : The P1 subproblem is as follows:ρ12kP1 U Θ1 /ρ1 kFargmin λ1 kP1 k1 2P1B. Optimization of X.We construct the corresponding Lagrangian function:12kX DSUkF2ρ12 λ1 kP1 k1 hΘ1 , P1 Ui kP1 UkF2 λ2 kP2 k Θ2 , P2 A U U 2ρ2 P2 A U U F ,2where D̂ DS, with a closed-form solution for U: 1 hiU D̂T D̂ ρ1 ID̂T X ρ1 (P1 Θ1 /ρ1 ) .(13)21X D̂U λ3 kW Ek12Fµ2 hM, E (X Y)i kE (X Y)kF ,2where M is a Lagrange multiplier and µ is a penalty coefficient. We perform the optimization of each variable inL (X, E, M) alternatively as follows: k 1 argmin L X, Ek , Mk , µk(a) XX Ek 1 argmin L Xk 1 , E, Mk , µk(b) E k 1 k 1kkk 1M M µ E X Y(c)L (X, E, M, µ)
Algorithm 1 Optimization of LAPISThe explicit minimization for Xk 1 is follows:Xk 1 argminX1X D̂U2Require: The incomplete data Y and parameters (λ1 λ3 ).Ensure: The estimated data X and period coefficients U1: Initialize: X Y, S I, Θ1 0, Θ2 0 and M 02: while X, U and S have not converged do3:while U has not converged doh i2 FµkEk (X Y) Mk /µk2We set the gradient w.r.t X to zero: X D̂U µk (X H) 0,2 1F4:5:6:7:Mk,µkkwhere H E Y and obtain: Xk 1 D̂U µk H / 1 µk(16)The minimization for Ek 1 is:Ek 1 argmin λ3 kWEEk1 µkE Xk 1 Y Mk /µk 28:9:10:11:12:13:14:15:16:17:18:19:2FkHere we again employ Lemma 1 and let T Xk 1 Y M,µkresulting in: Ek 1 sign (Tij ) max Tij λ3 · Wij /µk , 0ijC. Optimization of S.We introduce a Lagrangian multiplier Γ to ensure nonnegativity of S’ entries and obtain the following Lagrangianfunction: 2(17)G(S, Γ) 1/2 kX DSUkF tr ΓSTTaking the gradient of G w.r.t S, we get: G/ S DT DSUUT DT XUT Γ.ΓS 0By combining Eq. 18 and Eq. 19, we obtain: DT DSUUT DT XUTS 0.21:22:Finally, we obtain an element-wise update for S following theapproach in [18]:s[H SG H SG L ]ij(22)Sij Sij[H SG H SG L ]ijD. Overall algorithm and complexity.(18)Based on the KKT conditions, we also have the system: G/ S 0;20:1U D̂T D̂ ρ1 ID̂T X ρ1 P1 Θρ1 U ( U U) /2U ( U U) /2 1,0[P1 ]ij sign [F1 ]ij max [F1 ]ij λρ1 2F2 A U U Θρ2(L, Σ, R) svd(F2 )P2 LD (Σ) RT Θt1 ρ1 hP1t UtΘt 11 t it 1ttΘ2 Θ2 ρ2 P2 A U U end whilewhile X and E have not converged do k kXk 1 D̂U µ2 H / 1 µ2 λ ·WEk 1 sign (Tij ) max Tij 3 µk ij , 0ij Mk 1 Mk µk Ek 1 Xk 1 Yk 1kµ ρµend while s[H SG H SG L ]ijSij Sij[H SG H SG L ]ijend whilereturn {U, X}(19)(20)We define the following simplifying variables: L DT XUT ,G DT D and H UUT . Since D, U and X are all mixsigned, we split each of the new variables into positive andnegative summands: H H H (21)G G G L L L ,similar to the definitions of U and U . Then, we rewriteC HSG L in terms of the two-part definitions for thenew variables as follows: C H H S G G L L H SG H SG L H SG H SG L We list the steps of our method LAPIS in Algorithm 1.We repeat the sequential updates for U, X and S, Steps 318 until convergence. The major running time cost comesfrom Steps 4 and 9 while the remaining steps have a linearcomplexity or involve sparse matrix multiplication. Step 4involves an inversion of a quadratic matrix, which is ingeneral O(L3 ). However, due to the sparsity in D̂, thiscomplexity can be reduced to O(LSnz ) following the analysisin [48], where Snz is the number of non-zero elements ofD̂T D̂ ρ1 I. In Step 9, the SVD operation has complexity ofO min LN 2 , L2 N . The overall complexityis dominated by O tS tU LSnz tS tU min LN 2 , L2 N , where tS and tUare the number of iterations of the loops starting in Steps 2and 3 respectively. In practice, when employed for time seriesof half a million time points, LAPIS takes a few seconds on astandard desktop machine. The implementation of LAPIS willbe made available with this camera-ready paper.VI. E XPERIMENTAL E VALUATIONA. DatasetsSynthetic data: We generate 10 periodic 800-step-long timeseries following the protocol in [38]. The time series form3 groups sharing the same within-group ground truth (GT)
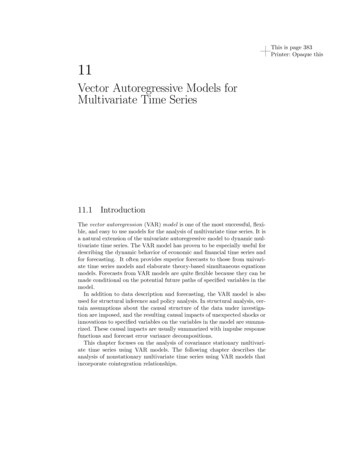
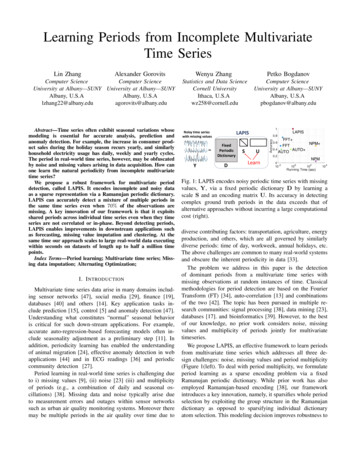
StatisticsLAPISNPMFFTAUTODatasetLength N variate GT period Periods Time Periods Time Periods Time Periods TimeWeb traffic [2]55087 days70.3s264.1s70.1s70.03sBike rentals [16]731167 days70.5s224.8s260.1s430.02Beer consumption [3]36547 days70.8s150.6s70.6s70.04sHistorical weather [1] 45k3612, 24 hours 12, 24 8.3s 2, 3 12600s 24, 45 4s 24, 45 0.6sAir Quality [12]52k1012, 24 hours 12, 24 25.4s 3,5 32817s 24,49 0.3s 24,49 0.2s0.80.60.4LAPISNPMFFTAUTO0.20050SNR(a) Accuracy with SNRLAPISNPMFFTAUTONPM FFT AUTO 0.60.40.210001207000.20.40.60.8Missing ratio(b) Accuracy with missing%LAPISNPMFFTAUTOGT6050403020050100SNR(c) number of periods with SNR# obtained periods10.8# obtained periods1AccuracyAccuracyTABLE I: Real-world dataset statistics and comparison of period detection and running times of competiting techniques.LAPISNPMFFTAUTONPM FFT 100806040200.10.20.30.40.5Missing ratio(d) number of periods with missing%Fig. 3: Period learning comparison of competing techniques on synthetic data (20 ground truth periods)(a) Web traffic(b) Bike rental(c) Beer consumption(d) Historical weatherFig. 4: Period learning on real-world datasetsperiods, where each group has 2 periods. We add Gaussiannoise of varying strength in all time series by using thesame implementation as in [38]. We then remove observationsindependently in each series and at random steps.Real-world data: We evaluate our model on datasets fromseveral domains summarized in Tbl. I. Note that all datasetsare multivariate time series, we use N variate to denotethe number of components in the Table 1. The Web trafficdataset [2] tracks the daily views of Wikipedia articles aggregated per language between 06/2015 and 12/2016. We expectthat seven days (one week) is a natural ground truth periodin this dataset. Our Bike rental dataset [16] is a two-yeardaily log of the number of bike rentals at different stationsin Washington D.C. Since rental bikes are used for dailycommutes in urban areas, we expect that the GT period inthis data will also be driven by the work week. The Beerconsumption dataset [3] tracks the daily beer consumption inthe Czech Republic. We expect that consumption will varywith people’s weekly routines and also expect a weekly periodin this data. The Historical Weather dataset [1] consists of 5years of hourly weather measurements. We use the pressuretime series at 36 US cities. Since the pressure is directlyaffected by the solar position we expect half-day or daily GTperiods in this dataset. Finally, the Air Quality dataset [25]contains the PM2.5 measurements for five cities in Chinabetween 1/2010 and 12/2015. PM2.5 levels measure small(less than 2.5nm) airborne particles, predominantly generatedby burning of fossil fuel. Therefore, the PM2.5 index is relatedto automobile emissions, industrial activity, and constructionwork. These activities are likely to follow human behavioralpatterns, which will often lead to periods of half (12 hours)or full days (24 hours) [21]. In this experiment, we report theresults based on data from Jingan, Shangai, China.A note on expected periods: While ground truth periodsare not usually available for many of the above datasets, sincethese datasets represent human activity we expect intuitively”natural” periods - a (half) day, a week, a month, a year.Otherwise, the detected periods are more difficult to interpretas driven by phenomena from the respective domains.B. Experimental setupBaselines: The key goal of our model is period learning butit can also be employed to perform seasonality adjustmentand impute missing data or project future behavior. For periodlearning, we compare our method to three baselines: NPM [38]which is the state-of-art period learning method, FFT [22],and AUTO [24] which combines auto-correlation and Fouriertransform. In particular, these three baselines are not designed
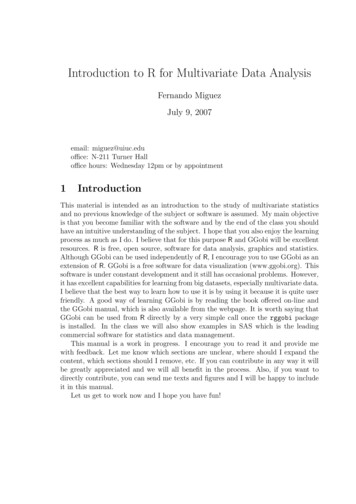
10 26210 lineNMFMCSSESSE410 010 1LAPISSplineNMFMC1010 000.10.20.30.4Missing ratio(a) Synthetic data0.50010203040SNR(b) Synthetic data5010 -10.10.20.30.4Missing ratio(c) Beer consumption0.10.20.30.40.5Missing ratio(d) Air qualityFig. 5: Evaluation of missing value imputation.for multivariate time series directly, therefore we apply themon each univariate time series and combine the results. Wealso compare LAPIS to two period-agnostic baselines formissing data imputation: Spline interpolation [30] and matrixcompletion NMFMC [45]. We do not compare to deep learningmethods because they have significantly higher complexity andrequire large amount of data for training.To test if the period learning baselines are mainly affectedby missing data, we also attempt to impute missing valuesand then learn periods, resulting in no-missing value variants:NPM , FFT and AUTO , where we combine period-agnosticmissing data imputation with period learning baselines. Here,we employ NMFMC to impute values before employing NPM,FFT and AUTO because it outperforms the Spline methodin all datasets. We also quantify the utility of seasonalityadjustment by LAPIS for improving auto-regressive predictionmodels.Metrics: In the period learning task we use the accuracy ofdetecting ground truth (GT) periods for evaluation. Among alldetected periods by competing methods, we employ the top-kperiods for computing the accuracy, where k is the numberof GT periods. For missing values imputation and forecasting,we adopt Sum of Squared Errors (SSE) for evaluation.further enforces a block structures in the periodic dictionarywhich NPM neglects.LAPIS retains perfect detection of GT periods for increasingfraction of missing values (up to 70%) due to its explicitmodeling of missing values in data (Fig. 3b). In comparison,alternatives (FFT and AUTO) degrade steadily even whenmissing value imputation is performed as a prepossessing(FFT and AUTO ). This suggests that period-agnostic missing value imputation does not help significantly traditionalperiod learning approaches. NPM fails to detect periods inthe presence of missing values, i.e., when missing values arefilled with a constant (NPM) or by NMFMC (NPM ), asthe inconsistency of the imputed values “break” the periodicpatterns in the data.Period learning results in real-world data are reported inFig. 4 as violin plots of the distribution of predicted periods,where the GT periods are shown as horizontal dashed bluelines. LAPIS’s prediction are typically concentrated aroundthe expected GT periods while baselines are less accurate andmore scattered. LAPIS enforces period sharing across timeseries, while others assume independence between time seriesand tend to overfit observations, yielding a wide range ofpredictions. We further summarize the period learning resultsand running times in real-world data in Tbl. I.C. Period learning analysis.D. Missing value imputation.While LAPIS extract the periodic component from observedtime series and is not directly a missing value predictor.However we employ the estimated periodic-based values formissing value imputation. The performance of missing valueimputation in synthetic data for varying SNR and varying ratioof missing data is shown in Fig. 5a and Fig. 5b res
Computer Science University at Albany—SUNY Albany, U.S.A pbogdanov@albany.edu . as a sparse representation via a Ramanujan periodic dictionary. LAPIS can accurately detect a mixture of multiple periods in the same time series even when 70% of the observations are missi