Transcription
Multivariate StatisticsOld SchoolMathematical and methodological introduction to multivariate statisticalanalytics, including linear models, principal components, covariancestructures, classification, and clustering, providing background for machinelearning and big data study, with RJohn I. MardenDepartment of StatisticsUniversity of Illinois at Urbana-Champaign
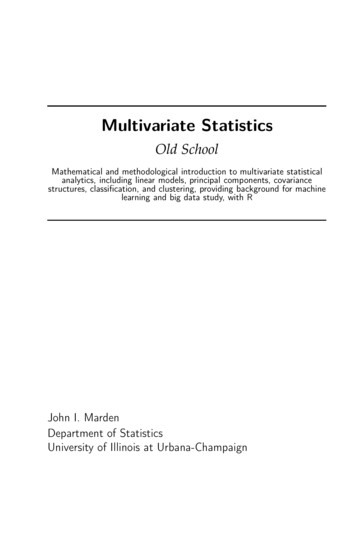
2015 by John I. MardenEmail: multivariate@stat.istics.netURL: http://stat.istics.net/MultivariateTypeset using the memoir package [Madsen and Wilson, 2015] with LATEX [LaTeXProject Team, 2015]. The faces in the cover image were created using the faces routinein the R package aplpack [Wolf, 2014].
PrefaceThis text was developed over many years while teaching the graduate course in multivariate analysis in the Department of Statistics, University of Illinois at UrbanaChampaign. Its goal is to teach the basic mathematical grounding that Ph. D. students need for future research, as well as cover the important multivariate techniquesuseful to statisticians in general.There is heavy emphasis on multivariate normal modeling and inference, both theory and implementation. Several chapters are devoted to developing linear models,including multivariate regression and analysis of variance, and especially the “bothsides models” (i.e., generalized multivariate analysis of variance models), which allow modeling relationships among variables as well as individuals. Growth curveand repeated measure models are special cases.Inference on covariance matrices covers testing equality of several covariance matrices, testing independence and conditional independence of (blocks of) variables,factor analysis, and some symmetry models. Principal components is a useful graphical/exploratory technique, but also lends itself to some modeling.Classification and clustering are related areas. Both attempt to categorize individuals. Classification tries to classify individuals based upon a previous sample ofobserved individuals and their categories. In clustering, there is no observed categorization, nor often even knowledge of how many categories there are. These must beestimated from the data.Other useful multivariate techniques include biplots, multidimensional scaling,and canonical correlations.The bulk of the results here are mathematically justified, but I have tried to arrangethe material so that the reader can learn the basic concepts and techniques whileplunging as much or as little as desired into the details of the proofs. Topic- andlevel-wise, this book is somewhere in the convex hull of the classic book by Anderson[2003] and the texts by Mardia, Kent, and Bibby [1979] and Johnson and Wichern[2007], probably closest in spirit to Mardia, Kent and Bibby.The material assumes the reader has had mathematics up through calculus andlinear algebra, and statistics up through mathematical statistics, e.g., Hogg, McKean,and Craig [2012], and linear regression and analysis of variance, e.g., Weisberg [2013].In a typical semester, I would cover Chapter 1 (introduction, some graphics, andprincipal components); go through Chapter 2 fairly quickly, as it is a review of mathematical statistics the students should know, but being sure to emphasize Section 2.3.1on means and covariance matrices for vectors and matrices, and Section 2.5 on condiiii
Prefaceivtional probabilities; go carefully through Chapter 3 on the multivariate normal, andChapter 4 on setting up linear models, including the both-sides model; cover mostof Chapter 5 on projections and least squares, though usually skipping 5.7.1 on theproofs of the QR and Cholesky decompositions; cover Chapters 6 and 7 on estimationand testing in the both-sides model; skip most of Chapter 8, which has many technicalproofs, whose results are often referred to later; cover most of Chapter 9, but usually skip the exact likelihood ratio test in a special case (Section 9.4.1), and Sections9.5.2 and 9.5.3 with details about the Akaike information criterion; cover Chapters10 (covariance models), 11 (classifications), and 12 (clustering) fairly thoroughly; andmake selections from Chapter 13, which presents more on principal components, andintroduces singular value decompositions, multidimensional scaling, and canonicalcorrelations.A path through the book that emphasizes methodology over mathematical theorywould concentrate on Chapters 1 (skip Section 1.8), 4, 6, 7 (skip Sections 7.2.5 and7.5.2), 9 (skip Sections 9.3.4, 9.5.1. 9.5.2, and 9.5.3), 10 (skip Section 10.4), 11, 12(skip Section 12.4), and 13 (skip Sections 13.1.5 and 13.1.6). The more data-orientedexercises come at the end of each chapter’s set of exercises.One feature of the text is a fairly rigorous presentation of the basics of linear algebra that are useful in statistics. Sections 1.4, 1.5, 1.6, and 1.8 and Exercises 1.9.1through 1.9.13 cover idempotent matrices, orthogonal matrices, and the spectral decomposition theorem for symmetric matrices, including eigenvectors and eigenvalues. Sections 3.1 and 3.3 and Exercises 3.7.6, 3.7.12, 3.7.16 through 3.7.20, and 3.7.24cover positive and nonnegative definiteness, Kronecker products, and the MoorePenrose inverse for symmetric matrices. Chapter 5 covers linear subspaces, linearindependence, spans, bases, projections, least squares, Gram-Schmidt orthogonalization, orthogonal polynomials, and the QR and Cholesky decompositions. Section13.1.3 and Exercise 13.4.3 look further at eigenvalues and eigenspaces, and Section13.3 and Exercise 13.4.12 develop the singular value decomposition.Practically all the calculations and graphics in the examples are implementedusing the statistical computing environment R [R Development Core Team, 2015].Throughout the text we have scattered some of the actual R code we used. Many ofthe data sets and original R functions can be found in the R package msos [Mardenand Balamuta, 2014], thanks to the much appreciated efforts of James Balamuta. Forother material we refer to available R packages.I thank Michael Perlman for introducing me to multivariate analysis, and hisfriendship and mentorship throughout my career. Most of the ideas and approachesin this book got their start in the multivariate course I took from him forty years ago.I think they have aged well. Also, thanks to Steen Andersson, from whom I learneda lot, including the idea that one should define a model before trying to analyze it.This book is dedicated to Ann.
ContentsPrefaceiiiContents12vA First Look at Multivariate Data1.1 The data matrix . . . . . . . . . . . . . . . .1.1.1 Example: Planets data . . . . . . . .1.2 Glyphs . . . . . . . . . . . . . . . . . . . . .1.3 Scatter plots . . . . . . . . . . . . . . . . . .1.3.1 Example: Fisher-Anderson iris data1.4 Sample means, variances, and covariances1.5 Marginals and linear combinations . . . . .1.5.1 Rotations . . . . . . . . . . . . . . .1.6 Principal components . . . . . . . . . . . .1.6.1 Biplots . . . . . . . . . . . . . . . . .1.6.2 Example: Sports data . . . . . . . .1.7 Other projections to pursue . . . . . . . . .1.7.1 Example: Iris data . . . . . . . . . .1.8 Proofs . . . . . . . . . . . . . . . . . . . . . .1.9 Exercises . . . . . . . . . . . . . . . . . . . .112235681010131315171820Multivariate Distributions2.1 Probability distributions . . . . . . . . . . . . . . .2.1.1 Distribution functions . . . . . . . . . . . .2.1.2 Densities . . . . . . . . . . . . . . . . . . .2.1.3 Representations . . . . . . . . . . . . . . .2.1.4 Conditional distributions . . . . . . . . . .2.2 Expected values . . . . . . . . . . . . . . . . . . . .2.3 Means, variances, and covariances . . . . . . . . .2.3.1 Vectors and matrices . . . . . . . . . . . . .2.3.2 Moment generating functions . . . . . . .2.4 Independence . . . . . . . . . . . . . . . . . . . . .2.5 Additional properties of conditional distributions2.6 Affine transformations . . . . . . . . . . . . . . . .27272728293032333435353740v.
Contentsvi2.734567Exercises . . . . . . . . . . . . . . . . . . . . . . . . . . . . . . . . . . . . . 41The Multivariate Normal Distribution3.1 Definition . . . . . . . . . . . . . . . . . . . . . . . .3.2 Some properties of the multivariate normal . . . . .3.3 Multivariate normal data matrix . . . . . . . . . . .3.4 Conditioning in the multivariate normal . . . . . .3.5 The sample covariance matrix: Wishart distribution3.6 Some properties of the Wishart . . . . . . . . . . . .3.7 Exercises . . . . . . . . . . . . . . . . . . . . . . . . .4949515255575960Linear Models on Both Sides4.1 Linear regression . . . . . . . . . . . . . . . . . .4.2 Multivariate regression and analysis of variance4.2.1 Examples of multivariate regression . . .4.3 Linear models on both sides . . . . . . . . . . .4.3.1 One individual . . . . . . . . . . . . . . .4.3.2 IID observations . . . . . . . . . . . . . .4.3.3 The both-sides model . . . . . . . . . . .4.4 Exercises . . . . . . . . . . . . . . . . . . . . . . .696972727777788182Linear Models: Least Squares and Projections5.1 Linear subspaces . . . . . . . . . . . . . . . . .5.2 Projections . . . . . . . . . . . . . . . . . . . . .5.3 Least squares . . . . . . . . . . . . . . . . . . .5.4 Best linear unbiased estimators . . . . . . . . .5.5 Least squares in the both-sides model . . . . .5.6 What is a linear model? . . . . . . . . . . . . .5.7 Gram-Schmidt orthogonalization . . . . . . . .5.7.1 The QR and Cholesky decompositions5.7.2 Orthogonal polynomials . . . . . . . .5.8 Exercises . . . . . . . . . . . . . . . . . . . . . .87878990919394959799101Both-Sides Models: Estimationb . . . . . . . . . . . . .6.1 Distribution of β6.2 Estimating the covariance . . . . . . . .6.2.1 Multivariate regression . . . . .6.2.2 Both-sides model . . . . . . . . .6.3 Standard errors and t-statistics . . . . .6.4 Examples . . . . . . . . . . . . . . . . . .6.4.1 Mouth sizes . . . . . . . . . . . .6.4.2 Using linear regression routines6.4.3 Leprosy data . . . . . . . . . . .6.4.4 Covariates: Leprosy data . . . .6.4.5 Histamine in dogs . . . . . . . .6.5 Submodels of the both-sides model . .6.6 Exercises . . . . . . . . . . . . . . . . . ides Models: Hypothesis Tests on β1257.1 Approximate χ2 test . . . . . . . . . . . . . . . . . . . . . . . . . . . . . . 125
7139141Some Technical Results8.1 The Cauchy-Schwarz inequality . . . . . . . . . . .8.2 Conditioning in a Wishart . . . . . . . . . . . . . . .8.3 Expected value of the inverse Wishart . . . . . . . .8.4 Distribution of Hotelling’s T 2 . . . . . . . . . . . . .8.4.1 A motivation for Hotelling’s T 2 . . . . . . .8.5 Density of the multivariate normal . . . . . . . . . .8.6 The QR decomposition for the multivariate normal8.7 Density of the Wishart . . . . . . . . . . . . . . . . .8.8 Exercises . . . . . . . . . . . . . . . . . . . . . . . . .145145146147148149150151153154Likelihood Methods9.1 Likelihood . . . . . . . . . . . . . . . . . .9.2 Maximum likelihood estimation . . . . .9.3 The MLE in the both-sides model . . . .9.3.1 Maximizing the likelihood . . . .9.3.2 Examples . . . . . . . . . . . . . .9.3.3 Calculating the estimates . . . . .9.3.4 Proof of the MLE for the Wishart9.4 Likelihood ratio tests . . . . . . . . . . . .9.4.1 The LRT in the both-sides model9.5 Model selection: AIC and BIC . . . . . .9.5.1 BIC: Motivation . . . . . . . . . .9.5.2 AIC: Motivation . . . . . . . . . .9.5.3 AIC: Multivariate regression . . .9.5.4 Example: Skulls . . . . . . . . . .9.5.5 Example: Histamine . . . . . . . .9.6 Exercises . . . . . . . . . . . . . . . . . . 8110 Models on Covariance Matrices10.1 Testing equality of covariance matrices . . . . . . . . . . .10.1.1 Example: Grades data . . . . . . . . . . . . . . . . .10.1.2 Testing the equality of several covariance matrices10.2 Testing independence of two blocks of variables . . . . . .1871881891901907.27.37.47.57.6897.1.1 Example: Mouth sizes . . . . . . .Testing blocks of β are zero . . . . . . . .7.2.1 Just one column: F test . . . . . .7.2.2 Just one row: Hotelling’s T 2 . . .7.2.3 General blocks . . . . . . . . . . .7.2.4 Additional test statistics . . . . . .7.2.5 The between and within matricesExamples . . . . . . . . . . . . . . . . . . .7.3.1 Mouth sizes . . . . . . . . . . . . .7.3.2 Histamine in dogs . . . . . . . . .Testing linear restrictions . . . .
the data sets and original R functions can be found in the R package msos [Marden and Balamuta, 2014], thanks to the much appreciated efforts of James Balamuta. For other material we refer to available R packages. I thank Michael Perlman for introducing me to multivariate analysis, and his friendship and mentorship throughout my career. Most of .
