Transcription
Journal of Machine Learning Research 17 (2016) 1-5Submitted 6/15; Published 4/16OLPS: A Toolbox for On-Line Portfolio SelectionBin LiBINLI . WHU @ WHU . EDU . CNEconomics and Management School, Wuhan University, Wuhan, P.R. China 430072Doyen SahooDOYEN .2014@ PHDIS . SMU . EDU . SGSteven C. H. HoiCHHOI @ SMU . EDU . SGSchool of Information Systems, Singapore Management University, Singapore 178902Editor: Geoff HolmesAbstractOn-line portfolio selection is a practical financial engineering problem, which aims to sequentiallyallocate capital among a set of assets in order to maximize long-term return. In recent years, avariety of machine learning algorithms have been proposed to address this challenging problem,but no comprehensive open-source toolbox has been released for various reasons. This articlepresents the first open-source toolbox for “On-Line Portfolio Selection” (OLPS), which implementsa collection of classical and state-of-the-art strategies powered by machine learning algorithms. Wehope that OLPS can facilitate the development of new learning methods and enable the performancebenchmarking and comparisons of different strategies. OLPS is an open-source project releasedunder Apache License (version 2.0), which is available at https://github.com/OLPS/ orhttp://OLPS.stevenhoi.org/.Keywords: On-line portfolio selection, online learning, trading system, simulation.1. IntroductionIn recent years, machine learning has been applied to various applications in finance (Györfi et al.,2012), including On-line Portfolio Selection, which aims to sequentially allocate capital among aset of assets, such that the investment return can be maximized in the long run (Kelly, 1956). Ithas attracted increasing attention from both academia and industry, and several machine learningalgorithms have been proposed (Li and Hoi, 2014), including traditional algorithms (Cover, 1991;Helmbold et al., 1998; Agarwal et al., 2006; Borodin et al., 2004; Györfi et al., 2006, 2008), andrecent state-of-the-art online learning algorithms (Li et al., 2011, 2012, 2013, 2015). Unlike otherapplication domains in machine learning where various open-source packages are available, veryfew open-source toolkits1 exist for on-line portfolio selection, primarily due to the confidentialnature of financial industry. Consequently, it is difficult for researchers to evaluate new algorithmsfor comprehensive comparisons with existing ones.This article introduces an open-source toolkit named “On-Line Portfolio Selection” (OLPS),which consists of a family of classical and state-of-the-art on-line portfolio selection algorithms. Tothe best of our knowledge, OLPS is the first comprehensive open-source package for this problem,which includes various strategies, and a set of preprocessing, postprocessing and visualization tools1. Some repositories contain public datasets, such as http://www.cs.technion.ac.il/ rani/portfolios and http://www.szit.bme.hu/ oti/portfolio, but no public code was released.c 2016 Bin Li, Doyen Sahoo and Steven C.H. Hoi.
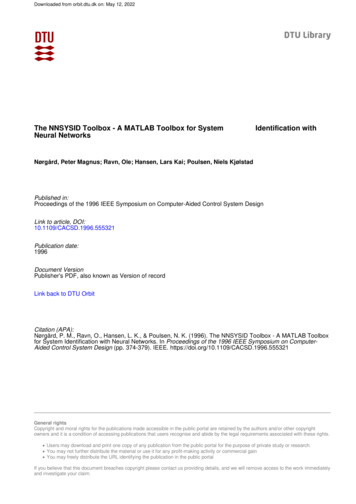
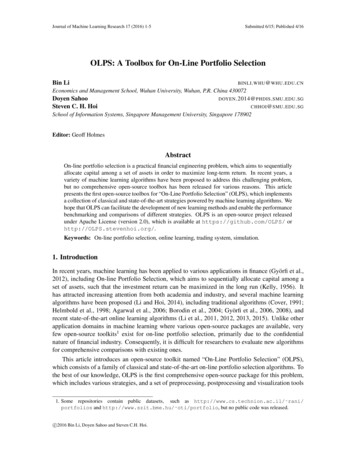
L I , S AHOO AND H OIin an integrated platform. The open-source nature of OLPS makes it easy for a third party to developnew algorithms, and facilitates the comparisons with many built-in algorithms on real datasets.2. Overview and ImplementationOLPS implements a framework for backtesting various algorithms for on-line portfolio selection inboth Matlab and Octave (the GUI is only available in Matlab) under Windows, Linux, and Mac OS.Figure 1 gives an overview of the OLPS toolkit with three main modules: (i) data preprocessing:it loads a dataset and initializes the backtesting environments, e.g., preparing log file handles, etc;(ii) algorithms: it calls selected algorithms, and simulates the trading process based on the chosendata from the first module; and (iii) post-processing: it analyzes statistical significance of the resultsfrom the second module, e.g., some risk-adjusted returns.Figure 1: Structure of the OLPS toolbox.2.1 Pre-processingDatasetsNYSE (O)NYSE xStockRegionsUSUSCAUSGlobalUSTime Frames07/03/1962 - 12/31/196201/01/1985 - 06/30/201001/04/1994 - 12/31/199801/02/1998 - 01/31/200304/01/2006 - 03/31/201001/14/2001 - 01/14/2003# Periods56516431125912761043507# Assets362388252430File Names (.mat)nyse-onyse-ntsesp500mscidjiaTable 1: Summary of the six datasets from real markets.The main functionality of this step is to initialize the trading environment. OLPS supports alltypes of datasets that Matlab/Octave accepts, and all existing datasets are in MAT-file. A typicaldataset contains an n m matrix of price relatives, where n denotes the number of trading periods,and m refers to the number of assets. It can be further adapted to incorporate real market data feeds,such that the toolkit can handle real time data and conduct paper trading or real trading2 . Table 12. For example, Interactive Brokers (http://www.interactivebrokers.com) provides free APIs. Paper andreal trading both require to implement order submission, while back test does not.2
A N O N -L INE P ORTFOLIO S ELECTION T OOLBOXsummarizes several representative public datasets included in the toolbox3 . Users are free to collectup-to-date data from various sources, such as the CRSP database, Quandl.com, etc.2.2 Algorithmic TradingThis step conducts simulation based on historical market data. Table 2 summarizes the familiesof algorithms implemented in the OLPS toolbox. In our framework, implementing a new strategygenerally requires four files, i.e., an entry file, a run file, a kernel file and an expert file. Theentry file extracts parameters and call the corresponding run file. The run file simulates a wholetrading process, and calls its kernel file to construct a portfolio for each period, which is usedfor rebalancing. The kernel file outputs a portfolio, while it facilitates the development of metaalgorithms, which combine multiple experts’ portfolios outputted by expert files that output oneportfolio. In case of only one expert, the kernel file is not necessary and directly enters the expertfile. Developing new strategies involves writing a kernel file, which aims to output portfolio.CategoriesBaselinesFollow the WinnerFollow the LoserPattern Matchingbased AlgorithmsOthersAlgorithmsUniform BAHBest StockUniform ntry cor/anticor anticor.mpamr/pamr 1/pamr 2.mcwmr stdev/cwmr mt0.mReferencesLi and Hoi (2014)Li and Hoi (2014)Li and Hoi (2014)Cover (1991)Cover (1991)Helmbold et al. (1998)Agarwal et al. (2006)Singer (1997)Borodin et al. (2004)Li et al. (2012)Li et al. (2013)Li et al. (2015)Györfi et al. (2006)Györfi et al. (2008)Li et al. (2011)Borodin et al. (2000)Borodin et al. (2000)Table 2: Summary of the implemented algorithms.2.3 Post-processingAfter the algorithmic trading simulation, the last step is to post-process the portfolio’s return seriesfor performance analysis by summarizing the following performance metrics: Cumulative Return: the most widely used performance metric in related studies; Volatility and Sharpe Ratio: measures volatility risk and related risk-adjusted return; Drawdown and Calmar Ratio: measures downside risk and risk-adjusted return; T-test statistics (Grinold and Kahn, 1999): tests if a strategy’s return is significantly differentfrom the market.3. More datasets and their details, including the components, can be found at the project website.3
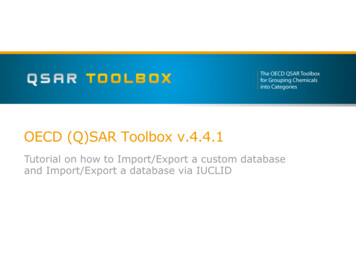
L I , S AHOO AND H OI3. Usage(a) GUI mode(b) Pseudo GUI modeFigure 2: GUI mode and Pseudo GUI mode.We provide three interfaces to run simulations in the toolbox. As shown in Figure 2, the toolboxhas two types of Graphical User Interfaces (GUIs), including a GUI implemented in Matlab anda Pseudo GUI in command line, which is thus available in both Matlab and Octave. The otherinterface is a Command Line Interface (CLI), and is also available in both Matlab and Octave.While a GUI is straightforward to use, in the CLI mode, we generalize a manager function soas to control the running of all algorithms.Suppose we are going to simulate the PAMR algorithmon the NYSE (O) dataset. The commands can be listed as follows:1: opts.quiet mode 1; opts.display interval 500; opts.progress 0;2: opts.analyze mode 1; opts.log mode 1; opts.mat mode 1;3: manager(’pamr’, ’nyse-o’, {0.5, 0}, opts);Line 1 and 2 set some variables that are used to control the display and file storage. Line 3 callsthe manager function to execute the “pamr” strategy on the “nyse-o” dataset with the parametersequaling “{0.5, 0}”. During the simulation, the toolbox will output information periodically. Afterthe simulation, the algorithm will analyze the returns and output the cumulative return, risk adjustedreturns and statistical test statistics. Corresponding running details and results will be automaticallystored in the Log folder.4. SummaryThis article presented OLPS — an open-source On-Line Portfolio Selection toolbox to facilitate therelated research in machine learning and computational finance. This is the first open-source projectin the area, which not only facilitates researchers to develop new strategies, but also allows them toeasily benchmark their performance with existing strategies. Besides, the toolbox supports a largecollection of classical and state-of-the-art on-line portfolio selection strategies. The toolbox offersa user-friendly GUI in Matlab, a Pseudo GUI and a CLI mode in both Octave and Matlab. We hopethat the open-source nature of the software would encourage researchers to extend the toolkit andshare their algorithms through the OLPS platform.4
A N O N -L INE P ORTFOLIO S ELECTION T OOLBOXAcknowledgmentsThis work was partially supported by the Project of NSFC (No. 71401128 and 71471142), theProject of SRF for ROCS, SEM, and Singapore MOE tier 1 project (C220/MSS14C003).ReferencesA. Agarwal, E. Hazan, S. Kale, and R. E. Schapire. Algorithms for portfolio management based onthe newton method. In Proceedings of ICML, 2006.A. Borodin, R. El-Yaniv, and V. Gogan. On the competitive theory and practice of portfolio selection(extended abstract). In Proceedings of the Latin American Symposium on Theoretical Informatics,2000.A. Borodin, R. El-Yaniv, and V. Gogan. Can we learn to beat the best stock. JAIR, 21:579–594,2004.T. M. Cover. Universal portfolios. Mathematical Finance, 1(1):1–29, 1991.R. Grinold and R. Kahn. Active Portfolio Management: A Quantitative Approach for ProducingSuperior Returns and Controlling Risk. New York : McGraw-Hill, New York, 1999.L. Györfi, G. Lugosi, and F. Udina. Nonparametric kernel-based sequential investment strategies.Mathematical Finance, 16(2):337–357, 2006.L. Györfi, F. Udina, and H. Walk. Nonparametric nearest neighbor based empirical portfolio selection strategies. Statistics and Decisions, 26(2):145–157, 2008.L. Györfi, G. Ottucsák, and H. Walk. Machine Learning for Financial Engineering. Singapore :World Scientific, 2012.D. P. Helmbold, R. E. Schapire, Y. Singer, and M. K. Warmuth. On-line portfolio selection usingmultiplicative updates. Mathematical Finance, 8(4):325–347, 1998.Jr. Kelly, J. A new interpretation of information rate. Bell Systems Technical Journal, 35:917–926,1956.B. Li and S. C. H. Hoi. Online portfolio selection: A survey. ACM CSUR, 46(3):35, 2014.B. Li, S. C.H. Hoi, and V. Gopalkrishnan. Corn: Correlation-driven nonparametric learning approach for portfolio selection. ACM TIST, 2(3):21:1–21:29, 2011.B. Li, P. Zhao, S. Hoi, and V. Gopalkrishnan. Pamr: Passive aggressive mean reversion strategy forportfolio selection. Machine Learning, 87(2):221–258, 2012.B. Li, S. C.H. Hoi, P. Zhao, and V. Gopalkrishnan. Confidence weighted mean reversion strategyfor online portfolio selection. ACM TKDD, 7(1):4:1 – 4:38, 2013.B. Li, S. C.H. Hoi, D. Sahoo, and Z. Liu. Moving average reversion strategy for on-line portfolioselection. Artificial Intelligence, 222:104 – 123, 2015.Y. Singer. Switching portfolios. International Journal of Neural Systems, 8(4):488–495, 1997.5
trading process, and calls its kernel file to construct a portfolio for each period, which is used for rebalancing. The kernel file outputs a portfolio, while it facilitates the development of meta . The toolbox offers a user-friendly GUI in Matlab, a Pseudo GUI and a CLI