Transcription
REPORTAffluencein America:A FinancialView of theMass Affluent
TABLE OF CONTENTSExecutive Summary.1Meet the Mass Affluent.2They’re Shrinking in Number.4Their Lifestyle.8Media Consumption.9The Rich Are Different – From Each Other.12The Distinct Segments of the Mass Affluent .13How Do I Reach Them?.15Why Segmenting is Important .15The Day in the Life of a “Family Fortune” household.16Conclusion.171Copyright 2012 The Nielsen Company.
ABOUT THIS REPORTIn over 100 countries around the world, Nielsen provides the most complete understanding of what consumers watch and buy. In theU.S., Nielsen has delivered insights about consumers for almost 90 years. Affluence in America: A Financial Perspective of the MassAffluent offers a fresh perspective on the affluent consumer segment of the U.S. economy. This report highlights the importance ofthis market and provides insights to help marketers succeed in the opportunities that lie ahead.“This report provides a general foundation for building effective strategiesthat will increasingly be the primary drivers of growth in virtually all productand service categories for the Mass Affluent. Understanding the distinctivepatterns of demographics, lifestyles and consumption can lead the way to asizeable and growing impact on total market share.EXECUTIVE SUMMARY”In recent years, a new segment of wealthy Americans has emerged that represents 11 percent of all U.S. households. Known asthe Mass Affluent, they typically were born during the post-war baby boom and grew up in middle-class households, earningrather than inheriting their money. For the financial services and retail industries, they represent a significant and highlysought-after market, especially now as they enter a pivotal period when many are rolling over 401(k) funds into retirementaccounts and anticipating inheritances.Based on an analysis by Nielsen, the Mass Affluent consists of seven distinct groups, each with its own lifestyles, mediapatterns and preferences when considering financial services. But, these high-earning households can be difficult to find andeven harder to sell to. Many live in the suburbs beyond the major metros that have been the traditional centers of Americanwealth. And thanks to an explosion of financial media, they are sophisticated consumers who often tune out traditionalmarketing strategies. Perhaps most challenging of all, many simply don’t think of themselves as rich.Highlights of the Mass Affluent: They have income producing assets between 250,000 - 1,000,000 Their estimated aggregated income producing assets total more than 7.5 trillion Two-thirds are over 55 years old Most are couples without kids or empty nesters They own their own home They work in Finance, Business and Management careers, or own their own business They are avid readers of newspapers, trade journals, travel and home-related magazines Possess multiple investment accounts including 401K, IRA, CDs and hold a fixed mortgage Adopters of high-end technology like digital recorders, video game consoles, smartphones and tablet devices They tend to shop less frequently than other groups, but spend more per shopping tripCopyright 2012 The Nielsen Company.1
MEET THE MASS AFFLUENTWho are they?Affluence in America brings to mind lavishbeach and ski vacations and first-classplane seats (when the company jet justwon’t do). But the last two decades havespawned another class of wealth whosemembers aren’t typically found eatingcaviar or summering in Europe. This newcrop of wealthy Americans was raised inmiddle-class suburbs and benefited fromcollege educations and years of economicprosperity during the bull market of the1990s. Today, they’re the empty-nestersconverting their kids’ old rooms to homegyms, shopping at club warehouses,and workaholics fiddling with theirsmartphones on the express commutertrain.They are Mass Affluents. Nielsen P YCLE,the segmentation system that classifieshouseholds into 58 types based ondemographics and financial behaviors,defines this group as households withinseven distinct segments with assetsbetween 250,000 and 1,000,000.They have a distinct lifestyle from the restof the nation in terms of demographics,media consumption, financial attitudesand—most important to financialinstitutions —preferences for financialproducts and services.Although amassing assets of 250,000to 1 million may seem modestcompared to the bank accounts of thebig city elite, there are only six percentof US households with greater IncomeProducing Assets (IPA). Nielsen IncomeProducing Assets (IPA) is a measureof liquid wealth which includes thevalue of checking accounts, savingsproducts, money market accounts andCDs, investment products, retirementaccounts, and other asset classes that arerelatively easy to liquidate. It does notinclude the value of any real estate ownedby the household.2Copyright 2012 The Nielsen Company.Financial Grouping CriteriaAverage IncomeIncome Producing Assets (IPA)RangeMass Market 50,722Less than 250,000Mass Affluent 105,500Between 250,000- 1,000,000Affluent 155,135More than 1,000,000The average income of a Mass Affluent household is more than double that of a Mass Markethousehold and more than two-thirds the average reported by Affluent households.Source: Nielsen Financial Track, 2011Household Percent by Income GroupTotalMassMarketMassAffluentAffluentUnder 50,00051.660.111.65.7 50,000 - 100,00032.630.646.434.2 100,000 - 249,99914.78.939.649.0 250,000 - 499,9990.80.21.77.4 500,000 0.40.10.73.7While many Mass Affluent households (42%) have incomes greater than 100,000, the majorityactually fall into the 50,000 to 100,000 range. The higher assets they have amassed may representa lifetime of savings from a moderate income rather than an ultra high household income.Source: Nielsen Financial Track 2011
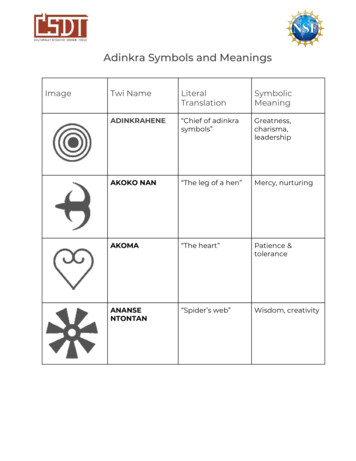
Affluence Groups – Percent of Market4.4%11.1%MASS AFFLUENT IS 7.5 trillionEstimated aggregatedincome producingassets13,000,000HOUSEHOLDS84.5%Mass MarketMass AffluentAffluentMore than 13 million households are classified as Mass Affluent basedon their assets, representing approximately 11% of all US householdsor nearly three times as many as are classified as Affluent.Average Incomeand IPA increasedby 2% between2010-2012Source: Nielsen Income Producing Assets (IPA) 2011More than 13 million households areclassified as Mass Affluent based on theirassets, representing approximately 11% ofall U.S. households or nearly three timesas many as are classified as Affluent.In addition to their above average assets,they also reported an average householdincome of 105,500 in 2011, more than50% higher than the national averageincome of 62,912.iThere has been a common theory over thelast few years that “the rich are gettingricher.” An analysis of recent income andasset data does show this to be true – totalassets for these households have grownover the last two years – but it also revealsdistinct differences between the Affluentand the Mass Affluent. While the averagehousehold IPA within the Affluent grouphas increased 2.6% compared to two yearsago, the average household income forthose households is actually down 3%over the past two years. The Mass Affluentgroup has seen both their average IPA andaverage household income increase by 2%each during this same period.Most Mass Affluents are Baby Boomers,over age 55. Most of these marriedcouples are empty nesters enjoying a quietlifestyle, but some still have teenagerswho haven’t left the nest yet. They areprimarily Caucasian – but 36% morelikely than average to be Asian American.They are well-educated with bachelor’sand post-graduate degrees whichprepared them for white collar careersin management, business and finance.Given their strong professional careers,they often find themselves in leadershippositions – both at work and in theircommunities.The Mass Market appeals to manymarketers because of the sheer numberof households in that group. Householdswith less than 250,000 in IPA represent85% of all U.S. households. Others seek tocapture a portion of the Affluent Marketand the high profit that often comes fromrelationships with those households.The Mass Affluent exists as a sweet spotbetween these two groups, offeringmarketers a larger, accessible audiencewith above average profit margins.6 million households moved upfrom Mass Affluent to Affluentgroup since 2010Copyright 2012 The Nielsen Company.3
THEY’RE SHRINKING IN NUMBERWhile the data shows that the assets andincome of the Mass Affluent have increasedslightly in recent years, it also shows thatthe size of the group is shrinking. Afterinitial post-recession rebounds by boththe Affluent and Mass Affluent groups, thenumber of households classified as MassAffluent is down from its peak in early2010. The redistribution of households byaffluence has resulted in a shift of about5% of total households, or nearly 6 millionhouseholds, from the Mass Affluent groupto the Affluent group.Marketers need a robust understandingof the Mass Affluents – who they are,where they live, what products they preferand how to best market to them. To winover this group, marketers will need tounderstand how to sub-segment thetypes of households within this group,as well as develop new products andservices, differentiated messages andvaried channels to serve them. But as thelargest affluent group in America, the MassAffluent can offer significant return onthese investments.And not only is the size of this groupshrinking, but their use of specific productsand services has declined in recent years.As interest rates have declined, use of CDsand money market savings accounts aredown more than ten percent among MassAffluent households compared to two yearsago. Negative equity and uncertainty in thehousing market has also led to a significantdecrease in use of home equity loans andHELOCs by this group.But as a group, Mass Affluents are stillmore than twice as likely to use any type ofretirement or investment product, includingIRAs, 401(k) accounts and brokerageaccounts. They are more likely than averageto have their income direct deposited intotheir bank accounts. In terms of otherchannels of access, like ATM and mobileaccess, their usage rates are on par with theMass Market.4Copyright 2012 The Nielsen Company.Change in Group Size Year Over YearYOY ffluent-3.49%Mass MarketMass AffluentEven though the Mass Affluent group is shrinking, approximately 2% of the households have seenincreases to IPA and income in the past two years. Additionally, 5% also moved up into the Affluent group.Source: Nielsen Financial Track 2012Financial Products by Affluence sCDs401(k)Mass MarketHomeEquityLoanHELOC Mortgage Stocks BrokerageAcctMass AffluentAffluentBrokerage Accounts are nearly 3 times more likely with the Mass Affluent group than the Mass Market. Indexof 100 U.S. averageSource: Nielsen Financial Track 2011
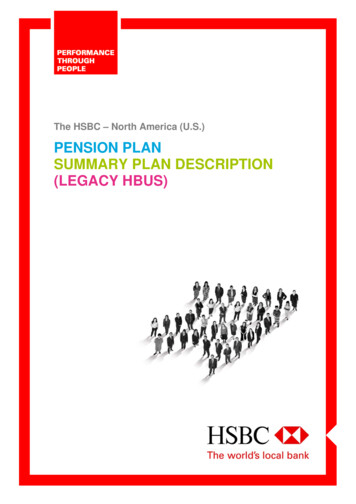
Where do they live?Capturing these Mass Affluent consumers will not be easy. Whereas the well-off wereonce reliably concentrated in old money enclaves near the nation’s big cities and inSunbelt golf communities, today’s prosperity is more dispersed. According to theanalysis of high-asset households, the Mass Affluent is increasingly found beyond thenation’s large metros and locating in smaller, exurban markets beyond the nation’smajor metros like San Francisco, Washington D.C. and the Tri-State area.These top-ranked pockets of affluence include a number of “second cities” like Hartford,CT, Monterey and Santa Barbara, CA—places noted for both livability and affordability.These communities are home to newly-retired or partially retired Americans who wantto be connected to a big city without having to live there.To map America’s new communities of wealth, our research identified households thatown more than 250,000 in Income Producing Assets (IPA). These are the customerscoveted by financial institutions because, unlike homes, cars or stamp collections, IPAcan readily be used to invest in big-ticket financial products.Mass Affluent Concentration by DMA and EthnicityMass Affluent Concentration by DMAVery High (index 150 )High (index 125-150)Above Average (index 110-125)Average (index 85-110)Below Average (index under 85)Asian American HHs with 100K Income1 Dot 1,000 HHsAfrican American HHs with 100K Income1 Dot 1,000 HHsHispanic HHs with 100K Income1 Dot 1,000 HHsMass Affluent AsianAmericans are mostheavily concentrated in theSan Francisco, Los Angelesand New York markets.Mass Affluent AfricanAmericans are mostheavily concentratedin the New York andWashington DC markets.Mass Affluent Hispanics aremost heavily concentratedin the Los Angeles, New Yorkand Miami-Ft. Lauderdalemarkets.The use of segmentation allows us to find where the Mass Affluent live on the ground – allowing financial institutions to reach this portion of the marketmore effectively for marketing purposes and determining opportunity in the market.Source: Nielsen Pop-Facts Demographics 2012 (income dot density) and Nielsen P YCLE (shading).It makes little difference whether wealth is defined as high assets or strong earnings.A map of households earning over 100,000 a year is nearly identical to the map ofheavy asset-owners. While some marketers hope to discover hidden wealth by reachingconsumers with high assets or strong earnings, this analysis shows that the correlationbetween income and assets is undeniable: The Mass Affluent possess both largepaychecks and healthy bank accounts.Copyright 2012 The Nielsen Company.5
Top 10 Markets% PenetrationMarketPenetration IndexSan FranciscoWashington D.C.Hartford & New Haven, CTBostonNew 1179167165BaltimoreMonterey-Salinas, CASan DiegoSanta Barbara16.2%15.8%15.4%15.2%161157153151An Index of 100 represents an average propensity, therefore, the Mass Affluent aremore than twice as likely to live in San Francisco area.Source: Nielsen Pop-Facts Demographics 2012Top 5 Markets forAfrican Americans with 100K HH IncomeWashington DCBaltimoreAtlantaNorfolk, VANew YorkTop 5 Markets forAsian Americans with 100K HH IncomeHonoluluSan FranciscoLos AngelesWashington DCSan Diego% .4%462313264217208% PenetrationMarketPenetrationIndexTop 5 Markets forHispanics with 100K HH Income% 2.4%1,105746308242230Miami-Ft. Lauderdale6.2%476Los Angeles4.5%348San Antonio3.8%291San FranciscoSan Diego3.4%2.9%263228Source: Nielsen Pop-Facts 2012A Market Penetration Index of 100 represents average.6Copyright 2012 The Nielsen Company.
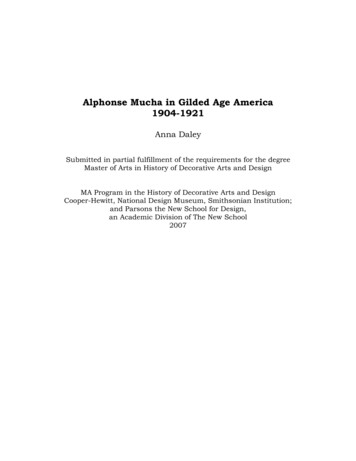
Mass Affluent in the San Francisco Market:Mass Affluent Concentration by ZIP CodeVery High (index 150 )High (index 125-150)Above Average (index 110-125)Average (index 85-110)Below Average (index under 85)Asian American HHs with 100K Income1 Dot 1,000 HHsAfrican American HHs with 100K Income1 Dot 1,000 HHsHispanic HHs with 100K Income1 Dot 1,000 HHsThrough ties to P YCLE segmentation, we are able to locate the Mass Affluent on the ground by market. The San Francisco DMA has the strongest concentrationof the Mass Affluent in the country. When we take a more granular view of the San Francisco market we see strong pockets of the Mass Affluent – in general andby race/ethnic groups.Source: Nielsen Pop-Facts 2012 (for income dot density) and Nielsen P YCLE 2011 (shading)Copyright 2012 The Nielsen Company.7
THEIR LIFESTYLEThe Mass Affluent have money to partakethe finer things in life. They enjoy culturalactivities and often attend classicalmusic and opera performances andvisit museums and art galleries. Theyare also civic-minded and engaged withthe community, making donations tocharitable public service organizationslike NPR and PBS. Pride of ownershipis important to them– they keep theirhomes and yards in tip-top shape and aremore than 28% more likely to pay morefor brands they can trust.iiDespite their demanding careers, theymake time to stay healthy and active.They go sailing and cross country skiingand enjoy golf and tennis at their countryclubs. Eating healthy, paying attention tonutrition and following an exercise routineis a priority for the Mass Affluent.Lifestyle Behaviors of theMass AffluentIndexBelongs to a Country Club287Attends Classical/Opera Performance (1x/month)272Contributes to NPR263Buys Light Classical Music251Contributes to PBS251Belongs to a Civic Club246Goes Sailing237An Index of 100 represents an average U.S. household, therefore the Mass Affluent aremore than twice as likely to participate in these lifestyle behaviors.Source: MRI Sports & Leisure Profiles and Nielsen P YCLE 2011Smartphone and tablet penetration increases with incomeSmartphone and Tablet Penetration by Income Groups59%Mobile PatternsNielsen can confirm that incomeplays a role in the acquisition of stillcomparatively expensive smartphonesand tablets. These devices are becomingthe preferred tools for online access andeconomic transactions in the future dueto portability and ease of use. Although itis relatively early for both devices, almost60 percent of higher income consumers,like the Mass Affluent, own a smartphoneand 31 percent own a tablet.45%35%31%12%4%SmartphoneTablet 30K 30K - 100K 100K Source: Nielsen Smartphone - Q4 2011 Mobile Insights, Tablet Nielsen NPower May 2012Mass Affluent Mobile %PictureAppLocation- Text Alerts PictureGameStreaming Ringtone Video/MobileMessaging Downloads basedDownloads Downloads online music DownloadsTVservicesor MobileRadioSource: Nielsen Mobile Insights, Q3/Q4 2011821%Copyright 2012 The Nielsen Company.Measured for a 30 Day Period
Financial Mobile App UsageActive Reach, iOS Android, Income 100K ChaseAvg Time Spent per Person (Minutes per Month) iOS Android,Income 100K Bank of America9%24ChaseMint.com4%Bank of AmericaCapital One4%E*TRADE2119Wells Fargo3%Citibank36Mint.com9%14American Express2%American ExpressWells Fargo2%CitibankDiscover2%Capital One8ING DIRECT2%ING DIRECT8E*TRADE1%Discover13111Source: Nielsen Mobile NetView, March 2012, Income 110k ; The chart on the left shows the percentage of individuals with incomes of 100k in the U.S. that accessed the iOS or Androidmobile app in March 2012; the chart on the right shows the average time spent for these individuals on those apps in March 2012.MEDIA CONSUMPTIONIn addition to their demographic and lifestyle characteristics, theMass Affluent have distinct media consumption patterns thatallows unique opportunity to reach this audience. Being wellinformed and staying up-to-date with current events are prioritiesto them. They consume news via TV, online and print. These proudhomeowners also consume media focused on their home lives- watching HGTV, checking out the Food Network website andreading home design magazines.iiiPrintThis group is made up of voracious readers. They fall into theupper half of all magazine and newspaper readers in the U.S. andare 61% more likely than average to read a daily newspaper. Theirtaste in reading material reflects their lifestyle. They are overtwice as likely as the average U.S. household to read Kiplinger’sPersonal Finance, Veranda and Conde Nast Traveler in additionto the daily paper. They enjoy reading the Sunday newspaper,specifically the business/finance section, editorials and the travelsection. They trust the information found in magazines more thanany other media source, making print an excellent way to reachand communicate with them about financial topics.Top Print for Mass AffluentIndexKIPLINGER’S PERSONAL FINANCE232VERANDA219CONDE NAST TRAVEL212SUNSET211ARCHITECTURAL DIGEST208BARRON’S207COASTAL LIVING207WINE SPECTATOR203GOLF DIGEST202TRAVEL & LEISURE198Source: Nielsen P YCLE/MRI Profiles 2011Copyright 2012 The Nielsen Company.9
RadioRadio is not the most efficient way to reachthe Mass Affluent – they are about average forlistening to radio compared to the rest of thenation. However, when they do listen to radio,these news junkies are likely to tune into the newsstations or XM radio. ivTelevisionThis group is selective and spends less of theirtime watching television, compared to the restof U.S. households. Mass Affluent householdsare 8% less likely to watch Broadcast TV and25% less likely to watch Cable TV than theaverage U.S. household, watching just over 112hours per month. However, when they do watchTV, they are more likely to watch programsrecorded on their DVR and news, sports andhome improvement channels. They are 56% morelikely than the average U.S. household to watchCNBC and 40% more likely than the average U.S.household to watch the Golf Channel.Higher income consumers are twice more likelyto subscribe to premium cable packages and fivetimes as likely to access television content viapaid telecommunications services than lowerincome consumers, resulting in a multitude ofchoices available to the higher income group.Top 10 Television Channels forMass AffluentIndexCNBC156SLEUTH140GOLF CHANNEL140FOX NEWS CHANNEL122SPEED118HD THEATER117NBC116MSNBC108HGTV107FOX BUSINESS NETWORK106Source: Nielsen People Meter, 201110Copyright 2012 The Nielsen Company.RADIOTVPRINTTime Spent Using a DVRHours:Minutes7:40 30K12:16 30K - 100K14:32 100K Source: Nielsen NPower, Q4’11 Monthly Avg. Persons 2 Total Day M-Su 6a-6a/Live 7TV Viewing Across Income GroupsHours:MinutesAll151:5828:11192:48 30K 30K 100K41:30148:4926:38112:25 100K 16:52TotalDaytimeSource: Nielsen NPower, Q4’11 Monthly Avg. Total Day M-Su 6a-6a/Daytime M-F 9a-5p
OnlineMass Affluents are engaged – going online multiple times perday. Given their demanding careers, they are 25% more likely thanaverage to access the Internet from work. When they go online;business, finance and investments are top of mind. They stayinformed on financial topics and their accounts by visiting sites likeAmerican Express, Bankrate and MSN Money.High income consumers (with incomes above 100K), like theMass Affluent, fit an average of 3 hours and 36 minutes of onlinestreaming into their monthly schedules, and spend an averageof 23 hours a month online. They receive business and financialnewsletters via email and watch business-related news videosonline, and are 75% more likely than the average U.S. householdto visit American Express online. The Mass Affluent also use onlinesites to track their investments, pay bills and register their giftcards.v As indicated in the Mobile charts previously, those withhigher incomes are spending similar amounts of time per monthon financial services apps as they are on the financial websites, andapp audiences are only marginally smaller than online audiences.MASS AFFLUENTS ARE8% LESS LIKELY THANAVERAGE TO ACCESSTHE INTERNET USINGMOBILE DEVICEIn addition to their focus on business and finance, these consumersplan their next vacation on TripAdvisor, research recipes on theFood Network, and read reviews on Yelp before their next eveningout. While they have embraced new technologies, they are not themost tech-savvy. They are 8% less likely than average to accessthe Internet using their mobile device.Financial Online UsageAvg. Time Spent Per Person (Minutes per Month), Online UsageActive Reach (%), Online Usage15%ChaseBank of America14%Citibank10%9%Wells Fargo8%American Express8%Capital 23Bank of AmericaWells Fargo21Chase1915TD Bank12Capital OneCitibankE*Trade1%Mint.comTD Bank1%American Express11109Source: Nielsen NetviewMarch 2012, 100K , Total Panel; The chart on the left shows the percentage of individuals with incomes of 100k in the U.S. that accessed the website in March 2012; the chart on theright shows the average time spent for these individuals on that site in March 2012.Copyright 2012 The Nielsen Company.11
THE RICH ARE DIFFERENT –FROM EACH OTHERFor the purpose of this analysis, the primarydriver for classification as a Mass Affluenthousehold was household IPA between 250,000 and 1 million. But in reviewingthe characteristics of this group, it quicklybecomes apparent that this group, likemost groups, is not monolithic. To moreclosely examine the differences in theirproduct usage behaviors and their channeland media preferences, this analysisdivides the Mass Affluent householdsinto seven distinct groups based largelyon differences in their age, income andfamily composition. The table to the rightoutlines the characteristics of each group bysegment.Households in segments 02, 03, 06, 10,and 11 are typically older than average,with ages predominately 55 and older andeither single or empty-nesters. Segment 07households are more likely to have childrenat home and segment 05 households aremostly made of couples without childrenthat are in the 45-54 age range.P YCLE SegmentsIPAIncome02 GlobetrottersEliteUpper-MidMature Mostly w/o Kids03 Business ClassEliteWealthyOlder Mostly w/o Kids05 Power CouplesEliteWealthyOlder w/o Kids06 Civic SpiritsEliteUpper-MidMature w/o Kids07 Family FortunesEliteWealthyOlder w/ Kids10 Capital AccumulatorsEliteUpscaleOlder Mostly w/o Kids11 Savvy SaversHighLower-MidMature w/o KidsDescriptionSource: Nielsen P YCLE 2011. P YCLE is a household segmentation system that groups consumers into 58 segmentsbased on income producing assets and a wide variety of financial and investment behaviors. The 58 P YCLE segmentsfit within 12 lifestage groups based on age family structure, income and assets. Older is defined as 45-64 and Matureis 65 years old.Households by Ethnic GroupCAUCASIANASIANMASS AFFLUENT88.9%15% more likelythan averageTotal U.S. HHs77.4%AFRICAN AMERICANMASS AFFLUENT4.1%65% less likelythan averageTotal U.S. HHs11.6%MASS AFFLUENT3.3%36% more likelythan averageTotal U.S. HHs2.4%HISPANICMASS AFFLUENT5.3%54% less likelythan averageTotal U.S. HHs11.3%This data is based on the percentage of households in the U.S. Caucasian households make up 88.9% of the Mass Affluents, which is 15% greater than totalCaucasian households (77.4%). African Americans make up 4.1% of the Mass Affluent households, which is 65% less than their national average of 11.6%.Source: Nielsen P YCLE 201112Copyright 2012 The Nielsen Company.
THE DISTINCT SEGMENTS OF THEMASS AFFLUENT02 Globetrotters: Members ofGlobetrotters have reached an age over 65years old and a level of financial comfort.Many have six-figure incomes that allowthem to indulge their passion for foreigntravel. Consisting mostly of suburbancouples, households in this segment haveamassed substantial IPA, such as variablerate annuities, government securities, andcorporate/municipal bonds. Admittedlyrisk-averse in their financial behavior,they buy a variety of insurance products,including long-term care, medical andresidential coverage. But playing it safedoesn’t apply when it comes to exploringother countries; members of Globetrottershave been known to take more than threeforeign trips a year. And many get theirnews about world events from U.S. News& World Report and Condé Nast Traveler.03 Business Class: Business Class isknown for its lavish spending style andcountry club lifestyle. But many of itsfifty-something executive couples havebegun to divert their high incomes to buildup long-neglected nest eggs. Segmenthouseholds rank highly for having Keoghplans, cash management accounts, andunit investment trusts. But they have onlyone-third the level of income-producingassets of The Wealth Market, and manyare trying to make up for lost time byaggressively investing in stocks, mutualfunds, and investment-style insurance.Located mostly in pricey suburban areas,Business Class scores high for businessand pleasure travel, high-end catalogshopping, listening to classical radio andreading business publications.05 Power Couples: The most affluentYounger Years segment, Power Couplesseems to have it made: six-figure incomes,designer-decorated houses, and highbalances in their income-producingassets. As investors, these mostly 45 to54-year-old couples boast retirementaccounts containing a well-diversifiedmix of options, stocks, and mutual funds.Typically college-educated and holdingmanagement jobs, they also tend to becultured consumers who travel the world,subscribe to publications like Forbes andArchitectural Digest, and shop at swankystores like Lord & Taylor and Nordstrom.When it comes to managing their money,however, they put their faith in the pros,exhibiting high rates for using assetmanagers, estate planners, and full-servicebrokers. Internet savvy, they track howwell their investments are doing online.06 Civic Spirits: They may be retired, butthey’re not retiring. The over-65-year-oldcouples who make up Civic Spirits tend tobe community activists who participatein civic events, write newspaper editors,and contact elected officials at highrates
the Affluent and Mass Affluent groups, the number of households classified as Mass Affluent is down from its peak in early 2010. The redistribution of households by affluence has resulted in a shift of about 5% of total households, or nearly 6 million households, from the Mass Afflue