Transcription
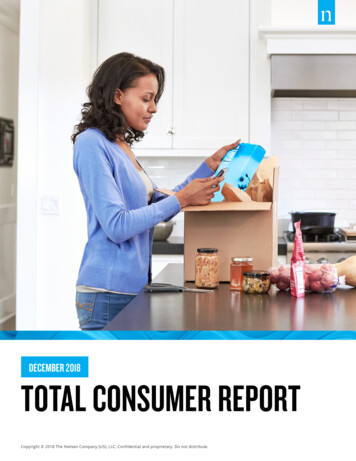
DECEMBER 2018TOTAL CONSUMER REPORTCopyright 2018 The Nielsen Company (US), LLC. Confidential and proprietary. Do not distribute.
WELCOMEThe third quarter of the year brought a return to growth for U.S. fast-moving consumergoods (FMCG). Within brick-and-mortar outlets, the uptick from a year ago was modest,with dollar sales up 1.8% and unit volume recovering from mid-year declines, flat at 0.1%.In these times of inflationary growth, it’s become pivotal for manufacturers and retailersto understand where consumer optimism exists, and not just manage, but activate thedata streams that power this understanding.JOHN TAVOLIERIChief Technology andOperations Officer andU.S. Buy PresidentNielsenToday, our nation remains well above the global average when it comes to consumeroptimism. In fact, for the third consecutive quarter, overall American consumerconfidence has held steady with an index score of 123, according to the third-quarter2018 Conference Board Global Consumer Confidence Survey, which is produced incollaboration with Nielsen. Relative to the third-quarter 2018 global average of 106, U.S.consumers are uniquely optimistic about both their job prospects and financial outlook.So what can you do about it? We’d argue that you need to get closer to your customersthan ever before. Truly understand how you can make their lives simpler and morefulfilling by identifying which problems you are trying to solve for them. Data can help youto achieve this, and in making your data work harder for you, you can make better, moreinformed decisions that will help to activate growth, not just discover where it is.This is an exciting time for our industry: Advanced technology presents an opportunity toreconsider the utility of the data at your disposal, whether it’s your own data, data fromthird-party suppliers, retail data and more. As we evolve into a tech-driven market, youcan’t afford not to count data among your core assets. The good news is that it’s noweasier than ever to invest in and receive data in its most usable form, ensuring that youreap a return on that investment. When it comes to having a useful, holistic, end-to-enddata strategy, seek data that enables you and your teams to solve problems, both for thegood of the consumer and for your organization’s operational effectiveness and efficiency.Migrate your teams to spend less time mining data in siloed environments and more timeactivating best-in-class data assets on-demand.The insights in this report offer a great foundation into the state of our industry. But Iinvite you to build on this foundation and use it as a call to action inside your organization.Use it as inspiration to go deeper and broader, and begin the path to democratizingdata to maximize the benefits to your organization. We recognize that a single source ofdata within an enterprise is no longer sufficient to drive the insights needed to succeedin today’s environment. That’s why we’ve built Nielsen Connect, an open ecosystemthat brings together the best in data assets, integrated within the most robust, opensource, cloud-based technology to unleash the power of all of your data. Our industryis transforming. It’s why we’ve built such unique capabilities that deliver consumerintelligence without barriers or latency so that you can make better decisions faster.Our Industry, Your Future, Transformed.Copyright 2018 The Nielsen Company (US), LLC. Confidential and proprietary. Do not distribute.2
CONTENTSOVERVIEW.4TOTAL STORE.7RETAIL.14E-COMMERCE. 20HEALTH & WELLNESS.24Copyright 2018 The Nielsen Company (US), LLC. Confidential and proprietary. Do not distribute.3
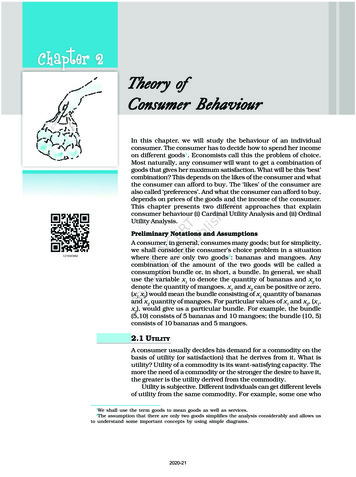
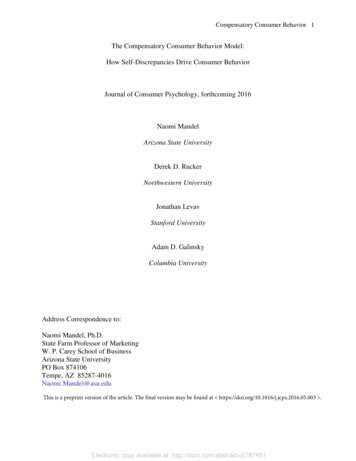
OVERVIEWOVERVIEWChange is upon us, and it’s time to embrace it. We’re all on the hunt for everygrowth opportunity abound in our industry, but finding them requires ascientific guide through uncharted territories. Simple measurement of thepast won’t predict the future. Why? Because the path-to-purchase is no longerlinear. Navigating consumer preferences today requires not just data sets, butdata assets that continually assess, monitor and inspire differentiatedmarket offerings.ALLOCATION OF IN- AND OUT-OF-HOME FOOD EXPENDITURESSlowed in-home FMCG consumption continues to challenge our industryCONSUMER-PERCIEVED % OF MONTHLY BUDGET17.515.78.06.4DINING OUTFOOD & BEVERAGES AT HOMEQ3 2011Q3 2018Source: The Q3 2018 Conference Board Global Consumer Confidence Survey, conducted in collaboration with Nielsen.Copyright 2018 The Nielsen Company (US), LLC. Confidential and proprietary. Do not distribute.4
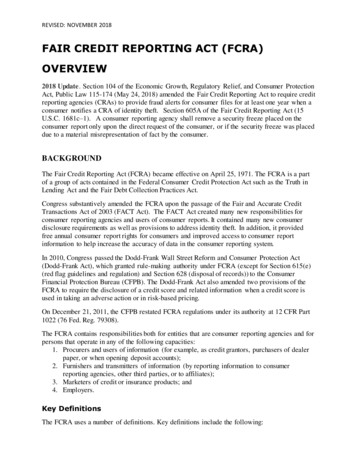
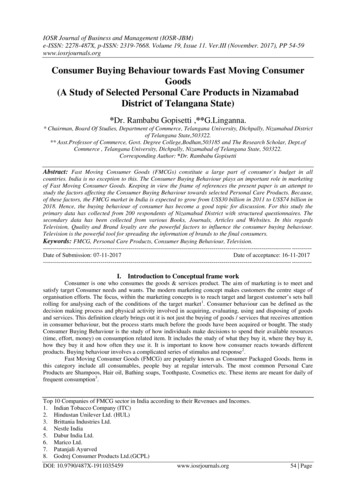
OVERVIEWOne new reality that’s a tough pill to swallow is the slowing rate of FMCGconsumption. As 2018 winds to a close, we’re left pondering how to stimulateorganic growth, beyond just dollars, in the movement of product volume inparticular. Today, our industry is being rocked by a shift away from in-homefood and beverage consumption, and this has caused challenging conditions tosay the least. In fact, the gap is shrinking in terms of how consumers allocatetheir in- and out-of-home food expenditures. While American consumers stillclaim to spend twice as much on in-home consumables as they do on diningout, when compared to 2011, Americans are spending nearly 2% more on diningout, and 2% less on food and beverages at home.It’s pivotal to understand the drivers of consumer intentions in order toencourage enhanced spending. The mindset of Americans has shifteddynamically in the last decade, and though consumption has been flat in stores,there’s been upticks in optimism that appear in favor of future FMCG growth.TOP CONCERNS OF AMERICAN CONSUMERSFood prices and crime are becoming more concerning to Americans“WHAT IS YOUR BIGGEST CONCERN OVER THE NEXT SIX MONTHS?”% RESPONDENTS28Q3 20172221211815171614 1413131011106THEECONOMYHEALTHQ3 ECURITYCRIME106INCREASINGFOOD PRICES79GLOBALWARMINGSource: The Q3 2018 Conference Board Global Consumer Confidence Survey, conducted in collaboration with NielsenWhen we look at what’s concerning to Americans, the economy, health and debtremain top-of-mind for many, but crime and food prices have risen the mostin terms of cause for alarm. But despite these concerns, consumer confidencecontinues to climb in America.Copyright 2018 The Nielsen Company (US), LLC. Confidential and proprietary. Do not distribute.5
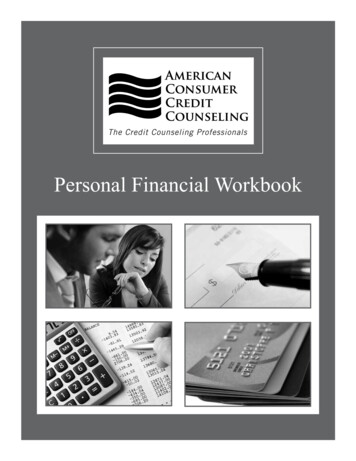
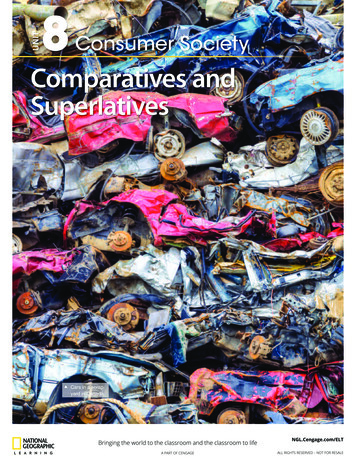
OVERVIEWCONSUMER CONFIDENCE INDEXOptimism in America continues to rise, currently well outpacing global norm889092981089894123121119991069910610577Q3 2011Q3 2012Q3 2013Q3 2014USQ3 2015Q3 2016Q3 2017Q3 2018GLOBALSource: The Q3 2018 Conference Board Global Consumer Confidence Survey, conducted in collaboration with NielsenIn the third quarter of 2011, American consumer confidence ranked over 10points below the global score of 88. Consumer confidence levels above andbelow a baseline of 100 indicate degrees of optimism andpessimism, respectively.Today, optimism is the highest we’ve seen in nearly a decade for Americans,and this is largely thanks to overall positivity being felt toward job prospects,personal finances and sentiment toward purchasing power. But as we’llcontinue to explore in this report, there’s still room to grow by harnessingthis optimism and encouraging FMCG purchases.Copyright 2018 The Nielsen Company (US), LLC. Confidential and proprietary. Do not distribute.6
TOTAL STORETOTAL STOREFMCG BRICK & MORTAR - TOP LINE PERFORMANCE 799.8B 1.8% vs. 2017 251.4B 0.1% vs. 2017DOLLARSUNITSSource: Nielsen Retail Measurement Services, Total Food View, Total U.S. xAOC, 52 weeks endedNov. 24, 2018, UPC-coded and random-weight/non-UPC dataCopyright 2018 The Nielsen Company (US), LLC. Confidential and proprietary. Do not distribute.7
TOTAL STOREAcross the FMCG brick-and-mortar landscape, sales and volume figures remainmodestly above those we reported on a year-ago. While we’ve managed toescape overall volumetric declines, physical consumption of products continuesto lag as unit volume remains flat year-over-year. Inflationary factors haveenabled more than 14.2 billion (or 1.8%) in sales growth, which has bolsteredour industry, but dissecting this growth is the first step toward understandingwhere consumption may be expandable.In a positive turn of events, center of store edible goods have returned to aposition of growth, up nearly 6.3 billion in dollar sales compared to a yearago. Within these aisles, frozen foods have seen the swiftest pace of growth,up 2% in dollars and 1% in units. The backbone of this growth is likely due tothe reinvigoration and repositioning of frozen foods to appeal to consumers ofbroader ages and lifestyles. Meanwhile, inflation has spearheaded dollar lifts ingrocery and dairy products.DRIVERS OF GROWTH - FMCG BRICK & MORTARThough they’re half the size of center store edibles, fresh foods drive outsized growth 1.8%- 1.4B 2.7B 5.8B 6.3B 765B 752B2017NON GROCERYHOME &PERSONAL CAREFRESHPERISHABLESCENTER STOREEDIBLES2018Source: Nielsen Retail Measurement Services, Total Food View, Total U.S. xAOC, 52 weeks ended Nov. 24, 2018,UPC-coded and random-weight/non-UPC data, excludes alcohol, see endnotesOne area of the store that continues to command the spotlight is the perimeter.While growth hasn’t quite matched that of the center of the store, perishableshave generated an impressive 5.8 billion in sales growth; a figure that’s by andlarge beyond what we’d expect relative to the category’s size. Considering thatfresh foods command just 24% of in-store FMCG sales, they have accounted for awhopping 44% of brick-and-mortar growth. Despite these outsized dollar figures,it’s important to relate this back to a common volumetric denominator. In termsof unit volume, fresh foods fall flat, up just 207 million units this year, or 0.3%.Copyright 2018 The Nielsen Company (US), LLC. Confidential and proprietary. Do not distribute.8
TOTAL STOREAs the search for consumption growth becomes increasingly challenging, it’sessential to follow consumer demand with granularity and regularity. Finding,and even predicting, a trend can be an arduous task, but one that’s made easierthrough intelligent, technologically advanced data applications. For example,we’ve identified beverages as an in-store growth driver.In the latest year, mainstream U.S. retail outlets have sold over 56 billion inbeverages, representing year-over-year sales growth of 1.8 billion (3%) and 2%unit volume growth. But not every beverage category across the store has outperformed, and following the path to growth is the first step on the journey tochanging and reinvigorating consumption occasions with your products.GROWTH TRENDS IN BEVERAGESBeverage performance driven by water and functional drinksWHAT’S HOTWHAT’S NOTCATEGORY %GROWTHUNIT %GROWTHKOMBUCHA42.942.1VALUE ADDED WATER17.5SPARKLING WATER %GROWTHUNIT %GROWTHFRUIT & VEGETABLEBLENDED BEVERAGES-15.5-16.313.0COCONUT WATER-4.6-5.317.57.4SPARKLING JUICE-3.6-2.4READY-TO-DRINK COFFEE10.510.1SMOOTHIES-3.5-2.7SELTZER WATER9.42.7FRUIT JUICE-1.6-1.4CATEGORYSource: Nielsen Retail Measurement Services, Total Food View, Total U.S. xAOC, annual sales of more than 10million, 52 weeks ended Nov. 24, 2018, UPC-coded and random-weight/non-UPC dataCopyright 2018 The Nielsen Company (US), LLC. Confidential and proprietary. Do not distribute.9
TOTAL STOREToday in the beverage space, functional drinks reign supreme. And kombucha,a fermented tea touted for its probiotic contents and healthful benefits, leadsthe way. It’s seen growth rates far and above other categories, up 43% in dollarsand 42% in unit volume year-over-year. Ready-to-drink coffee is another populardrink variant that’s provided a functional energy boost to many. And like manybeverages, it could be considered the equivalent of a snack, as Americans seekto not just eat, but to drink in between meals throughout the day.Smoothies and blended fruit and vegetable beverages have fallen out offavor this year, showcasing the changing tastes in how America drinks. Evencoconut water, which was a top growth driver just a couple years ago, has beennegatively impacted by consumers seeking enhanced waters for their hydrationneeds. In comparing what’s hot and what’s not, it becomes clear that whatonce might have been quenching, filling and nourishing, must now be purposefulfilling, light and fizzy. Water is a category that seems to meet all three of thesecriteria, and it’s breathing new life into the American beverage industry.TOTAL WATER PERFORMANCESparkling and value-added water have bolstered growth 12.2 BILLION 7% VS. YEAR-AGO5.7 BILLION UNITSTOTAL WATER 5% VS. YEAR-AGO %GROWTH 17% 18% 9% 5% 3% 3%SPARKLINGWATERVALUE ADDEDWATERSELTZERWATERCLUB SODATONIC WATERREGULARWATERSource: Nielsen Retail Measurement Services, Total Food View, Total U.S. xAOC excluding convenience stores,52 weeks ended Nov. 24, 2018Water plays a starring role in many Americans’ quests for improved health.Notably, 77% of surveyed Americans indicate that trying to drink more water isamong the primary ways they actively manage their health and lifestyle.1 Thissentiment helped boost water sales an impressive 7% (or, 848 million) overthe past year. This hits well above the 3.4% growth experienced by beveragesoverall, led by strong demand for both sparkling and value-added waters.1Nielsen survey of 1,163 respondents, surveyed in April 2017Copyright 2018 The Nielsen Company (US), LLC. Confidential and proprietary. Do not distribute.10
TOTAL STORECapitalizing on growth within a singular category is important. But there’sopportunity across the store to align and multiply the impact of high-growthproducts. Knowing which products consumers of water are more likely tobuy provides invaluable insight into where synergies exist across categories.Nielsen’s Spectra Strategic Insights leverages demand-based predictiveanalytics, in a cloud-based app to rank cross-promotion opportunities ofseemingly disparate categories.In this instance, we’ve created a ranking based on an in-depth comparisonof bottled water consumers to buyers of other categories across the store.The data shows that ethnic health and beauty products, baby food, men’stoiletries and prepared food dry mixes are all highly complementary tobottled water sales. In other words, based on a unique combination of alignedcharacteristics, consumers of bottled water are more likely to purchase thesecategories. Therefore, manufacturers and retailers trying to reinvigorateconsumption patterns can do so through partnerships and cross-promotionsgrounded in scientific alignment with consumer demand.CO-PROMOTIONAL OPPORTUNITIESCapitalizing on the growth of water via complementary categoriesWHAT BOTTLED WATER CONSUMERS ARE MORE LIKELY TO BUY:ETHNIC HEALTH & BEAUTY CARE5.3%129BABY FOOD15.0%112MEN’S TOILETRIES14.6%11290.5%PREPARED FOOD DRY MIXESICEDISPOSABLE DIAPERSWOMEN’S FRAGRANCESFRESH MEATFROZEN MEAT & 6%72.5%110% AMERICANS BUYING110INDEX OFDEMOGRAPHIC FIT109Read as: Bottled water consumers are 29% more likely to purchase ethnic health & beauty products compared to the average American.Source: Nielsen Spectra Strategic Insights, Marketing Activation dashboard using Homescan Product Library, Nov. 2018Copyright 2018 The Nielsen Company (US), LLC. Confidential and proprietary. Do not distribute.11
TOTAL STOREBeyond complementary growth throughout the store, there are ways to betterunderstand what’s driving the pace of change within a category as well. Whilethe impressive sales performance of water points to heightened demand,measurement of innovation performance has and continues to serve as apredictor of future growth. The water category is a perfect example of wherewe’ve seen rapid expansion in both innovation and sales take hold.For water, the category looks nothing like it did just a few years ago. Thetrajectory for innovation has grown exponentially as the shelf set has beencompletely transformed. Today, water aisles are on track to outpace the lastthree years in terms of new items released. Comparing 2015 to 2017, wesaw nearly 3X the number of new water items hit shelves. Between July andSeptember 2018 alone, at least 192 items came to market. And with so muchinnovation coming to market, it’s critical to have visibility into each as they enterthe market, as those results can guide how you hedge against the competition.WATER INNOVATION ACTIVITYWater innovation trajectory shifts upward YTD 2018Source: Nielsen Innovation Measurement, Activity, Total U.S., 52 weeks ended Sept. 22, 2018Even at an item level, measurement of innovation performance can offerperspective into what direction the category is headed. When ranked basedon units sold, a majority of the top innovation items were large-format noncarbonated waters. Given the ubiquitous nature of water among consumers, itshouldn’t be too surprising that non-carbonated waters have a strong presencein the category. What’s more telling, is the influence of private label in this space.Copyright 2018 The Nielsen Company (US), LLC. Confidential and proprietary. Do not distribute.12
TOTAL STORETOP WATER INNOVATIONS BY UNITS SOLDPrivate labels represent five of the top 10-selling innovations in water this yearITEMINNOVATION TYPENESTLE PURE LIFE NON CARBONATED BOTTLE 16.9FOZ X40LINE EXTENSIONLIFEWTR NON CARBONATED BOTTLE 33.8FOZ X1NEW BRAND / BRAND EXTENSIONNON CARBONATED PRIVATE LABEL JERRY 128FOZ X1NEW BRAND / BRAND EXTENSIONLIFEWTR NON CARBONATED BOTTLE 23.7FOZ X1NEW BRAND / BRAND EXTENSIONCULLIGAN NON CARBONATED BOTTLE 128FOZ X1LINE EXTENSIONNON CARBONATED PRIVATE LABEL BOTTLE 16.9FOZ X24LINE EXTENSIONNON CARBONATED PRIVATE LABEL BOTTLE 128FOZ X1LINE EXTENSIONSPARKLING ICE CARBONATED RASPBERRY & GRAPE BOTTLE 17FOZ X1LINE EXTENSIONCARBONATED PRIVATE LABEL BLACK RASPBERRY BOTTLE 17FOZ X1LINE EXTENSIONNON CARBONATED PRIVATE LABEL BOTTLE 16.9FOZ X45LINE EXTENSIONSource: Nielsen Innovation Measurement, Profiler, Total U.S. xAOC including convenience stores, 52 weeks ended Oct. 8, 2017Compared to beverages as a whole, where store brands represent about 11% of dollarsales, water is unique in that store brands generate more than 25% of category sales. 2Store brands are also focused on innovations. In fact, when ranked based on unitssold, private labels represented half of the top 10 water innovations last year.Innovation measurement provides a wealth of context around where to look nextfor growth opportunities. Extending this concept to the greater FMCG universe, it’simperative to align your product planning efforts with the predictive capabilities of ondemand innovation analytics. In the case of water, the strong performance of privatelabel items, particularly non-carbonated SKUs, was an indicator of water performanceto come in 2018.Private-label products have been indispensable to the water category, but as we’llreview next, private-label products across the FMCG spectrum have bolstered theretail landscape in general.2Nielsen Retail Measurement Services, Total Food View, Total U.S. xAOC including convenience stores, 52 weeks ended Sept. 29, 2018Copyright 2018 The Nielsen Company (US), LLC. Confidential and proprietary. Do not distribute.13
RETAILRETAILFMCG volume consumption has remained flat this year. As a result, it’s a tall order toencourage Americans to add more to their shopping baskets. Amid a year of inflationarygrowth, insight into channel dynamics helps assess where there is potential to grow triptraffic and stimulate additional product consumption.In stark contrast to 2017, when trips per shopper declined by 1.3%, trip traffic acrossall channels has increased this year. While Americans are making just 0.3% more tripstoday than they were a year ago, this signals that increased trips to outlets like massmerchandisers, dollar stores and purchases online have moved the needle enough toshift our industry away from consecutive periods of traffic declines.The roots of e-commerce are becoming better cemented in the foundation of our FMCGindustry. As we’ll review a little later, Americans continue to spend more per person onconsumer goods online. Comparatively, dollar stores and premiere fresh grocery storesalso saw growth in both trip traffic and in basket size. But growth remains inflationary,as units purchased per shopper, per trip, declined in these instances.TRIP ANALYTICS BY CHANNELDollar stores continue to see growth in purchase size and frequencyTOTALCHANNELSDRUG STORESDOLLARSTORESWAREHOUSECLUBPET STORESMASS MERCH& SUPERSVALUEGROCERYCONVENTIONAL 38185914TRIPS/SHOPPER% CHANGE0.3-0.81.90.70.52.8-1.40.11.0 SPEND/TRIP312013683440283322 SPEND/TRIP% CHANGE0.10.90.9-0.6-3.0-0.90.20.82.0UNITS/TRIP % CHANGE-0.2-5.6-0.52.3-3.8-0.3-3.2-0.1-0.7Source: Nielsen Homescan, Trip Projected Data, Total U.S., 52 weeks ended Sept. 29, 2018 vs. year-ago, UPC-codedCopyright 2018 The Nielsen Company (US), LLC. Confidential and proprietary. Do not distribute.14
RETAILSimilar to earlier points in the year, private-label product consumptioncontinues to rise, avoiding the major plateaus that store brands haveexperienced. In fact, private labels have driven over 6.2 billion in brick-andmortar growth this year, up 4.6% in dollars and 3.2% in units. In reviewingannual sales with each new quarter, the strong growth trajectory of storebranded products really comes to life. Where private labels were growing at 2%when measured in September of 2017, they are now growing at more than twicethat rate, up 4.6% year-over-year—well above what branded tiersare experiencing.What’s worth noting in this performance snapshot is that the largest andsmallest of branded product tiers have seen modest growth. In fact, wherethe top 20 brands and “remaining” long tail of small brands were experiencingdeclining sales when measured in September of 2017, they are now up by 0.8%and 2.3%, respectively, in annual sales. A look into where private labels areseeing the greatest lift is a good starting point to enabling brands, both big andsmall, to better activate in-store strategies.FMCG BRICK & MORTAR MANUFACTURERTIERS - DOLLAR GROWTHStore brand growth trajectory continues to accelerate4.62.32.11.00.30.80.0-0.7PRIVATE LABELTOP 2021-100101-200REMAINING-0.9 -0.9Q3 2017Q4 2017Q1 2018Q2 2018Q3 2018Source: Nielsen Retail Measurement Services, Total Food View, Total U.S. xAOC, 52 week periods ended Sept. 30, 2017 toSept. 29. 2018 vs. previous year, UPC-coded and random-weight/Non-UPC dataCopyright 2018 The Nielsen Company (US), LLC. Confidential and proprietary. Do not distribute.15
RETAILFASTEST RISING PRIVATE LABEL PRODUCTSBY DOLLAR GROWTHStore branded prepared snacks and meals see rapid growthPRIVATE LABEL DOLLAR SHARE AND GROWTHSUPER-CATEGORYCATEGORY SHARE % GROWTHLAWN CAREGRASS SEED28.9% 282FIRST AIDANTISEPTIC71.0% 165SEAFOODPOLLOCK22.6% 140PEST CONTROLINSECT REPELLENT PRODUCTS4.4% 128PET SUPPLIESPET BEDS50.6% 109MEAL COMBOSSNACK COMBOS11.8% 103HOME AIR FRESHENERSFRAGRANCE OILS22.3% 91MEAL COMBOSLUNCH COMBOS1.2% 83PREPARED FOODSMEAL KITS5.6% 79SWEET SNACKSDESSERT BARS7.5% 79Source: Nielsen Retail Measurement Services, Total Food View, Total U.S. xAOC, categories with annual private-label sales of morethan 10 million, 52 weeks ended Oct. 27, 2018 vs. year-ago, UPC-coded and random-weight/non-UPC data.When ranked by sales growth, various prepared snacks and meal combinationscomprised the top categories driving private-label performance. This highlightsthe trust and relationship that certain retailers have built among consumers whoare purchasing store branded snacks and meals. Knowing which combinations offoods to feature, which types of dips, sauces and accompaniments will sell, andeven how your snack and meal are packaged, are all factors that can be carefullyanalyzed for predictive purposes. This granular, attribute-based approach appliesto even non-food categories. Fragrance oils are among the categories whereprivate-label products have seen rampant expansion. To this end, knowing whichscents, which features and which price points have enabled this growth, will bekey to sustainably expanding or competing against store brands in this category.Copyright 2018 The Nielsen Company (US), LLC. Confidential and proprietary. Do not distribute.16
RETAILWHO’S WILLING TO PAY A PREMIUM FOR THE RIGHTSTORE BRANDED PRODUCTSPrice sensitivity toward private-label products is fading over time“IF I LIKE A STORE BRAND PRODUCT, I’M WILLING TO PAY THE SAME/MORE FOR IT THAN A NAME BRAND PRODUCT”% RESPONDENTS34%38%34%TOTAL U.S.37%WHITE39%42%35%AFRICAN AMERICAN201440%35%ASIAN39%HISPANIC2018Source: Nielsen Homescan survey of 43,663 and 45,880 respondents, surveyed between January - February of 2014 & 2018,reported by National Consumer PanelWhen it comes to price, we’ve already seen private-label products divergefrom the stereotype of being discount offerings. In fact, over the last fiveyears, surveyed-Americans of all ethnicities indicate a greater likelihood topay the same or even more for the right store branded product. This shiftingperception, or increased willingness to splurge for store brands, is particularlythe case for Asian and Hispanic consumers, whose collective willingness hasshifted up 5% and 4%, respectively, since 2014. While this signals a growingappetite for private-label goods, it also highlights a silver lining for name brandproducts: The so-called race to the bottom when it comes to competing onprice may be showing signs of fading.Copyright 2018 The Nielsen Company (US), LLC. Confidential and proprietary. Do not distribute.17
RETAILDOLLAR SHARE BY PRICE TIERFor premium products, private labels are growing sales at 2X the rate of name brands GROWTH GROWTH 13.7% 7.2%8%10%18% 6.1% 6.4%19%18% 2.4%TIER 5 (PREMIUM)TIER 4TIER 3TIER 2 5.3% 1.7%30%26% 0.1%27%-0.9%11% 5.8%TIER 1 (DISCOUNT)33%PRIVATE LABELBRANDEDSource: Nielsen Analytic Product Attribute (APA) database by Nielsen Advanced Solutions Group,52 weeks ended March 31, 2018 vs. year-agoConsumers may be willing to pay more for store brands than they used to be, butwhen dissected by price tier, it’s clear that premium products are already drivingstrong growth across retailers. Analyzing individual UPC price points, we createda five-tier distribution that isolates the most premium- and discount-orientedgroups of products. Through this, we can see that the most premium tiers ofprivate-label products aren’t just leading private-label performance, they’reoutpacing the growth of all name brand product tiers.Premium products have been essential to the performance of private labelsacross retailers. But how have premium products manifested themselves withinvarious retail channels? When it comes to pet care, premium assortment isn’tlimited to specialty stores. And, rapid growth in e-commerce hasn’t stoppedconsumers from hitting mainstream big-box retailers for their pet food needs. Infact, consumers have spent more than 16 billion on pet food at traditional retailoutlets, up nearly 2% from a year ago. Consumption has slowed, with volume ofpet food down 1% in this same timeframe. In many cases, this uptick in sales canbe linked to the influx of premium pet food brands on mainstream store shelves.Copyright 2018 The Nielsen Company (US), LLC. Confidential and proprietary. Do not distribute.18
RETAILPET CONSUMABLES - EXPANDED RETAIL UNIVERSENeighborhood pet retailers move the needle among pet-focused retail outlets 3.5B 1.6BFARM AND FEED 8.0B*estimated total based on projected dataVET CLINICSPET SUPERSTORES ANDNEIGHBORHOOD PET STORESMAINSTREAM RETAIL 16.0B 29.1BIN PET CONSUMABLESSOLD ACROSS PHYSICALRETAIL CHANNELS.PET CONSUMABLESSource: Nielsen Retail Measurement Services, Pet food and treats, Total U.S., 12 months ended June 2018 vs. year-ago, Mainstreamretail measured via Nielsen’s All Outlets Combined (xAOC) universe; includes pet superstores, neighborhood pet retailers andestimates of farm and feed channelWith that said, there’s still a niche being served via pet superstores andneighborhood pet retailers. Together, “specialized” pet retail offerings(superstores and neighborhood pet stores) represent a combined 8 billion inannual sales and 3.2 billion in pounds of pet consumables. But performancehasn’t been consistent across retail sectors in this space. In fact, while petsuperstores have seen declines in both volume and dollar sales, neighborhoodpet retailers have continued to experience impressive dollar and volumegrowth.Neighborhood pet shops are differentiated in their ability to offer personalizedservices and access to communities of interest to their shopper bases. Thesefactors are appealing to consumers, and a closer look at past performanceindicates that small regional chains and independent storefronts havedriven the most growth among pet “specialist” retailers. With unmatchedassortment available online, as well as the convenience of pet food availabilityin mainstream retail, pet superstores have struggled to compete. As we’llreview a little later, the recipe for success in pet care is heavily grounded inunderstanding digital shopping fundamentals.Copyright 2018 The Nielsen Company (US), LLC. Confidential and proprietary. Do not distribute.19
E-COMMERCEE-COMMERCEToday, 53% of the global population (4 billion people) are connected to the internet.In the U.S., that figure jumps to 84%. Digital infrastructure is abound in nearly everyaspect of our lifestyles, and America is not sur
Dec 04, 2019 · Source: The Q3 2018 Conference Board Global Consumer Confidence Survey, conducted in collaboration with Nielsen In the third quarter of 2011, American consumer confidence ranked over 10 points below the global score of 88. Consumer confidence levels above and below a baseline of 100