Transcription
A Nielsen ReportBattle of the Bulge& Nutrition LabelsHealthy Eating TrendsAround the WorldJanuary 2012
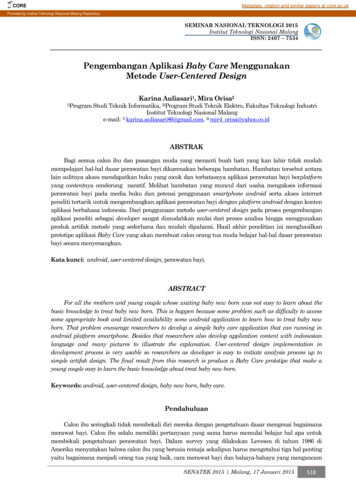
MORE THAN HALF OF CONSUMERS AROUND THEWORLD CONSIDER THEMSELVES OVERWEIGHTHalf (48%) of consumers around the world are trying to lose weight.One-in-seven are cutting down on fats to shed unwanted pounds.Six-in-10 indicate difficulty grasping nutritional labels on food packages.Over two-thirds believe nutritional claims are either never or only sometimes trustworthy.Half of global respondents say fast food restaurants should always include calorieinformation on menus.More than half (53%) of consumers around the world say they areoverweight—up from 50 percent three years ago. Roughly onethird consider themselves just the right weight, which is down from40 percent in 2008 and one-in-10 believe they are underweight.New findings from a Nielsen survey of more than 25,000 onlinerespondents from 56 countries around the world reveal howconsumers are battling the bulge and how food producers andmarketers can help fight the good fight against obesity.With half of respondents claiming to be overweight, it’s logicalthat half (48%) are also trying to lose weight. And for morethan three-quarters (78%) of these consumers, the way to shedunwanted pounds is through diet. But do consumers understandAt the moment, would you consider yourself:what they are eating? Not necessarily. The study finds that half(52%) of consumers around the world understand nutritionalinformation panels on food packaging only in part. Four-of-10consumers understand nutritional labels “mostly” and sevenpercent say they do not understand them at all.And what about trust—do consumers believe that claimson product packaging are accurate and truthful? Here too isambiguity in the minds of consumers. Of 10 different productclaims studied, only three received a complete believabilityrating by more than 20 percent of consumers (calorie content33%, vitamin content 28% and fat claims 23%), highlighting aneed to better educate consumers.VERY OVERWEIGHTGlobal AverageGLOBAL AVERAGELATIN AMERICAEUROPE104 E EAST/AFRICA154 8%Source: Nielsen Global Survey, Q3 2011Copyright 2012 The Nielsen Company.46%6NORTH AMERICA{3 113758%58%ASIA PACIFIC1UNDERWEIGHT{36ABOUT THE RIGHT WEIGHT{35A LITTLE OVERWEIGHT{4 14SOMEWHAT OVERWEIGHT63%324
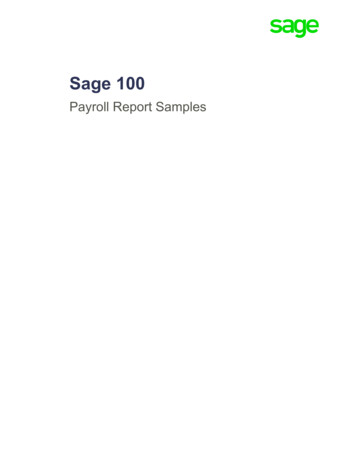
Healthy Eating is a Conscious ChoiceIt turns out that no matter what region of the world consumershail from, there is a strong consensus about how to lose weight.Dieting is the most popular method among more than threequarters (78%) of global online respondents, followed closelyby engaging in physical exercise (69%). The age-old method ofdiet and exercise to drop weight reigns supreme as consumersindicated by the comparatively low percentages of respondentsusing alternative methods, such as taking diet pills/medicine oreating/drinking bars and shakes.Which of the following actions are you taking tolose %7%2%7%Other ways to slim down include eating smaller portions(44%), eating less processed foods (35%), following a lowcarbohydrate/high-fat diet (18%), which had more than doubledsince 2008, following another diet plan (16%), or using aslimming program (7%).In what ways are you changing your diet to lose weight?70%69%62%64%CUTTING DOWNON FATSCUTTING DOWN ONCHOCOLATES, SUGAR, ETC10%5%6%14%8%8%DOING PHYSICAL EXERCISECHANGING MY DIETTAKING DIET PILLS / BARS /SHAKESSource: Nielsen Global Survey, Q3 2011EATING THE SAME, BUTHAVING SMALLER PORTIONSEATING LESSPROCESSED FOODS74%69%14%FOLLOWING A LOWCARBOHYDRATE, HIGH FAT DIETFOLLOWING ANOTHERDIET PLAN80%USING WEIGHT WATCHERS OROTHER SLIMMING PROGRAMMESOTHERTAKING MEDICINEPRESCRIBEDBY MY DOCTOROTHER55%53%44%46%EATING MORE NATURAL,FRESH FOODS70%70%61%5%7%The most popular way to shed unwanted pounds according to70 percent of global online respondents is cutting down on fats.Trimming back on chocolates and sugary foods (62%) and eatingmore natural, fresh foods (55%) round out the top three waysconsumers are changing their diets. In fact, using these tried andtrue methods has remained virtually unchanged from three yearsago, according to Nielsen’s 2008 report.Global Average62%EUROPEDiet fads come and go, and what is popular one year can bequickly replaced by another craze the next. From countingcalories and macrobiotic diets to liquid protein fasts and lowcarbohydrate/high protein plans, weight-management solutionshave the power to not only alter waist lines, but to influence thefood industry as well.7%35%29%18%16%9%7%5%5%5%20112008Source: Nielsen Global Survey, Q3 2011And when it comes to considering what is healthier—a productwith no artificial additives with full sugar or one that has artificialsubstitutes but reduced in calories, almost half (48%) of globalrespondents say neither. However, of the two options, the noartificial additives/full sugar choice (29%) is favored over theartificial substitutes/reduced calorie option (15%).Copyright 2012 The Nielsen Company.2
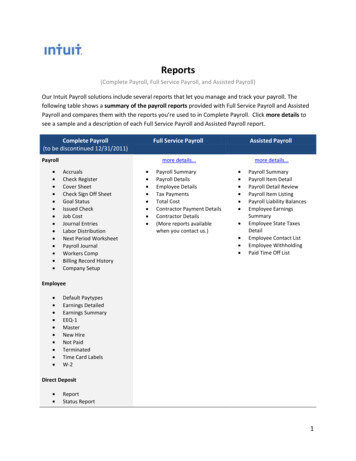
Full Understanding of Nutritional Labels is LowAs different labeling standards and regulations proliferate indifferent markets, some packaged-food producers have adoptedglobal practices, and some observers have called for internationalguidelines. But while nutritional labels are increasingly found onpackaged foods across the globe, a primary question is whetherconsumers understand the information in the first place.on food labels “mostly”, down from 44 percent in a 2008 Nielsenreport.Consumers in North America show the most confidence inunderstanding nutrition labels, as nearly six-in-ten (57%)regional respondents indicate that they mostly understand thedetails. This is largely driven by U.S. respondents, as consumersin the U.S. appear more comfortable with the labels thanCanadians. Fully 58 percent of U.S. respondents report mostlyunderstanding the information, compared to 49 percent ofCanadians.According to Nielsen’s study, nearly six-in-10 (59%) globalrespondents indicate they have difficulty grasping the nutritionalfacts, with 52 percent understanding the labels “in part”, andseven percent not understanding them at all. Forty-one percentof global respondents understand nutritional information foundHow well do you understand the nutritional information panels/labels on food packaging?GLOBAL AVERAGENORTH AMERICA7%7%36%52%41%ASIA PACIFIC8%61%57%48%31%46%6%44% 45%48%51%7%5%MIDDLE EAST/AFRICAEUROPEMostlySource: Nielsen Global Survey, Q1 2011Copyright 2011 The Nielsen Company.3In PartNot At AllLATIN AMERICA
Full Understanding of Nutritional Labels is LowThe Asia Pacific region shows the lowest percentage ofconsumers with a full understanding of nutrition labels, with lessthan one-third (31%) mostly comfortable with the information.Both globally and within the region, food label confusion ishighest in the Chinese-speaking world and other SoutheastAsian markets. Just around one-fifth of consumers in Taiwanand Hong Kong (20% and 21%, respectively) and one-quarter ofrespondents from China and South Korea (25% each) indicatethey mostly understand the nutritional labeling.As a whole, European consumers are largely split, with 45percent reporting a strong understanding of nutritional labels.But, consumers in certain markets within Europe are farmore comfortable with labeling than others. Sixty percent ofPortuguese respondents largely understand nutrition labels, thehighest reported country in the study. Similarly, at least half ofrespondents mostly understand food labels in Italy and Romania(59%), Poland (58%), Denmark and Ireland (53%), Sweden(51%), and Spain (50%).However, among Asia Pacific markets, reported understanding offood labels is much higher in India, Australia, and New Zealand,where over half of consumers say they mostly understandnutritional data—among the highest reported levels in the study.Within Europe, French consumers are the least likely tounderstand nutrition labels, with only three-in-10 (31%)indicating full comprehension of the information; 58 percent ofFrench respondents understand only part of the information and11 percent of French consumers say they do not understand themat all. Other markets in Europe with lower levels of nutritionallabel understanding include Czech Republic (where 39 percentmostly understand it, but 12 percent don’t understand it at all),Hungary, Belgium, Austria, and Russia.Asia Pacific consumers report the lowest levels ofunderstanding nutritional labels, especially in Greater Chinaand other Southeast Asian markets.Consumers from India, Australia, and New Zealand indicate amuch higher comfort level with the labels.How well do you understandthe nutritional informationpanels/labels on foodpackaging?MostlyIn PartNot atallTaiwan20%69%11%Hong Kong21%68%11%China25%68%7%South ia52%43%5%New Zealand51%41%8%In Latin America, over half of online respondents in Brazil (52%)and Mexico (51%) say they mostly understand nutritional labels,but in Argentina and Colombia, consumers are much less familiarwith the information. In Argentina, 45 percent of consumersunderstand most of the data—but 11 percent do not understandit at all. Only 33 percent of Colombian respondents report afirm grasp on what the labels mean, and 12 percent of theircompatriots do not understand them at all.Among the Middle East and African markets in the survey, SouthAfricans are the most confident dealing with nutritional labels,with over half (53%) largely familiar with reading the data.Saudi Arabian consumers are much less comfortable with foodlabels, as only 36 percent understand most of the information.In Egypt and the United Arab Emirates, slightly less than half ofconsumers (47% each) are confident in deciphering the data.Source: Nielsen Global Survey, Q1 2011Copyright 2012 The Nielsen Company.4
Consumers are Skeptical about Health ClaimsBeyond the detailed nutritional information often found in smallprint on the back of packaging, marketers often include larger,more prominently displayed health-related claims, such as “lowfat” or “all natural”, on the front of packaging to boast healthyingredients.The study finds that global respondents are largely skepticalabout the accuracy and believability of these health claims.Across 10 nutritional content categories studied, large majorities(at least over two-thirds) of global respondents in the surveyindicate they believe the nutritional claims are either never oronly sometimes trustworthy.Do you believe/trust that the following food labels claims on packages are accurate and truthful?Global AverageVITAMIN64%CONTENT28%FRESH15%17% 68%8%CALORIECONTENT33% 58%9%ALL NATURAL13%HEART- 67% 20%HEALTHYREAL FRUIT66% 18%14% 68% 18%71%16%IMPORTEDPROUDCTS16%14%63%23%FATSource: Nielsen Global Survey, Q1 2011Generally, the most simple and straightforward content claims(calorie counts, vitamin content, fat content) garner the mostconfidence. Calorie counts are the most trusted, with 33 percentof respondents believing calorie content claims as alwaysaccurate, and 58 percent finding them sometimes accurate. Theconcrete ingredient-based attributes of vitamin and fat contentare the second and third most trusted claims, respectively.Perhaps more challenging for marketers is the reported beliefconsumers indicate for more ambiguous, less-defined attributeslike freshness, all natural claims, and heart-healthy assertions.On average, only 15 percent of global respondents rate thesetypes of claims an “always accurate”. Upwards of 80 percent ofrespondents indicate either never or only sometimes consider512%NONARTIFICIAL19% 67%Copyright 2012 The Nielsen Company.ORGANIC13%63% 24%12%ALWAYSSOMETIMESNEVERthese assertions as believable.Overall, Latin American consumers indicate the most trust inpackaging health claims across the 10 nutritional and contentcategories surveyed, according to an average reported numberof consumers who believe the claims as always accurate. Bythis measure, an average of 22 percent of Latin American onlinerespondents found the claims always accurate or truthful—compared to a global average of 19 percent. Consumers from theMiddle East/Arica and Asia Pacific were the second most likelyto trust the labels, at an average 20 percent always believingthe claims, followed by consumers in Europe (19%), and NorthAmerica (16%).
Hearty Options Vary for a Healthy DietLocal tastes and cooking practices differ around the world,often defining the foods found in a shopping basket, but whenit comes to how frequently consumers say they purchase foodsthat promote specific health benefits, there are both markeddifferences and some similarities.How often do you purchase the following foods thatpromote specific health benefits?Global AverageNeverRarelyOccasionallyRegularlyWhole grain, high fiber products 35% 36% 17% 11%Yoghurts with Acidophiluscultures / probiotics 27% 36% 19% 18%Iodine enhanced cooking salt 34% 24% 19% 24%Cholesterol reducing oils and margarines 23% 33% 23% 21%Fermented drinks containing'good' bacteria 19% 34% 23% 24%Fruit juices with added supplements 19% 33% 24% 24%Bread with added calcium or other vitamins 17% 34% 23% 26%Most consumers around the world agree there are benefits toeating whole grain/high fiber foods to promote a healthy diet.More than one-third (35%) of global respondents say theypurchase whole grain/high fiber products on a regular basis, 36percent state they buy these foods occasionally and one-in-ten(11%) indicate that they never purchase these foods. Yogurtswith acidophilus cultures/probiotics are also popular among27 percent of regular and 36 percent of occasional shoppers. Infact, both of these foods appear in the top five of all the regionsstudied.However, differences by region reflect customs and traditionsunique to local palates. For example, while soy milk ranks fourthon the list of products purchased regularly and occasionally inAsia Pacific, it takes a position of last of 10 different healthbenefit foods studied in Europe, Middle East/Africa, LatinAmerica and second to last in North America. Similarly,cholesterol-reducing oils and margarines are more popularin Latin America (73%), Middle East/Africa (71%) and NorthAmerica (64%), where respondents say they purchase thesefoods regularly/occasionally.Fruit juices with added supplements are most popular in MiddleEast/Africa, as three-quarters of respondents (74%) indicatethey purchase these products regularly/occasionally. And breadwith added calcium or other vitamins is a regular/occasional pickamong roughly six in 10 consumers in Asia Pacific, Middle East/Africa and North America—compared with about half of LatinAmericans and one-fourth of Europeans.Milk with added supplements/vitamins 18% 29% 22% 31%Cereal with added folate 14% 31% 27% 28%Soy Milk 18% 25% 19% 38%Source: Nielsen Global Survey, Q3 2011Top 5 Health-Benefit Foods Purchased Regularly/OccasionallyAsia PacificEuropeLatin AmericaMiddleEast/AfricaNorth America1. Yoghurts withAcidophilusWhole Grain/High Fiber Whole Grain/High Fiber Fruit Juices withProductsProductsSupplementsWhole Grain/High FiberProducts2. Fermented DrinksIodine EnhancedCooking SaltCholesterol ReducingOils/MargarinesCholesterol ReducingOils/MargarinesCholesterol ReducingOils/Margarines3. Whole Grain/High Fiber Yoghurts withProductsAcidophilusYoghurts withAcidophilusWhole Grain/High Fiber Bread with AddedProductsCalcium/Vitamins4. Soy MilkCholesterol ReducingOils/MargarinesCereal with FolateIodine EnhancedCooking SaltFruit Juices withSupplements5. Bread with AddedCalcium/VitaminsFermented DrinksFruit Juices withSupplementsYoghurts withAcidophilusYoghurts withAcidophilusSource: Nielsen Global Survey, Q3 2011Copyright 2012 The Nielsen Company.6
Diners Want Calorie-Counting InformationConsumers around the world express strong support for theinclusion of calorie counts on restaurant menus. This belief ishighest for fast food restaurants, but there is also support for thispractice in certain full-service restaurants. Regionally, consumersin Latin America, North America, and Europe are most interestedin knowing calorie information while dining out.Support for calorie information on restaurant menus is highestfor fast food restaurants, with half (49%) of global respondentsbelieving fast food restaurants should always include calorieinformation on menus, and an additional 31 percent thinking fastfood locales should sometimes do so. By contrast, 20 percentof global online consumers think fast food menus should neverinclude calorie or nutritional data.Thinking about dining out, should restaurants includecalorie count and nutritional information on menus?More than six-in-ten (64%) Latin American respondents andover half of both North American (56%) and European (53%)consumers believe fast food menus should always have calorieinformation. In Asia Pacific markets, there is slightly lessdemand for fast food calorie counts, but 42 percent of regionalrespondents still believe these menus should include caloriemeasures. Respondents in the Middle East and Africa are slightlyless explicit in their beliefs about calories and fast food menus.Only 28 percent say calories should always be listed at fast foodestablishments and 55 percent believe the information shouldonly sometimes be on menus.Global Average20%31%49%ON FAST FOOD RESTAURANT MENUS20%39%41%ON SIT-DOWN DINING CHAIN-RETAURANT MENUS33% 31%35%Support for calorie and nutritional information on menus atfull-service chain restaurants is also quite strong, though lesspronounced than for fast food businesses. Globally, 41 percent ofonline respondents believe these restaurants should always postcalorie counts, 39 percent think they should sometimes, and 20percent don’t think it is necessary. While there is less of a globalconsensus for these sit-down chain restaurants, there are stillhigh percentages of consumers who think these establishmentsshould always disclose their calorie counts in Latin America(59%), North America (46%), and Europe (41%).Global consumers are much less convinced about whetherprivately-owned, non-chain restaurants should includecalorie and nutritional data on menus. For these independentrestaurants, 31 percent of global respondents would preferto always know calorie counts, but 33 percent think theseestablishments should never have to disclose these numbers.However, a still robust 40 percent of North Americanrespondents want these private restaurants to print caloricfigures. And, Latin American consumers remain resilient in theirdesire for nutritional data, with nearly six-in-ten (58%) stillalways wanting the information on independent restaurantmenus.Call to ActionON PRIVATELY-OWNED RESTAURANT MENUSALWAYSSOMETIMESSource: Nielsen Global Survey, Q1 2011Copyright 2012 The Nielsen Company.7NEVERConsumers around the world have healthy eating on theirminds and consumer packaged goods (CPG) marketers have anopportunity to help. Consumer-friendly nutritional labeling can bea powerful marketing tool as consumers are hungry for easy-tounderstand information. Clearly there is a need and an opportunityfor more education to help reduce the skepticism that is apparentaround all parts of the globe. And there is a need to offer tasty andhealthful options to satisfy both the mind and body.
Countries in the ChinaChileColombiaCroatiaCzech eceHong tviaLithuaniaMalaysiaMexicoNetherlandsNew About the NielsenGlobal SurveyAbout NielsenThe Nielsen Global Survey of FoodLabeling Trends was conducted in March/April 2011 and in August/September2011 and polled more than 25,000consumers in 56 countries throughoutAsia Pacific, Europe, Latin America, theMiddle East, Africa and North America.The sample has quotas based on ageand sex for each country based on theirInternet users, and is weighted to berepresentative of Internet consumersand has a maximum margin of error of 0.6%. This Nielsen survey is based onthe behavior of respondents with onlineaccess only. Internet penetration ratesvary by country. Nielsen uses a minimumreporting standard of 60 percent Internetpenetration or 10M online populationfor survey inclusion. The Nielsen GlobalSurvey, was established in 2005.Nielsen Holdings N.V. (NYSE: NLSN) isa global information and measurementcompany with leading market positionsin marketing and consumer information,television and other media measurement,online intelligence, mobile measurement,trade shows and related properties.Nielsen has a presence in approximately100 countries, with headquarters in NewYork, USA and Diemen, the Netherlands.For more information, visitwww.nielsen.com.For more information visit www.nielsen.comCopyright 2012 The Nielsen Company. All rights reserved. Nielsen and the Nielsen logo aretrademarks or registered trademarks of CZT/ACN Trademarks, L.L.C 11/0008RomaniaRussiaSaudi ArabiaSingaporeSouth AfricaSouth ted Arab EmiratesUnited KingdomUkraineUnited StatesVenezuelaVietnam
carbohydrate/high-fat diet (18%), which had more than doubled since 2008, following another diet plan (16%), or using a slimming program (7%). NORTH AMERICA 69% 78% 13% 5% 7% DOING PHYSICAL EXERCISE CHANGING MY DIET TAKING DIET PILLS / BARS / SHAKES TAKING MEDICINE PRE