Transcription
Economics of TransitionVolume 16(4) 2008, 769–797Understanding South Africa’seconomic puzzles*RodrikEconomicsECOT 0967-0750JournalOriginalXXXUnderstanding2008 ThecompilationArticlesofAuthorsTransitionSouth LtdAfrica’s2008 TheEconomicEuropeanPuzzlesBank for Reconstruction DevelopmentBlackwellOxford,UKPublishingDani RodrikJohn F. Kennedy School of Government, Harvard University, Cambridge, MA, USA. E-mail:dani rodrik@harvard.eduAbstractSouth Africa has undergone a remarkable transformation since its democratictransition in 1994, but economic growth and employment generation have beendisappointing. Most worryingly, unemployment is currently among the highest inthe world. While the proximate cause of high unemployment is that prevailingwages levels are too high, the deeper cause lies elsewhere, and is intimately connected to the inability of the South African to generate much growth momentumin the past decade. High unemployment and low growth are both ultimately theresult of the shrinkage of the non-mineral tradable sector since the early-1990s. Theweakness in particular of export-oriented manufacturing has deprived SouthAfrica of growth opportunities as well as of job creation at the relatively low endof the skill distribution. Econometric analysis identifies the decline in the relativeprofitability of manufacturing in the 1990s as the most important contributor to thelack of vitality in that sector.JEL classifications: 011, 014.Keywords: South Africa, transition, economic growth.Received: January 24, 2008; Acceptance: July 9, 2008* This article was prepared for the Harvard University Center for International Development Project onSouth Africa. The author has greatly benefited from the guidance and insights of Trevor Manuel, AlanHirsch, Lesetja Kganyago, and Ismail Momoniat. The author also thanks Johannes Fedderke, Dave Kaplan,Ben Smit and members of the ‘Harvard’ team for feedback on the ideas presented here. Oeindrila Dube andRobert Mitchell provided research assistance. 2008 The AuthorsJournal compilation 2008 The European Bank for Reconstruction and Development.Published by Blackwell Publishing Ltd, 9600 Garsington Road, Oxford OX4 2DQ, UK and 350 Main St, Malden, MA 02148, USA
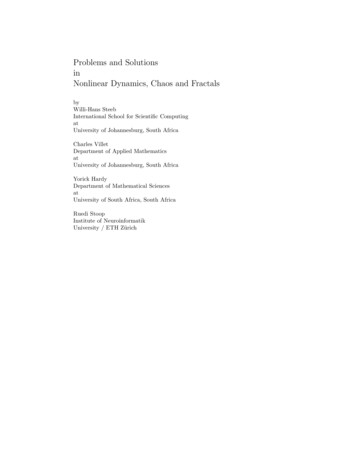
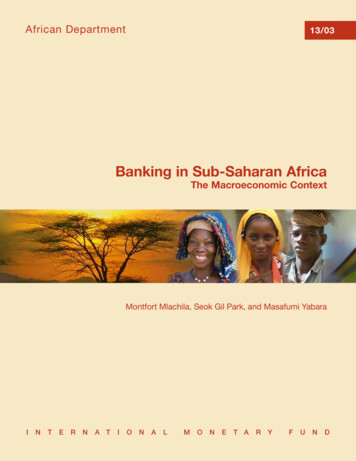
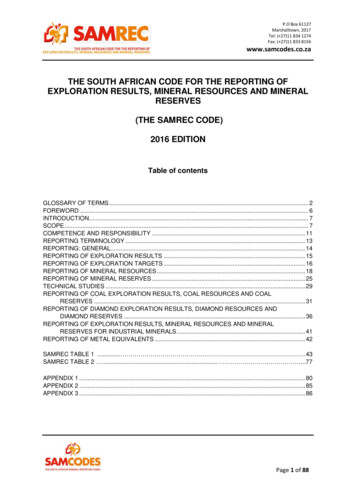
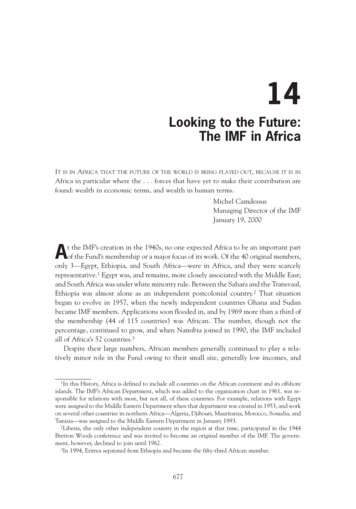
770Rodrik1. IntroductionThe transformation that South Africa has undergone since its democratic transitionin 1994 is nothing short of remarkable. Before 1994, the South African economy andpolity were dominated by the white minority, and even though the Apartheidregime had begun to unravel in the 1980s, the majority blacks remained deprivedof basic political and economic freedoms. Given the depth of the racial and incomedivides that prevailed, it would not have been unreasonable to predict a cycleof redistribution and macroeconomic populism after democratization, wreakinghavoc with the economy and turning the country into a sham democracy.Instead, the democratically elected governments led by the African NationalCongress (ANC) have managed to create a stable, peaceful and racially balancedpolitical regime with an exemplary record of civil liberties and political freedoms.Economic policy has been conducted in an equally exemplary manner, with SouthAfrica turning itself into one of the emerging markets with the lowest risk spreads.While South Africa has instituted some innovative (and expensive) social transferprograms to address long-standing disparities, it has done so in the context ofcautious fiscal and monetary policies which have kept inflation and public debt atlow levels. There were no nationalizations or large-scale asset redistributions.Moreover, the economy was opened to international trade and capital flows.1If the world were fair, political restraint and economic rectitude of this magnitudewould have produced a booming South African economy operating at or near fullemployment. Unfortunately, it has not turned out that way. In the decade since1994, per capita GDP grew at an average rate of 1.2 percent per annum – a rate thatis comparable to that of sub-Saharan Africa (1.1 percent) and Latin America(0.8 percent), and considerably below that of South Asia (3.7 percent) and East Asia(6.2 percent). As Figure 1 shows, South Africa’s income level has yet to catch upwith its peak level attained in 1980. And investment remains low at around 17percent of GDP (although the bulk of the overall decline in the investment effortsince the 1970s is due to the reduction in public investment).The most worrying aspect of this disappointing economic performance isunemployment. South Africa’s unemployment rate today stands at 26 percentaccording to the narrower definition of who is unemployed, and at 40 percent ifone includes discouraged workers (Banerjee et al., 2006). This is one of the highestrates of unemployment anywhere in the world (see Figure 2 for some internationalcomparisons). Furthermore, unemployment appears to have increased particularlyrapidly since the democratic transition (from a ‘low’ of 13 percent in 1993). (The1Hirsch (2005) for an excellent account by an insider. Other perspectives on South African growth performance include Fedderke (2002), Hartzenberg and Stuart (2002), and du Plessis and Smit (2006). Two recentcollections, with very different perspectives on economic growth, are Nowak and Ricci (2005) and Pollinet al. (2006). 2008 The AuthorsJournal compilation 2008 The European Bank for Reconstruction and Development
Understanding South Africa’s Economic PuzzlesFigure 1. Investment and growthSource: World Bank, World Development Indicators Database.Figure 2. Unemployment rates (c. 2002)Source: Same as Figure 1. 2008 The AuthorsJournal compilation 2008 The European Bank for Reconstruction and Development771
772Rodriklack of labour force surveys makes it difficult to know what the comparable unemployment rates were in the 1980s.) As would be expected, unemployment is heavilyconcentrated among the young, unskilled, and the black population. This poor recordon employment represents not only an economic tragedy, it poses a significantthreat to the stability and eventual health of the South African democracy.The proximate cause of high unemployment is that prevailing South Africanwages are too high compared to real wage levels that would clear labour marketsat lower levels of unemployment. Trade unions and wage bargaining play animportant role in wage determination in South Africa. The trade union confederationCongress of South African Trade Unions (COSATU) is a partner in the governingcoalition dominated by the ANC. A cursory comparison of wages across countrieswould show that South African wages (in the formal sector) are quite high by thestandards of countries at similar income levels. On the other hand, real wages havenot risen much (if at all) since the transition to democracy (Leibbrandt et al., 2005),and to the extent that unions have prevailed, it seems to have been mostly toprevent the real wages of their members from falling (Banerjee et al., 2006). Theevidence that I will show later in this article, suggests that wage-push has not beena significant factor in determining patterns of structural change in the South Africaneconomy during the 1990s.The deeper cause of South African unemployment lies elsewhere, and it isintimately connected to the inability of the South African economy to generatemuch growth momentum in the past decade. High unemployment and low growthare both ultimately the result of the shrinkage of the non-mineral tradable sectorsince the early-1990s. The weakness in particular of export-oriented manufacturinghas deprived South Africa from growth opportunities that other countries havebeen able to avail themselves of. The point is perhaps best made by comparingSouth Africa to a high-growth economy such as Malaysia, a country with whichSouth Africa shared many common features in the 1980s. As I will show in the nextsection, the main difference between these two countries is that Malaysia was ableto pull an increasing share of its workforce into manufacturing (the sector with thehighest labour productivity in the economy) while in South Africa manufacturinglost ground to the tertiary sector.The reason that this pattern of structural change is also a key driver of unemployment is that in South Africa non-mineral tradables (including manufacturing) areintensive in low-skilled labour compared to services. The relative shrinkage ofmanufacturing (along with economy-wide skill upgrading) has entailed a collapsein demand for relatively unskilled workers. This need not have turned into agrowing unemployment problem among the unskilled if one or both of two thingscould have happened. First, a large enough decline in real wages at the low end ofthe skill distribution could have compensated for the inward shift of the labourdemand schedule. But this was an unrealistic option in view of the social expectationsand political realities created by the democratic transition. Second, the growingmass of job seekers could have been absorbed into the informal sector (where 2008 The AuthorsJournal compilation 2008 The European Bank for Reconstruction and Development
Understanding South Africa’s Economic Puzzles773wages and work conditions are considerably more flexible). This second mechanismis how developing countries elsewhere have coped with similar labour marketproblems. But while informal employment has grown rapidly in South Africa, itslevel remains quite low by the standards of developing countries (see Table 2 innext section). This is no doubt one of the legacies of the Apartheid regime – whichmade it first illegal and then difficult for blacks to move to larger urban areasunless they already had a certified job. In the absence of sufficient real wage adjustment and informal sector growth, the decline in the demand for low-skilled workershas resulted in high unemployment.2A key implication follows from this diagnosis: expansion of non-mineral tradables,manufacturing in particular, will be good both for growth and employment. Anexport-oriented strategy that increases the relative profitability of producing tradables for world markets will generate economic growth by pulling labour intoproductive activities where their marginal product is much higher. And sincetradables are relatively low-skill intensive in South Africa compared to serviceactivities that have been the major beneficiary of recent patterns of structuralchange, such a strategy will entail shared growth rather than trickle-down growth.The cures for low growth and high unemployment are largely one and the same.The plan of this article is as follows. In Section 2, a brief comparison withMalaysia to underscore the central role played by export-oriented manufacturingin Malaysia’s growth performance is provided. Section 3 focuses on employmentand examines the patterns of structural change that account for the decline in thedemand for labour (especially low-skilled labour). In Section 4, an econometricanalysis of the patterns of structural change to better pinpoint their sources isprovided. The econometrics identifies the decline in the relative profitability ofmanufacturing in the 1990s as the most important contributor to the lack of vitalityin that sector. Section 5 sets out my conclusions.2. Why is South Africa not Malaysia?The title of this section is not as crazy as it may sound at first. South Africa andMalaysia are both medium-sized economies with deep racial cleavages, in which anethnic majority controls the polity but economic power lies with an ethnic minority.Table 1 shows some comparisons using the Hall and Jones (1999) database for 1988.As the table reveals, the economic structures of the two economies were strikinglysimilar at that time. Output per head and TFP were virtually identical – roughly at2One needs to add the impact of rising female labour participation in the 1990s as well (Leibbrandt et al.,2005). Overall labour force participation still seems low in South Africa, however, by international benchmarks. 2008 The AuthorsJournal compilation 2008 The European Bank for Reconstruction and Development
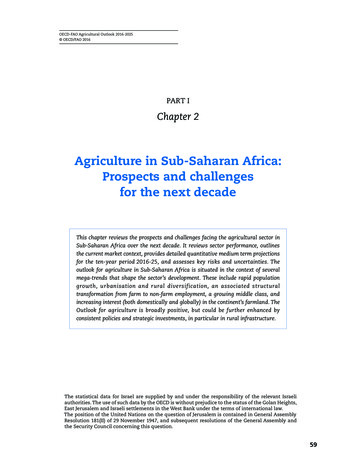
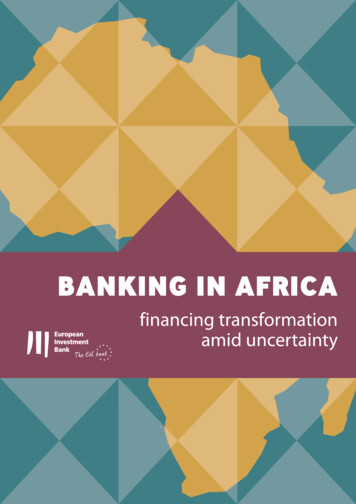
774RodrikTable 1. A snapshot in 1988 (US 1)ZAFMYSY/L(K/Y)aH/LAMining share of Source: Hall and Jones (1999).Table 2. Comparative statistics on informalitySouth AfricaOther sub-Saharan AfricaLatin AmericaAsiaUrban unemploymentrate (1990s)Informal employment (as a shareof non-agricultural employment)29.316.08.15.318.974.856.963.0Source: Charmes (2000) via Kingdon and Knight (2004).a quarter and a half of the US level, respectively. Human capital levels were alsoquite close. And both economies had a similar dependence on mining.But this snapshot hides important differences in the evolution of the structureof the two economies. Most importantly, Malaysia was undergoing a process ofindustrialization, while South Africa had begun to de-industrialize. Figure 3, whichshows the trends in the share of the labour force employed in manufacturing in thetwo economies, tells a striking story. As of the mid-1980s, South Africa still had alarger manufacturing base: Roughly 12 percent of its total labour force wasemployed in manufacturing, compared to 8 percent in Malaysia. But since then,Malaysia has industrialized by leaps and bounds, with this number reaching 16percent a decade later. In South Africa, by contrast, the proportion of the workforceemployed in manufacturing has come steadily down, to below 7 percent by2000. What is also remarkable in Malaysia’s experience is that this pick-up inindustrialization came after a period of what looked like a continuous decline inmanufacturing in the early 1980s. The latter suggests that it is possible to reverse atrend deterioration in manufacturing performance, provided the policy frameworkis adequate (on which more later).The expansion of manufacturing in Malaysia has been both growth and equitypromoting. It has been good for growth because, as Figure 4 shows, manufacturingis the sector where labour is the most productive by far. Even if the productivitydifferences are smaller at the margin than on average, there are still largeunexploited gains from moving labour into manufacturing from other activities. 2008 The AuthorsJournal compilation 2008 The European Bank for Reconstruction and Development
Understanding South Africa’s Economic Puzzles775Figure 3. Manufacturing employment (as share of labour force)Source: Same as Figure 1.And it was equity promoting because many of the gains from this process ofstructural change accrued to the workers themselves.If the South African economic structure moved in the opposite direction, it isnot because manufacturing did not enjoy similar advantages in South Africa. WhileSouth African manufacturing appears not as productive as that of Malaysia, it stillremains more productive than South African services (Figure 4). Why South Africade-industrialized prematurely is therefore an important question, and one that willbe analyzed econometrically in Section 4.Manufactures are the quintessential tradables, and the different roads travelledby the two economies are perhaps most evident in their trade performance. Onceagain, the two economies started out in roughly similar positions. Around themid-1970s, the share of manufactured exports in GDP stood at around 6–7 percentin both countries. By 2004, this figure had increased to more than 80 percent inMalaysia, but only to 12 percent in South Africa. And as Malaysia developed itsmanufacturing base, it caught up with and surpassed South Africa in terms of the‘sophistication’ of its export basket (Figure 5). 2008 The AuthorsJournal compilation 2008 The European Bank for Reconstruction and Development
776RodrikFigure 4. ZAF–MYS comparisons (2004)Source: Same as Figure 1.Figure 5. Income level of exports (EXPY)Source: Hausmann et al. (2006). 2008 The AuthorsJournal compilation 2008 The European Bank for Reconstruction and Development
Understanding South Africa’s Economic Puzzles777Box 1. Malaysian policies to promote manufacturing Early 1970s: Export processing zones combined with restrictions on unionism to attractMNEs Early 1980s: heavy industrialization strategy focusing on trade protection, bumiputeraownership, and public enterprise Recession in mid-1980s, followed by privatization Late 1980s: trade liberalization plus substantial incentives to investment and exports(including on ‘priority products’) Very little rise in skill intensity, even though manufacturing takes off Early 1990s: Focus on training and skills Incentives increasingly tied to domestic sourcing of inputsThere are of course a multitude of reasons that account for the different pathstaken by the two economies. Malaysia was in a different neighbourhood, one thatwas considerably friendlier to an export-oriented strategy. South Africa had tocontend with the debilitating effects of the trade embargo it faced in world marketsin the 1980s and its heavy spending on defence industries for the purpose ofpropping up the Apartheid regime. But one should not minimize the active roleplayed by government to promote manufacturing (and manufactured exports) inMalaysia. Even though industrial policies went through various phases (for asummary, see Box 1), expanding and diversifying the industrial base of the economyremained an unwavering goal. Policies employed a mix of market signals anddirect incentives through tax, trade, and labour-market interventions. Some of theindustries spawned by these interventions have been failures (such as the nationalauto manufacturer, Proton, launched in the early to mid-1980s), but the successes(in electronics, for example) have been more than adequate to pay for these failures.Malaysia’s experience is in line with that of other successful industrializers. Theproductive diversification that economic growth requires is not an automatic processthat well-functioning markets generate on their own; it requires an experimental,nurturing approach by the government in strategic collaboration with the privatesector (Hausmann and Rodrik, 2003; Rodrik, 2004).3. Patterns of employment and structural change in South AfricaFormal employment in South Africa has stagnated during the 1990s, despite thepick-up in economic growth since 1994 and the increase in labour force participationassociated with democratization and the end of the Apartheid era (Figure 6). 2008 The AuthorsJournal compilation 2008 The European Bank for Reconstruction and Development
778RodrikFigure 6. Total employment, by skill categorySource: Quantec (http://www.quantec.co.za/data).Semi-skilled and low-skilled workers still constitute around 42 percent of thoseemployed in the formal sector.3The constancy of overall employment masks a tremendous structural changethat has taken place within the economy over the last two decades or so. This can beseen in Figure 7, where I show the shares in total employment of three different typesof economic activities: tradable activities (mining, agriculture, and manufacturing);private non-tradable activities (financial services, construction, trade, retail, transport,and other services); and public non-tradable activities (utilities and governmentservices). The figure shows a dramatic increase in the employment share of privatenon-tradables at the expense of tradables. The latter have come down from morethan 40 percent of employment in the late-1970s to around 30 percent currently.What this reflects is a decline in agricultural and mining employment which hasnot been compensated by an increase in manufacturing employment. Amongexpanding sectors, financial intermediation, insurance, real estate and businessservices (F.I.R.E., SIC 8) have been particularly notable. That sector now employsas many workers as all of manufacturing taken together (around 15 percent of totalformal employment).3All data in this section, including the classification of workers by skill category come from the Quantecdatabase, accessed through the TIPS (Trade and Industrial Policy Secretariat) website. 2008 The AuthorsJournal compilation 2008 The European Bank for Reconstruction and Development
Understanding South Africa’s Economic PuzzlesFigure 7. Employment shares: all skill categoriesSource: Same as Figure 6.Figure 8. Low-skill intensity by sectors: Shares of low-skilled andunskilled workers in sectoral employmentSource: Same as Figure 6. 2008 The AuthorsJournal compilation 2008 The European Bank for Reconstruction and Development779
780RodrikThis pattern of structural change implies a significant decline in the relativedemand for low-skilled labour because the declining sectors constitute the leastskill intensive parts of the South African economy. The skill intensity of the threesectors is shown in Figure 8, which displays the shares of low-skilled and unskilledworkers in sectoral employment. First, what is evident in the graph is that therehas been across-the-board skill upgrading in the economy, with the low-skilledshare falling in all three sectors. Second, and more importantly, tradable sectorsremain the most low-skilled intensive part of the economy by far. As late as 2004,more than 70 percent of workers employed in tradable industries were classifiedas ‘low-skilled and unskilled’ workers. The corresponding figure in private nontradables was only 25 percent. Even if we exclude mining and agriculture fromtradables and focus on manufactures, there remains a big gap: slightly 60 percentof workers employed in manufacturing in 2004 were classified as low-skilled andunskilled.The negative relationship between low skill intensity and employment growthshows up also at finer levels of disaggregation. Figure 9 shows the pattern ofstructural change within manufacturing. The simple correlation between the initialshare of semi-skilled and unskilled workers and the subsequent increase inemployment for the 28 subsectors within manufacturing is 0.41.This pattern of structural change helps explain the persistent concern in SouthAfrican business and policy circles with a ‘skills shortage’. The view that skills actas a significant constraint on economic growth is widely held, and is reflected inthe government’s official policy document on the Accelerated and Shared GrowthInitiative for South Africa (ASGI-SA). It is natural that a pattern of growth that has(thus far) emphasized the expansion of skill intensive tertiary sectors at theexpense of low-skill intensive tradable sectors puts a premium on skills and humancapital. On the other hand, if it is true, as I have argued, that higher levels ofgrowth and employment creation require a different pattern of structural change –an expansion of low-skilled intensive manufactures at the expense of skill-intensivenon-tradables – skills can no longer be viewed as a serious constraint on futuregrowth. In view of the patterns of skill intensity discussed earlier, manufactures-ledgrowth would on balance reduce the relative demand for skilled workers.A final trend worth emphasizing is capital deepening. The process of substitutingcapital for labour has been particularly marked in tradable activities (includingmanufacturing). Interestingly, this trend is confined to tradables: capital–labourratios have remained more or less constant within the (private) non-tradable sector(Figure 10). The result is that tradable activities now employ considerably highercapital per worker than non-tradable activities.To sum up, we have identified three important trends in the economy whichtogether have put a significant damper on the demand for low-skilled workers inSouth Africa. First, there has been substitution towards skilled workers within eacheconomic activity. Second, there has been significant structural change away fromthe most low-skill intensive parts of the economy, namely tradables. Third, within 2008 The AuthorsJournal compilation 2008 The European Bank for Reconstruction and Development
Understanding South Africa’s Economic PuzzlesFigure 9. Change in employment versus initial skill intensity, bymanufacturing subsectors, 1970–2004 (annual average percent changes)Source: Same as Figure 6.Figure 10. Real capital per worker (million Rands in 2000 prices)Source: Same as Figure 6. 2008 The AuthorsJournal compilation 2008 The European Bank for Reconstruction and Development781
782Rodriktradables, production techniques have become progressively more capital intensive. The first and third of these trends probably have a lot to do with ongoingpatterns of technological change. Skill-biased technological change, in particular,has been a common feature of all open economies during the last two decades orso. But the reasons for the second trend are unclear, and since the structural shiftagainst tradables relates closely to the determinants of growth in South Africa,these reasons will be analyzed in the next section of the paper.These shifts in the demand for labour (particularly low-skilled labour) make iteasier to understand why unemployment has trended-up and is so high in SouthAfrica. Of course, rising unemployment could perhaps have been avoided by acommensurate decline in real wages for low-skilled workers. But this would havebeen a political impossibility in view of the democratic transformation in SouthAfrica and the role played by unions in the anti-Apartheid struggle and the newdemocratic government. That is not to say that unemployment is itself withoutpolitical cost. But the relatively generous social grants put in place by the democratic government have apparently taken the edge off what would have otherwisebeen a very serious social problem. There is some evidence that households viewpaid employment and social grants as substitutes at the margin. For example,households that lose a pension-eligible member subsequently report increasedlabour force participation (Ranchod, 2006, as reported in Banerjee et al., 2006; seealso Bertrand et al., 2003).As discussed in the introduction, unemployment on the scale experienced bySouth Africa could also have been avoided if young, unskilled job seekers could beabsorbed into the informal sector. The informal sector is the employer of last resortin most developing countries with institutionalized formal labour markets. Butwhile informal employment has grown quite rapidly in South Africa, informalitystill does not present the large footprint one would have expected it to have. Informal employment (as a share of total non-agricultural employment) remains a fraction of what it is elsewhere in Africa, Latin America and Asia (see Table 2).The reasons why informality does not play a larger role in absorbing surpluslabour remain unclear. One obvious candidate is the legacy of the Apartheidregime (and its pass laws in particular), which confined blacks who did not alreadyhave jobs to separate townships and prevented the unemployed from migratinginto urban areas. Restrictive zoning and licensing regulations and periodic ‘slumclearance’ efforts undermined fledgling informal activities. Even though the passlaws themselves were repealed in 1986 and democracy itself is more than a decadeold, it is possible that this history delayed the creation of the social and othernetworks needed to maintain large-scale informality. Another possibility is theprevalence of high levels of crime, which acts as a particularly onerous tax onsmall-scale enterprises (Stone, forthcoming). Finally, the existing system of socialgrants presumably sets a higher reservation wage level in South Africa than incomparable countries, acting as a deterrent to low-productivity informal activities(such as street peddling). 2008 The AuthorsJournal compilation 2008 The European Bank for Reconstruction and Development
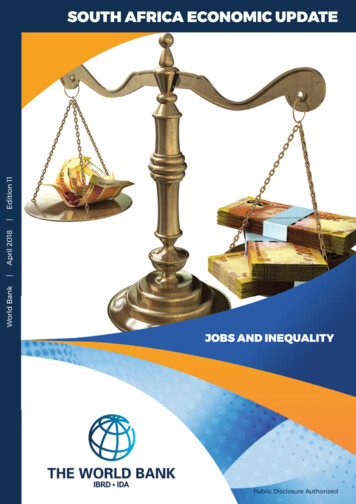
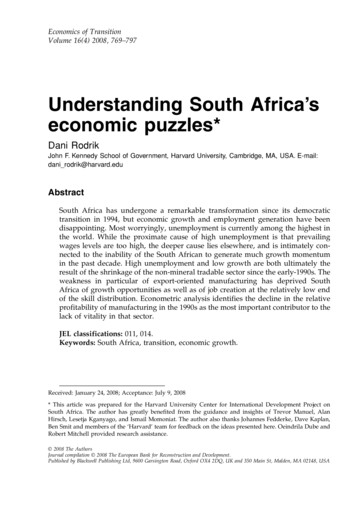
Understanding South Africa’s Economic Puzzles783Figure 11. Manufacturing employment and relative output pricesSource: Same as Figure 6.4. Explaining patterns of structural changeIn this section, I present an analysis of the determinants of recent patterns of structuralchange in South Africa, paying particular attention to the manufacturing sector. Asexplained earlier, the health of the manufacturing sector is vital to both growth andemployment creation in South Africa. Understanding the lack of dynamism of thissector is therefore key to designing appropriate growth policies.Formal employment in manufacturing has declined from 1.6 million in 1990 to1.2 million in 2004. The fall in semi-skilled and unskilled employment, from 1.0million to 0.7 million, accounts for the bulk of this decline. What is the reason forthis adverse trend? Figures 11–14 display some of the candidate explanations.First, there has been an apparent fall in the relative price of manufacturingsector output. Figure 11 charts the relative price (value-added price index ofmanufacturing divided by the GDP deflator) and shows that it tracks the behaviourof manufacturing employment since the late 1970s quite well. The decline in therelative price of manufacturing is of the order of 15 percent (if the GDP deflator isused as the denominator) and 50 percent (if the price of the F.I.R.E. sector [SIC 8]is used as the denominator). When relative prices are adjusted by sectoral TFP 2008 The AuthorsJournal compilation 2008 The European Bank for Reconstruction and Development
784RodrikFigure 12. TFP-adjusted relative prices of manufacturingSource: Same as Figure 6.growth (on the logic that a decline in output price can be offset by an increase inproductivity), the relative profitability of manufacturing exhibits a decline of theorder of 30 percent (Figure 12).Second, the South African economy is now considerably more open to internationaltrade and the manufacturing sector presumably faces much greater competitivediscipline, regardless of whether firms are import-competing or export-oriented.Edwards and Lawrence (2006) report a drop in the import-weighted ef
economic puzzles* Dani Rodrik John F. Kennedy School of Government, Harvard University, Cambridge, MA, USA. E-mail: dani_rodrik@harvard.edu Abstract South Africa has undergone a remarkable transformation since its democratic transition in 1994, but economic