Transcription
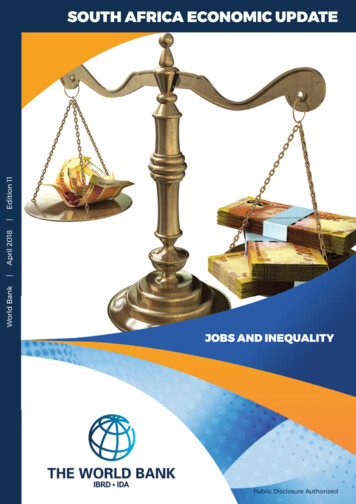
World Bank April 2018 Edition 11SOUTH AFRICA ECONOMIC UPDATEJOBS AND INEQUALITYPublic Disclosure Authorized
2018 The International Bank for Reconstruction and Development/THE WORLD BANK1818 H Street NWWashington, DC 20433USAAll rights reservedPhotos: Flickr, Pexels, Shutterstock and World Bank.
CONTENTSContents iAcknowledgmentsForewordiiiivAbbreviations vExecutive SummaryviCHAPTER 1CHAPTER 2Recent Economic Developments1Jobs and Inequality2Global Economic DevelopmentsSouth Africa Remains Trapped in a Cycle of HighReal Sector Developments in South Africa6Labor Market Developments in South AfricaReferences121624Creating More and Better Jobs to ReduceIncome InequalitiesInflation and Monetary Policy in South AfricaThe Outlook for South AfricaInequality and Slow Job Creation14Fiscal Developments in South AfricaThe External Sector in South Africa23Conclusion3648171949Annex: Modeling Prospective Policy Scenarios51FIGURES2Figure 1.1:Global activity indicatorsFigure 1.2:Global financial indicatorsFigure 1.3:StasSA's GDP revisions - fourth versus third quarter 2017 releases 7Figure 1.4:Commodity price forecasts 9Figure 1.5:Historical decomposition of domestic outputFigure 1.6:GDP by expenditureFigure 1.7:Gross fixed capital formation and business confidenceFigure 1.8:Labor market developmentsFigure 1.9:Changes in fiscal revenue and expenditure, 2018-2021 153101113Figure 1.10: Debt-to-GDP ratio with contingent liability scenariosFigure 1.11: Current account components121617Figure 1.12: Potential and actual per capita GDP, history and forecastsContents21 South Africa Economic Update 11 i
Figure 1.13: Growth projections for South Africa and other EMDEsFigure 2.1:Inequalities in 101 countries, 2013212526Figure 2.2: South Africa’s polarizationFigure 2.3: South Africa's human opportunities, 2015Figure 2.4: Inequality measurement over time2828Figure 2.5: Labor market status and skills increasingly contribute to inequalityFigure 2.6: Sectors' labor and skills intensityFigure 2.7:Jobs, poverty, and inequality293031Figure 2.8: Deciles’ labor incomes shares, 2015 and 2030, baseline scenario40Figure 2.9: Relative impacts of selected interventions on poverty, inequality, and GDP growthFigure 2.10: Contributions to change in inequality with respect to the baseline scenario4547TABLESTable 1.1: GDP growth (supply side)8Table 1.2: Baseline annual growth forecasts 22Table 2.1: Intergenerational social mobility27Table 2.2: Mean hourly wages in by education, purchasing power parityTable 2.3: Progress toward the Vision 2030 in different scenariosTable 2.4: Labor market indicators in 2030 in different scenarios294646Table 2.5: Selected macroeconomic indicators in 2030 in different scenarios47BOXESBox 1.1: The impact of global monetary conditions on South Africa5Box 1.2: The exchange rate and South Africa’s integration into the global economyBox 2.1: Building assets for the poor through the pension system1832Box 2.2: Inequalities and political rights demand larger governments in Sub-Saharan Africa33Box 2.3: Education flows and the distribution of skilled labor incomes across household decilesii South Africa Economic Update 11 Contents39
ACKNOWLEDGEMENTSThe 11th edition of the South Africa Economic Update was produced by a World Bank team comprising MarekHanusch, Precious Zikhali, Victor Sulla, Vincent Dadam, Gerard Kambou, David Stephan, Charl Jooste, MokgaboMolibeli and Zandile Ratshitanga, led by Sébastien Dessus. It was internally peer reviewed by Dino Merotto (LeadEconomist, Jobs Groups) and Maurizio Bussolo (Lead Economist, Eastern and Central Asia Chief Economist Office).It benefited from comments from Konstantin Makrelov (Chief Director, National Treasury), Duncan Pieterse (ChiefDirector, National Treasury) and overall guidance from Mathew Verghis (Practice Manager, Macroeconomics,Trade and Investment) and Paul Noumba Um (Country Director for South Africa).Chapter 2 draws heavily on two World Bank reports. The first report, the Poverty and Inequality Assessment,was conducted in collaboration with Statistics South Africa and the Department of Planning, Monitoring, andEvaluation. It comprehensively reviews the trends and determinants of poverty and inequality in South Africafor the first time since 1996, with a strong focus on the role of labor markets. The second report, the forthcomingSystematic Country Diagnostic, was developed in deep consultation with several government counterparts,including the National Planning Commission and the National Treasury. It aims to selectively identify themost binding constraints to poverty alleviation and inequality reduction, and how to lift these through publicintervention.The report was edited by Clarity Editorial and designed by Cybil Maradza.Acknowledgements South Africa Economic Update 11 iii
FOREWORDI am pleased to launch this 11th edition of the South Africa EconomicUpdate, which offers a review of the country’s recent economic andsocial developments and its outlook in the context of global economicprospects.Since the previous Economic Update of September 2017, a numberof important events have improved South Africa’s economic outlook.The smooth transition in power, the authorities’ reaffirmed adherenceto good governance and fiscal consolidation, and an upward revisionin national accounts are all contributing to strengthen citizens andbusiness confidence in South Africa’s future. These recent developments,combined with the strong rebound in the world economy, provide SouthAfrica now with a unique opportunity to progress towards its NationalDevelopment Plan’s goals of eradicating poverty and reducing inequalityby 2030. Most observers, including the World Bank, have been revisingtheir growth projections for 2018 and 2019 upwards.But deep challenges remain. This Update reviews the evolution and nature of South Africa’s inequality – the highestin the world– arguing that it has increasingly been driven by labor market developments that demand skills thecountry’s poor currently lack. Since democracy, social assistance and fiscal redistribution have more generally playeda fundamental role in containing the rise in inequality. But the slow growth that generates a mismatch betweenlabor demand and supply makes fiscal redistribution alone grossly insufficient to address the country’s inequalities.Solutions to break out of the mutually reinforcing cycle of low growth and high inequality lie in taking bold actions togiving poor South Africans better access to good jobs. Simulations done in this Update suggest that increasing theskilled labor supply among poor households (through improved education and spatial integration) and labor demand(mainly through strengthened competition) could bring the number of poor people in South Africa down from morethan 10 million today to 4 million by 2030. In doing so, the country would strengthen its social contract, where thepolitical rights gained with democracy are met with people sharing in the nation’s wealth.This Update builds on our solid partnerships with the National Treasury, Statistics South Africa, the National PlanningCommission, and the Department of Planning, Monitoring, and Evaluation. As the World Bank, we stand ready to workwith all stakeholders and support South Africa to fulfill its development agenda and contribute to ending extremepoverty and promoting shared prosperity. It is our hope that the country will continue to use the World Bank’sknowledge, global experience, and convening power as a platform for peer-to-peer learning to identify evidencedbased, pragmatic solutions that can contribute towards achieving the National Development Plan’s goals.Paul Noumba UmWorld Bank Country Director for South Africaiv South Africa Economic Update 11 Foreword
ABBREVIATIONSEMDEsGDPOECDPMIRSACUStatsSASME Emerging markets and developing economiesGross domestic productOrganisation for Economic Co-operation and DevelopmentPurchasing Managers’ IndexSouth African randSouthern African Customs UnionStatistics South AfricaSmall and medium-sized enterpriseUnited States dollarAbbreviations South Africa Economic Update 11 v
EXECUTIVESUMMARYvi South Africa Economic Update 11 Executive Summary
South Africa’s economic outlook has improved. A rise inconfidence in early 2018 and the recent upward revision ofnational accounts for the period 2015 to 2017 suggest thatthe country is recovering from a difficult 2015 and 2016,which marked the end of the super-commodity cycle andsevere drought. Gross domestic product (GDP) growth isprojected to gather pace, increasing from 1.3 percent in2017 to 1.4 percent in 2018, 1.8 percent in 2019, and 1.9percent in 2020. This in turn would contribute to a broaderrebound among commodity exporters, emerging marketsand developing economies, and overall global growth.Although it provides little space for fiscal stimulus, the2018 Budget Review’s reaffirmation of the government’scommitment to debt stabilization objectives is expectedto generate more private investment.But South Africa remains constrained by its low growthpotential. Slow private investment growth and weakintegration into global value chains prevent thecountry from reaping the new economic opportunitiesemerging around the globe, and from catching upwith living standards in peer economies. South Africaneeds to build on its comparative advantages, thatof an industrial skilled economy, to develop newdomestic and international markets through higherproductivity and innovation. At this condition willSouth Africa reduce its high dependency on commodityprice movements, which do not look favorable for thecountry in the medium term.Building on two World Bank reports – the Povertyand Inequality Assessment and the forthcomingSystematic Country Diagnostic – this 11th editionof the South Africa Economic Update argues thatsignificantly raising South Africa’s economic potentialwill require breaking away from the equilibrium oflow growth and high inequality in which the countryhas been trapped for decades. In this equilibrium,slow growth and high inequality reinforce eachother: inequality fuels the contestation of resources(through taxation, expropriation, corruption andcrime), which discourages the investment needed toaccelerate job creation and reduce inequality. Fiscalredistribution through social assistance, while sizeableand effectively targeted, has been unable to redressthe rise in inequality since 1994, and is increasinglyconstrained by narrowing fiscal space. Solutions areneeded to foster inclusive growth, which in practicemeans improving the poor’s access to good jobs sothey can fully participate in the economy. A crediblepath to sustainably redress inequalities is needed toreduce policy uncertainty and strengthen the socialcompact on which authorities plan to build consensuswith business, labor, and civil society.A silver lining in this very challenging social, politicaland economic environment is the evolving nature ofinequality in South Africa, on which policy interventionscould further build. Previously, inequality was largelydetermined by race and geographical origin (reflectingthe country’s legacy of exclusion). While race remainsa central determinant of inequality, income inequalityis now increasingly being determined by jobs status:employed versus unemployed, skilled versus unskilled.Since 1995, wage inequality has risen sharply, reflectinga severe mismatch between a labor market thatdemands skills and a labor force that is not fully ableto respond to such demand, as mostly unskilled andoften located far away from economics centers. Thisis concerning as it maintains inequality at such highlevels that fiscal redistribution alone cannot reduce.But it is also a trend against which citizens and thegovernment can now act more forcefully throughefforts and policy initiatives, as opposed to intangiblefactors like race. As a matter of fact, World Bankpoverty projections indicate that progress in accessto education since democracy is paying off: by 2030,inequality should be back down to its 1994 level, andSouth Africa should count 8.3 million poor people (at 1.90 a day), down from almost 10.5 million in 2017.But the number of poor people could be broughtdown further, to 4 million by 2030, through selectedpolicy interventions. They include, in the short term,continuing to address corruption, getting free highereducation right, restoring policy certainty in mining,improving the competitiveness of strategic stateowned enterprises, further exposing South Africa’slarge conglomerates to foreign competition, andfacilitating skilled immigration. And, in the longer term,improving the quality of basic education delivered tostudents from poor backgrounds and reinforcing thespatial integration between economic hubs, where jobsare located, and underserviced informal settlements.The first set of reforms would raise labor demand andcreate the fiscal space needed to eventually build laborsupply from the poor population through educationand spatial integration. The analysis in this reportsuggests that these reforms would reinforce eachother to generate significant positive effects on growth,inequality, and poverty overall. And as inequalitiesdecline, the social contract would strengthen and likelyencourage further private investment – a possibilitynot captured in our projections.Constructing this new South Africa will take time, andmanaging expectations will remain a challenge in acountry where strong political rights combine withhigh inequality to demand rapid transformation. Inthis regard, continued efforts to effectively redistributewealth to the poorest while protecting economicgrowth will need to complement the reforms discussedabove to create skilled jobs for the poor.Executive Summary South Africa Economic Update 11 vii
CHAPTER 1Recent Economic Developments
Global Economic DevelopmentsThe global economic recovery continues in early 2018Global economic activity remains solid. Globaloutput expanded by an estimated 3 percent in thefourth quarter of 2017.¹ This was substantiallyabove the growth potential of the global economy,but weaker than in previous quarters, as growthmoderated in the United States, the Euro area,China, and other large emerging markets anddeveloping economies (EMDEs). However, globalindustrial production accelerated in Novemberand December, and the global manufacturingPurchasing Managers’ Index (PMI) was close to aseven-year high in January 2018. A further rise inservices sector activity led the global compositePMI to hit a 40-month high at the start of 2018(Figure 1.1 A).Momentum in the global goods trade continues.Despite moderating in the fourth quarter of 2017,the global goods trade continues to grow, supportedby the recovery in manufacturing activity andinvestment. In 2017, growth in the global trade ofgoods averaged 4.3 percent, nearly three times thepace observed in 2016, and up from an average of 2.6percent over the last five years. New manufacturingexport orders in January indicate that thismomentum will continue in 2018 (Figure 1.1 B).Figure 1.1: Global activity indicatorsA. Global GDP growth and global composite PMIB. Global trade in goods growth andmanufacturing export ordersPercentPercent, 3m-3m saar556454352250Global GDP growth20182017201620152014201320121Composite PMI ul-17Oct-17Jan-18IndexGlobal goods tradeNew export orders (RHS)Source: World Bank staff calculations. A. Global growth in 2017 Q4 (orange bar) is estimated using available country-level data fromnational sources. Values for PMI above 50 indicate expansion. Last observation is January 2018. B. Values for PMI new export ordersabove 50 indicate expansion. Last observation is January 2018.The economic recovery in advanced economiesstrengthened at the start of 2018. U.S. growthmoderated toward the end of 2017, but still maintaineda robust quarterly pace of 2.6 percent. Labor marketconditions were strong in January 2018, with nonfarmpayrolls rising by 200,000, the unemployment rateremaining steady at a 17-year low of 4.1 percent,and average hourly earnings growth increasingto 2.9 percent (year-on-year), demonstrating thestrongest annual gains since 2009. Growth in theEuro area moderated slightly to 2.3 percent in thelast quarter of 2017, following a marked rebound¹ Unless otherwise indicated, all quarterly growth rates in this report are seasonally adjusted annualized rates.Chapter 1 South Africa Economic Update 11 2
in previous quarters. High-frequency indicatorssuggest a strong start to 2018, with the compositePMI nearly reaching a 12-year high in January. Growthin Japan slowed to 0.5 percent in the fourth quarterof 2017, down from 2.2 percent in the third quarter,but private consumption and exports strengthened,and industrial production remained firm toward theend of the year.In China, economic activity indicators point toresilient growth, increasingly led by services.Growth moderated to 6.3 percent in the last quarterof 2017, bringing overall growth for the year to 6.9percent. Recent data suggest a gradual slowdownin 2018, accompanied by a continued shift frommanufacturing to service activity, entailing, overtime, less demand for metals. The nonmanufacturingPMI increased in January to its highest level sinceSeptember 2017, while the manufacturing PMI fellto 51.3 in January – the lowest result since May 2017.Economic activity in other major emergingmarkets and developing economies continues tofirm up. Recent data point to a continued upturn incommodity-exporting EMDEs, apart from Russia,where activity decelerated toward the end of theyear, with quarterly growth in retail sales andindustrial production contracting. In Brazil, retailsales and industrial production are growing. Policyinterest rates were cut in February, extending aneasing cycle that started in October 2016. Nigeria’srecovery continued, with a pickup in consumerconfidence and a rise in oil production in December.The manufacturing and nonmanufacturing PMIsdeclined slightly in January, but remain elevated,suggesting steady momentum in 2018. Recovery wasalso observed in Angola as the political transitionboosted consumer and business confidence.Growth also picked up in several large commodityimporting EMDEs as domestic headwinds eased,apart from Turkey, where growth likely deceleratedin the fourth quarter of 2017. In India, activitycontinued to recover from the temporary adverseeffects of the goods and service tax, which cameinto effect in July 2017.Figure 1.2: Global financial indicatorsA. Flows to EMDE equity and bond fundsB. EMDE bond spreads and stock market indexUS billions, 4 week sumBasis Jun-16-25Bonds130300120260110Bond 0Oct-1725420Sep-1735Index, 100 Jan. 2, 2017Equity index (RHS)Source: World Bank staff calculations. A. Last observation is February 14, 2018. B. Bond spreads are defined as bond yield spreads overU.S. government securities issued by sovereign and quasi-sovereign entities in emerging market economies (in ). Equity index showsthe MSCI emerging market index. The vertical line corresponds to the February 2, 2018, release of U.S. employment and wage growthdata. Last observation is February 20, 2018.Global financial market volatility spiked amid risingU.S. inflation expectations and bond yields. Followinga prolonged period of low and stable long-term yields inadvanced economies, rallying global equity prices, andcompressed volatility, financial markets were turbulentin the first half of February 2018. This was associated3 South Africa Economic Update 11 Chapter 1with a continued rise in U.S. long-term yields, drivenby rising inflation expectations and prospects of fasternormalization of U.S. monetary policy. Following thecountry’s stronger-than-expected wage growth, U.S.and global equity markets tumbled in February, erasingyear-to-date gains. The effect on U.S. and global equity
prices was amplified by ongoing concerns aboutoverstretched valuations. Bond spreads and creditdefault swaps increased, but remained close to thelow levels seen throughout 2017. A favorable globaleconomic backdrop likely helped prevent a broaderreassessment of credit risks.Capital flows to EMDEs remain resilient. EMDEfinancial markets started the year on a strong note,with portfolio flows to bond and equity mutual fundssurging in January (Figure 1.2 A) and international bondsales reaching an all-time high of 71 billion. EMDEmarkets were affected by the global sell-off in earlyFebruary, particularly corporate bond funds. Sovereignbond spreads have risen, although they remain low(Figure 1.2 B). Bond issuance moderated in February,with a few countries including Kenya and Nigeria,returning to the capital markets.The global outlook remains positive but is not without risks for EMDEsThe broad and solid global economic expansionobserved in 2017 is expected to continue in 2018and 2019. Global growth is estimated to have reacheda stronger-than-expected 3 percent in 2017, a notablerecovery from a post-crisis low of 2.4 percent in 2016.In 2018, global growth is projected to edge up to 3.1percent as the cyclical upturn in advanced economiescontinues and EMDE growth strengthens.Global financial conditions and commodity pricesare expected to stabilize in 2018. Global financingconditions are likely to tighten in 2018 as monetarypolicy normalizes in major advanced economies. Bothenergy and metal prices are expected to level off in2018 (Figure 1.4) after posting significant gains in 2017,while agricultural prices remain stable.Growth in EMDEs is projected to rise to 4.5 percentin 2018 and 4.7 percent in 2019 as activity recoversfurther in commodity-exporting countries andremains robust in commodity importers. Growth incommodity-exporting EMDEs is projected to pick upfrom 1.8 percent in 2017 to 2.7 percent in 2018, and to3.1 percent in 2019, as headwinds gradually moderate.Growth in commodity-importing EMDEs is projectedto remain robust, at 5.7 percent in 2018 and 2019,underpinned by solid export growth.The risks to the global outlook are becoming morebalanced, mainly due to the possibility of strongerthan-expected growth in the largest advancedeconomies and EMDEs. However, downside risksremain. A sudden increase in borrowing costs, triggeredby a reassessment of the pace of advanced-economymonetary policy normalization or concerns aboutasset valuations, could lead to severe financial stressand disrupt capital flows to EMDEs. Escalating traderestrictions could derail the recovery in trade. Over thelonger term, a more pronounced slowdown in potentialgrowth in both advanced economies and EMDEs wouldmake the global economy more vulnerable to shocksand worsen prospects for improved living standards.Chapter 1 South Africa Economic Update 11 4
Box 1.1: The impact of global monetary conditions on South AfricaThe world’s natural real rate of interest (the rateneeded to equalize the global supply of savings with theglobal demand for investment) has been declining forthe past few decades, led by two connected events. Atthe beginning of the millennium, preferences (includingrelatively accommodative U.S. monetary policy) andexplicit policies in Asian emerging countries increasedthe supply of global savings, leading to a reductionin the natural rate across developed countries. Thiswas one of the causes behind the financial boomand the subsequent global financial crisis. After thefinancial crisis, an increase in savings and a reductionin the propensity to invest in developed countriespushed the real rate even lower, to negative rates insome Organisation for Economic Co-operation andDevelopment (OECD) countries.In comparison with global trends, the decline in SouthAfrica’s natural real rate of interest was delayed, as thesavings investment gap widened from the early 2000s(See Box 1.1 Figure 1). During this period, foreign directinvestments surged with the commodity boom, whiledomestic savings stayed low.Box 1.1 Figure 1: Savings – investment gap in South Africa403530252015Global financial 2016201710Investment % of GDPSavings % GDPVarious estimates of South Africa’s natural real interestrate suggest that it only started to decelerate after thefinancial crisis (See Box 1.1 Table 1). This adjustmentwas reflected in lower net foreign direct investments,as domestic savings remained depressed. At the5 South Africa Economic Update 11 Chapter 1same time, the delayed adjustment in the savingsinvestment gap led to a significant accumulation offoreign liabilities: South Africa’s external debt to grossnational income rose from 19 percent in 2000 to 51percent in 2016.
Box 1.1 Table 1: Estimates of South Africa’s natural rate of ilterHamiltonForecasting basedMethods (2017)Leubach andWilliams n Bjørnland,et al .12008-20170.70.61.21.80.8Source: World Bank (2018b).As an increasing number of advanced economiesnormalize monetary policy, global interest rates areexpected to rise. While this, along with improvedpolicy certainty, may encourage South Africans tosave more, it may also limit the expected reboundin private investment, particularly given that higherinterest rates will make it more expensive for SouthAfrica to service its external debt.Real Sector Developments in South AfricaDespite a modest rebound, South African growth continues to lagbehind the rest of the worldWhile global growth accelerates, the South Africaneconomy has been gathering steam slowly. In 2017,primary sectors were the main drivers of growth,particularly in the agricultural and mining sectors.Momentum in other sectors has been weak. This meansthat South Africa is diverging from global growth. Thisis largely because the country’s main exports continueto be commodities – but they are raw materials thatare not highly sought-after internationally. Exceptfor parts of the services sector, South Africa is onlyweakly integrated into global and regional valuechains, meaning that it has limited opportunities tobenefit from global growth. The business cycle hasbeen gaining momentum since late 2017 and businessand consumer sentiment improved in early 2018. Thismay herald the return of investment that the countryneeds to make its firms more competitive, transfertechnology, join global supply networks, and continueovercoming its historical isolation from the worldeconomy (World Bank 2018b). This issue is furtherdiscussed in Chapter 2.Growth in 2017 exceeded expectations. Althoughforecasts have been revised upward throughout theyear, a growth of 1.3 percent for the year beat themost recent consensus of about 1 percent. This waslargely due to significant methodological revisionsby Statistics South Africa (StatsSA), which date backto at least 2015. The strong upward revision for thefirst quarter of 2017 erased a technical recession (twoconsecutive quarterly contractions in GDP) that hadpreviously been recorded, although quarterly GDP stillcontracted in the fourth quarter of 2016.On the supply side, growth in agriculture wasrevised down, especially for 2016 and 2017, makingthe downturn from the drought more pronouncedin 2016 but keeping the agricultural recovery in 2017strong. Upward revisions mainly focused on theservices sector and, to a lesser extent, manufacturing.The main revisions came from much higher growth inthe finance, real estate, and business services sector,accounting for 43 percent of the revision in 2017(Figure 1.3 A). Trade, catering, and accommodationsaw the second-largest upward revision in 2017, by17 percent. This is reflected in demand (Figure 1.3 B),Chapter 1 South Africa Economic Update 11 6
with private consumption being significantly revisedupward in 2017, suggesting increased momentum inhousehold spending. In addition, imports were reviseddownward significantly, also helping headline GDP, asconsumers appear to have spent more on domesticgoods. Exports, on the other hand, were weaker in 2017than previously thought.Figure 1.3: StatsSA’s GDP revisions – fourth versus third quarter 2017 releases(difference in seasonally adjusted annualized GDP, R billion, constant 2010 prices)A. SupplyB. Demand3050301010-10-10General government servicesDiscrepancyFinance, real estate and business servicesImports of goods and servicesTransport, storage and communicationExports of goods and servicesTrade, catering and accommodationChange in inventoriesConstructionManufacturingGross fixed capital formationMiningAgriculture, forestry and fishingGeneral governmentTotal2017 Q32017 Q22017 Q12016 Q42016 Q32016 Q22016 Q12015 Q42015 Q32015 Q22015 Q12017 Q32017 Q22017 Q12016 Q42016 Q32016 Q22016 Q12015 Q42015 Q32015 Q22015 Q1-30HouseholdsTotalSource: StatsSA and World Bank staff calculations.Despite the revisions, the impact of recentdevelopments has not fundamentally altered.Although improving somewhat faster than anticipated,growth was still low in 2017. In per capita terms, theeconomy stagnated, providing no additional incomethat could help reduce poverty. Moreover, growth wasstill principally led by agriculture. Rebounding fromthe drought, the sector grew by 17.7 percent in 2017,following a contraction of 6.4 percent in 2015 and 10.2percent in 2016 due to drought. This recovery contributed0.4 percentage points to headline GDP. Without thisrebound, the economy would have grown by 0.9 percent.Although agriculture still grew by 37.5 percent in thefourth quarter of 2017 (Table 1.1), it only expanded by1.1 percent in year-on-year terms (compared with an7 South Africa Economic Update 11 Chapter 1averag
South Africa should count 8.3 million poor people (at 1.90 a day), down from almost 10.5 million in 2017. But the number of poor people could be brought down further, to 4 million by 2030, through select
