Transcription
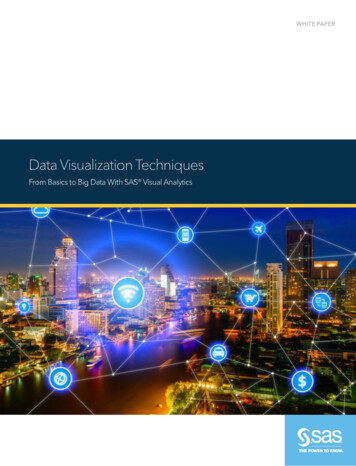
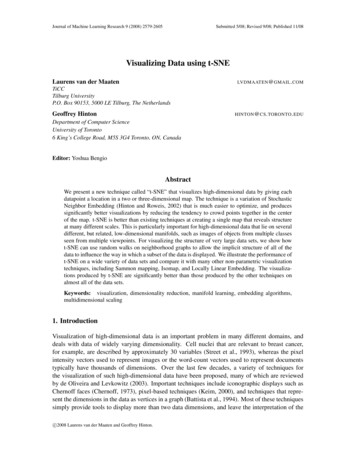
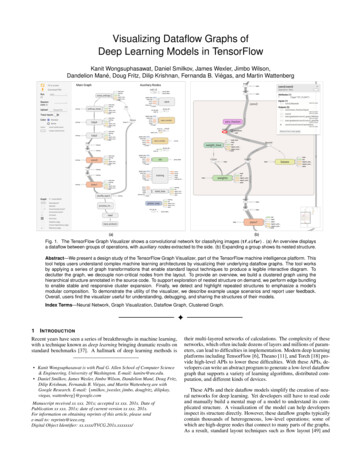
Visualizing Dataflow Graphs ofDeep Learning Models in TensorFlowKanit Wongsuphasawat, Daniel Smilkov, James Wexler, Jimbo Wilson,Dandelion Mané, Doug Fritz, Dilip Krishnan, Fernanda B. Viégas, and Martin WattenbergMain GraphAuxiliary Nodes(a)(b)Fig. 1. The TensorFlow Graph Visualizer shows a convolutional network for classifying images (tf cifar) . (a) An overview displaysa dataflow between groups of operations, with auxiliary nodes extracted to the side. (b) Expanding a group shows its nested structure.Abstract—We present a design study of the TensorFlow Graph Visualizer, part of the TensorFlow machine intelligence platform. Thistool helps users understand complex machine learning architectures by visualizing their underlying dataflow graphs. The tool worksby applying a series of graph transformations that enable standard layout techniques to produce a legible interactive diagram. Todeclutter the graph, we decouple non-critical nodes from the layout. To provide an overview, we build a clustered graph using thehierarchical structure annotated in the source code. To support exploration of nested structure on demand, we perform edge bundlingto enable stable and responsive cluster expansion. Finally, we detect and highlight repeated structures to emphasize a model’smodular composition. To demonstrate the utility of the visualizer, we describe example usage scenarios and report user feedback.Overall, users find the visualizer useful for understanding, debugging, and sharing the structures of their models.Index Terms—Neural Network, Graph Visualization, Dataflow Graph, Clustered Graph.1I NTRODUCTIONRecent years have seen a series of breakthroughs in machine learning,with a technique known as deep learning bringing dramatic results onstandard benchmarks [37]. A hallmark of deep learning methods is Kanit Wongsuphasawat is with Paul G. Allen School of Computer Science& Engineering, University of Washington. E-mail: kanitw@uw.edu. Daniel Smilkov, James Wexler, Jimbo Wilson, Dandelion Mané, Doug Fritz,Dilip Krishnan, Fernanda B. Viégas, and Martin Wattenberg are withGoogle Research. E-mail: {smilkov, jwexler, jimbo, dougfritz, dilipkay,viegas, wattenberg}@google.comManuscript received xx xxx. 201x; accepted xx xxx. 201x. Date ofPublication xx xxx. 201x; date of current version xx xxx. 201x.For information on obtaining reprints of this article, please sende-mail to: reprints@ieee.org.Digital Object Identifier: xx.xxxx/TVCG.201x.xxxxxxx/their multi-layered networks of calculations. The complexity of thesenetworks, which often include dozens of layers and millions of parameters, can lead to difficulties in implementation. Modern deep learningplatforms including TensorFlow [6], Theano [11], and Torch [18] provide high-level APIs to lower these difficulties. With these APIs, developers can write an abstract program to generate a low-level dataflowgraph that supports a variety of learning algorithms, distributed computation, and different kinds of devices.These APIs and their dataflow models simplify the creation of neural networks for deep learning. Yet developers still have to read codeand manually build a mental map of a model to understand its complicated structure. A visualization of the model can help developersinspect its structure directly. However, these dataflow graphs typicallycontain thousands of heterogeneous, low-level operations; some ofwhich are high-degree nodes that connect to many parts of the graphs.As a result, standard layout techniques such as flow layout [49] and
force-directed layout generally produce tangled diagrams.In response, we present the TensorFlow Graph Visualizer, a component of in the TensorFlow machine intelligence platform, to helpdevelopers understand and inspect the structure of their TensorFlowmodels. Given a low-level directed dataflow graph of a model as input, the visualizer produces an interactive visualization that shows thehigh-level structure of the model, akin to diagrams that deep learningexperts typically draw to explain their models, and enables users toexplore its nested structure on demand.This paper describes our design process and the design of the visualizer. We present a set of graph transformations and visual encodingsthat enables standard flow layout techniques [50] to produce a legible interactive diagram from a dataflow graph of a machine learningmodel. To provide an overview, we build a clustered graph by grouping nodes based on their hierarchical namespaces that developers canprovide. To support exploration, we introduce a novel application ofedge bundling to enable stable and responsive expansion of clusteredflow layout. To declutter the graph, we apply heuristics to extract noncritical nodes, and introduce new visual encodings that decouple theextracted nodes from the layout. We also detect and highlight repeatedstructures to help users recognize modular composition in the models.Finally, we overlay the graph with additional quantitative informationto help developers inspect their models.To demonstrate the utility of the visualizer, we describe usage scenarios for exploring deep learning models. We also report feedbackfrom users who use the tool to examine structures of deep learningmodels, and discuss usage patterns we have observed in the wild.Overall, developers find the visualization useful for understanding, debugging, and sharing the structures of their models.2 R ELATED W ORK2.1 Dataflow Graph ApplicationsDataflow graphs arise in diverse domains: distributed systems [15, 32,42], databases [41], user-interface development [20], visualization [14,46, 52] and engineering [4].Some dataflow systems (e.g., [4, 14, 52]) use visualizations as authoring tools and allow users to directly edit the graph to modify thedataflow. Since dataflows in these systems represent high-level components that are manually added one-by-one, their graphs are typicallymuch smaller compared to dataflow graphs of deep neural networks.One important application domain for dataflow models is largescale distributed systems, which automatically create dataflow structures from a program to enable distributed computation [15, 32, 42].To help users diagnose performance of distributed databases, Perfopticon [41] includes a collapsible dataflow graph of query executionplans. However, its design does not scale to large dataflow graphs.Our goal is to help users understand large, complex dataflow programs with a visualization that scales, provides a legible overview,and supports detailed exploration on demand. While our design targets TensorFlow, our strategy to decouple non-critical nodes from thelayout can be applicable for heterogeneous graphs in other domains.Clustered flow graphs in other domains can apply edge bundling tofacilitate responsive and stable graph expansion as well.2.2 Visualization for Neural NetworksVisualization plays many important roles in machine learning. Practitioners and researchers often use visualization to monitor learned parameters and output metrics to help them train and optimize their models. Besides the Graph Visualizer, TensorBoard, TensorFlow’s dashboard component, also includes modules for monitoring scalar values,distribution of tensors, images, and audio. We briefly describe thesemodules in supplementary material.For neural networks, the lack of understanding of how the modelswork often makes model optimization difficult. Visualizations can improve the transparency and interpretability of the models and help openthese “black boxes” [34, 54]. Some projects present visualizations forspecific types of neural networks such as convolutional network [39]and recurrent networks [2, 48]. Besides supporting expert’s analysis,recent projects, such as Olah’s interactive essays [1], ConvNetJS [2],and TensorFlow Playground [47], provide interactive visualizations toteach novices how neural networks work. Unlike prior projects thatfocus on visualizing learned parameters and output values, or specifickinds of networks, our primary goal is to help users understand thestructure of dataflow graphs that represent arbitrary neural networks.Similar to our work, some high-level deep learning toolkits such asKeras [3] and MXNet [16] leverage GraphViz [28] to provide toolsfor visualizing model structure. However, their graph representationsare higher-level than TensorFlow and do not contain information aboutnested low-level operations. For other toolkits that use more complexand lower-level dataflow graphs [11, 18], standard tools like GraphVizgenerally produce illegible layouts. Without a better tool, developershave to read the code and manually build a mental map of the structure to understand a model. Our visualizer aims to help developersunderstand and inspect low-level dataflow graphs of neural networks.2.3Graph Visualization TechniquesVisualizing dataflow graphs can be generalized as drawing directedgraphs. A common way to draw directed graph is the flow layout,which uses one axis to convey overall direction. A standard flowlayout algorithm, introduced by Sugiyama et al. [50] and widely extended [13, 31, 33], assigns x-and y-coordinates separately in multiplestages that optimize different objectives. An alternative approach byDwyer et al. applies constraint optimization to compute both coordinates for a flow layout simultaneously [22, 23, 24]. The separation constraints [24] introduced by this approach are also used in othertypes of layouts [35, 57]. Since directionality is critical for understanding the dataflow of neural networks, we use a flow layout as a basis ofour layout algorithm and augment it with additional transformationsto simplify the graph. Our implementation uses a Sugiyama-style algorithm due to the availability of stable libraries and high-quality documentation. However, our additional transformations are also applicable for a constraint-based flow layout.To simplify large graphs, a common technique is to build hierarchical clustered graphs that provide an overview and support clusterexpansion to explore details [7, 8, 9, 30]. Following this approach,we leverage hierarchical namespaces that developers provide to createa clustered flow layout. To help users maintain mental maps duringexploration [40], a clustered graph must also be responsive and stable.For undirected graphs, some systems use static layouts [10, 30, 55]while others draw the graph interactively [7, 8, 55]. For directedgraphs, constraint-based approaches [24, 25, 26] and an online technique [43] can speed up the calculation and preserve the topology ofthe flow layout during interactions. However, drawing edges directlybetween all visible nodes still clutters expanded graphs. To both declutter the view and support interactive expansion, we bundle and routeedges between groups such that edges only connect nodes that are siblings in the hierarchy [10]. This approach allows us to compute thelayout of each cluster’s subgraph separately and update only relevantsubgraphs when users expand nodes. As a result, we can create responsive and stable interactive graph with a standard Sugiyama-stylealgorithm for clustered graph [27, 29, 45, 49], without the need to implement complex constraints or online algorithms. To the best of ourknowledge, none of the prior work documents the application of edgebundling to enable interactive expansion of a clustered flow layout.Graph clustering and edge bundling simplify our layout, but stillleave intertwining edges in many cases due to the presence of noncritical, high-degree nodes. Another group of graph simplificationtechniques extracts nodes and edges, or replaces them with specialvisual encodings. Dunne and Shneiderman substitute common nodesand links with compact glyphs that represent common patterns [21].Van Ham & Wattenberg remove edges based on a centrality measureto show graph clusters in force-directed layout [56]. Inspired by thesestrategies, we apply heuristics based on domain knowledge, semanticmetadata, and distribution of node degrees to extract non-critical nodesfrom the layout, and re-encode them with new visual encodings.
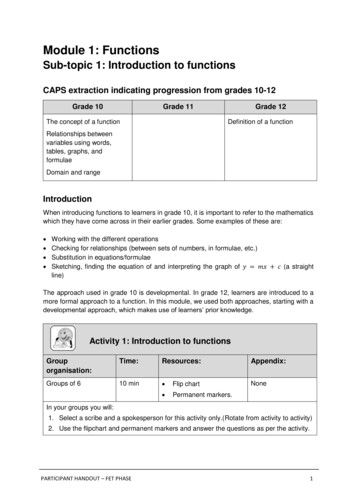
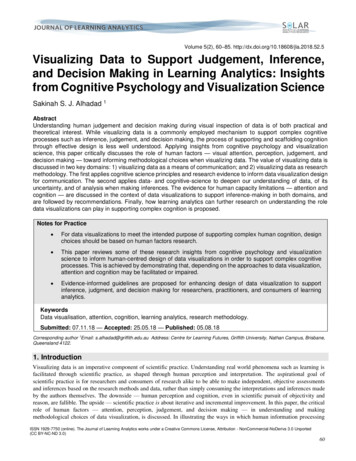
3BACKGROUND : T ENSOR F LOWTensorFlow [6] is Google’s system for the implementation and deployment of large-scale machine learning models. Although deep learningis a central application, TensorFlow also supports a broad range ofmodels including other types of learning algorithms.The Structure of a TensorFlow ModelA TensorFlow model is a dataflow graph that represents a computation.Nodes in the graph represent various operations. These include mathematical functions such as addition and matrix multiplication; constant,sequence, and random operations for initializing tensor values; summary operations for producing log events for debugging; and variableoperations for storing model parameters.Edges in TensorFlow graphs serve three different purposes. Datadependency edges represent tensors, or multidimensional arrays, thatare input and output data of the operations. Reference edges, or outputs of variable operations, represent pointers to the variable ratherthan its value, allowing dependent operations (e.g., Assign) to mutatethe referenced variable. Finally, control dependency edges do not represent any data but indicate that their source operations must executebefore their tail operations can start.Building a TensorFlow ModelThe TensorFlow API provides high-level methods for producing low-level operations in the dataflow graph. Some, such astf.train.GradientDescentOptimizer, generate dozens of lowlevel operations. Thus a small amount of code, such as the definitionof the tf mnist simple model in Figure 4 (see supplementary material), can produce about a hundred operations in the graph. Real-worldnetworks can be even more complex. For instance, an implementationof the well-known Inception network [51] has over 36,000 nodes.Operation NamesFor clarity, operations in TensorFlow graphs have unique names,which are partly generated by the API and partly specified by users.Slashes in operation names define hierarchies akin to Unix paths(like/this/example). By default, the API uses operation typesas names and appends integer suffixes to make names unique (e.g.,“Add 1”). To provide a meaningful structure, users can group operations with a namespace prefix (e.g., “weights/”). Complex methods such as tf.train.GradientDescentOptimizer also automatically group their underlying operations into subnamespaces (e.g.,“gradients” and “GradientDescent”). As discussed later in §5.2,we apply these namespaces to build a clustered graph.4M OTIVATION & D ESIGN P ROCESSThe motivation for the TensorFlow Graph Visualizer came from ourconversations with deep learning experts, including one of the authors.When experts discuss their models, they frequently use diagrams (e.g.,Figure 2) to depict high-level structure. When working with a newmodel, they often read the code and draw a diagram to help them builda mental map of the model’s architecture. Since diagrams are criticalfor their work, machine learning experts desire a tool that can automatically visualize the model structures.Motivated by an apparent need for a visualization tool, we workedwith potential users to understand the key tasks for such a visualization. We also examined the model data that a visualization would haveto portray. The purpose of these investigations was to match user needswith what would be possible given real-world data.Fig. 2. Whiteboard drawing by a computer vision expert: a convolutional network for image classification.4.1 Task AnalysisOur overarching design goal is to help developers understand and communicate the structures of TensorFlow models, which can be usefulin many scenarios. Based on conversations with potential users, weidentified a set of key scenarios for a model visualization. Beginnersoften learn how to use TensorFlow based on example networks in thetutorials. Even experts usually build new models based on existingnetworks. Therefore, they can use the visualization to help them understand existing models. When modifying the code that generatesmodels, developers can use the visualization to observe the changesthey make. Finally, developers typically work in teams and share theirmodels with their co-workers; they can use the visualization to helpexplain the structures of their models.As discussed earlier, researchers often manually create diagrams toexplain their models and build mental maps. These diagrams werean important inspiration for our design. As shown in Figure 2, theyusually show a high-level view of the model architecture and featurerelatively few nodes. Low-level implementation details such as costfunction calculation or parameter update mechanism are generally excluded from these diagrams. When a network features repeated modules, the modules are usually drawn in a way that viewers can tell theyare the same. These diagrams also often annotate quantitative information such as the layer dimensions in Figure 2.In model development, developers also need to understand themodel beyond the high-level structure. For example, when a developer modifies a part of the code and sees an unexpected result, thereason may lie either in the model itself or in the code that created themodel. It can be hard to know whether the program is actually buildingthe intended model. In such case, the developer may desire to inspecta specific part of the model to debug their code.From conversations with experts about potential usage scenariosand our observation from these hand-drawn diagrams, we identify aset of main tasks that the visualization should support:T1: Understand an overview of the high-level components of themodel and their relationships, similar to schematic diagrams thatdevelopers manually draw to explain their model structure.T2: Recognize similarities and differences between components inthe graph. Knowing that two high-level components have identical structure helps users build a mental model of a network;noticing differences between components that should be identical can help them detect a bug.T3: Examine the nested structure of a high-level component, interms of low-level operations. This is especially important whena complex nested structure has been created automatically froma single API call.T4: Inspect details of individual operations. Developers should nothave to refer back to the code to see lists of attributes, inputs, andoutputs, for instance.T5: View quantitative data in the context of the graph. For example,users often want to know tensor sizes, distribution of computation between devices, and compute time for each operation.These tasks do not include standard monitoring apparatus, such asplots of loss functions (i.e. optimization objectives) over time. Suchtools are important, but beyond the scope of this paper since they donot relate directly to the structure of the dataflow graph; we briefly discuss how TensorFlow handles these issues in supplementary material.This task analysis guided our work, as we engaged in a usercentered design process. Throughout the project, we worked closelywith several TensorFlow developers and beta users and iterated on thedesign. We met with beta users and members of the developer teamfor at least an hour a week (sometimes for much longer) for about 20weeks. After the release, we continued to seek feedback from bothinternal and public users.4.2 Data Characteristic AnalysisOur design process also included an investigation into the particularproperties of dataflow graphs that define TensorFlow models. An immediate concern was that early experiments with standard layout tools
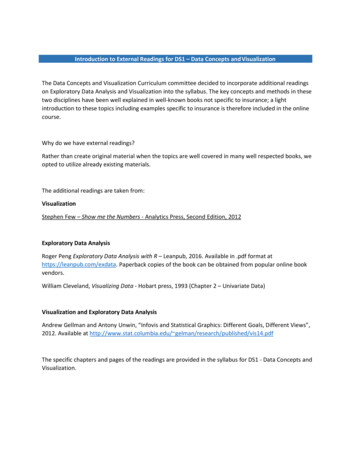
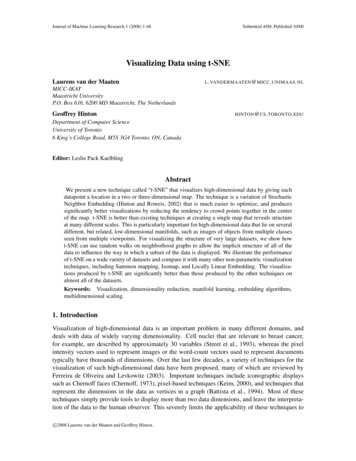
(e.g. flow layout in GraphViz [28], as well as force-directed layoutsfrom D3) had produced poor results. We wanted to understand, moregenerally, the scale of real-world model data, and whether it would bepossible for an automatic visualization to support key user tasks.We initially performed rapid prototyping to investigate the reasonsthat TensorFlow graphs caused problems for standard layouts. We visualized several example computation model graphs in multiple ways.After a few trials, we quickly abandoned experiments with forcedirected layouts as they created illegible hairballs. Attempts to usea standard flow layout [50] for example models yielded illegible results. For example, Figure 4-a shows a flow layout of a simple networkfor classifying handwritten digits (tf mnist simple). Building clustered flow layouts allows us to produce more legible views. However,these layouts were still cluttered and often change dramatically afterexpanding a node.These experiments pointed to several challenges that make TensorFlow model graphs problematic for standard techniques.C1: Mismatch between graph topology and semantics. One mighthope that meaningful structures would emerge naturally from thegraph topology. Unfortunately, it is hard to observe clear boundaries between groups of operations that perform different functions such as declaring and initializing variables, or calculatinggradients. Moreover, randomized algorithms produce visuallydifferent layouts for topologically identical subgraphs. A goodlayout should show similarities between identical subgraphs.C2: Graph heterogeneity. Some operations and connections are lessimportant for understanding the graph than others. For example, developers often consider constants and variables simply asparameters for other operators. Similarly, summary operationsserve as bookkeepers that save their input to log files for inspection, but have no effect on the computation. Treating all nodesequivalently clutters the layout with non-critical details.C3: Interconnected nodes. While most nodes in TensorFlow graphshave low-degree (one to four), most graphs also contain some interconnected high-degree nodes that couple different parts of thegraphs. For example, the summary writer operation (Figure 4-a)connects with all summary operations. These high-degree nodespresent a major problem for visualizations, forcing a choice between tight clustering and visual clutter. In force-directed layouts, connections between these nodes reduce distances betweennodes that are otherwise distant, leading to illegibly dense groupings. In flow layouts, these connections produce long edgesalong of the flow of the layout and clutter the views.5D ESIGNOFT HE T ENSOR F LOW G RAPH V ISUALIZERWe now describe the design of TensorFlow Graph Visualizer that aimsto help users with the tasks in §4.1. First, we explain the basic layoutand visual encodings. We then describe a sequence of graph transformations that target the challenges in §4.2. We also report how weidentify and highlight repeated structure, and overlay the graph withother quantitative information. We finally discuss our implementation.For simplicity, we will use a simple softmax regression model forimage classification (tf mnist simple) to illustrate how we transforman illegible graph into a high-level diagram (Figure 4). As shown in thefinal diagram (Figure 4-d), the model calculates weighted sum (Wx b)of the input x-data. The parameters (weights and bias) are placedon the side. With Wx b and the y-input labels, the model computes thetest metrics and cross-entropy (xent), which is in turn used to trainand update the parameters. Besides this simple model, we describescenarios for exploring more complex neural networks in §6.5.1Horizontal ellipse nodes represent individual operations. Comparedto a circle, this shape provides extra room for input edges on the bottom and output edges on the top. Edge styles distinguish differentkinds of dependencies (T2). Solid lines represent data that flow alongdata dependency edges. Dotted lines indicate that data does not flowalong control dependency edges (e.g., bias init in Figure 4-c). Reference edges, such as weight weight/Assign in Figure 3-a, havearrows pointing back to the variables to suggest that the tail operationscan mutate the incoming tensors.Since users are often interested in the shape of tensors edges (T5),we label the edges with the tensor shape (Figure 3-a). We also compute the total tensor size (i.e. the number of entries, or the productof each dimension size) and map it to the edge’s stroke width (via apower scale due to the large range of possible tensor sizes). If theinput graph does not specify dimension sizes for a tensor, the lowestpossible tensor size determines the width.Users can pan and zoom to navigate the graph by dragging andscrolling. When the graph is zoomed, a mini-map appears on the bottom right corner to help users track the current viewpoint (Figure 1-b).To reset the navigation, users can click the “Fit to screen” button onthe top-left. To inspect details of a node (T4), users can select a nodeto open an information card widget (Figure 1-b, top-right), which liststhe node’s type, attributes, as well as its inputs and outputs. The widgetitself is interactive: users can select the node’s input or output listedon the graph. If necessary, the viewpoint automatically pans so theselected node is visible.5.2 Graph TransformationThe key challenge for visualizing TensorFlow graphs is overcomingthe layout problems described in §4.2. We apply a sequence of transformations (Figure 4) that enables standard layout techniques to overcome these challenges. To provide an overview that matches the semantics of the model (C1), we cluster nodes based on their namespaces [8]. In addition to clustering, we also bundle edges to enablestable and responsive layout when users expand clusters. Moreover,as non-critical (C2) and interconnected nodes (C3) often clutter thelayout of clustered graphs, we extract these nodes from the graphs andintroduce new visual encodings that decouple them from the layout.Step 1. Extract Non-Critical OperationsTensorFlow graphs are large and contain heterogeneuous operations(C2), many of which are less important when developers inspect amodel. To declutter and shrink the graph, we de-emphasize these noncritical operations by extracting these nodes from the layout and encoding them as small icons on the side of their neighbors.We extract two kinds of operations, constants and summaries. Bothare loosely connected: extracting them does not change any paths between other nodes. A constant node always serves as an input to another operation and thus has only one output edge and no input edge. Asummary node always has one input edge from a logged operation andone output edge to the summary writer node, which is the global sinknode that takes all summary nodes as inputs and write log data to thelog file. Since the summary writer behaves identically in every TensorFlow graph, it is negligible for distinguishing different models and canbe removed. With the summary writer removed, both summaries andconstants have degree 1. Thus, we can extract them without changingany connections between the rest of the graph.Basic Encoding and InteractionAs in Figures 1 and 4-d, the visualizer initially fits the whole graph tothe screen. We draw the directed graph of the dataflow with a flow layout [50] from the bottom to the top, following a common conventionin the deep learning literature. Although both horizontal and verticallayouts are common in the literature, we use a vertical layout since itproduces a better aspect ratio for models with a large number of layers.Fig. 3.Extract non-critical operations. (a) A raw subgraph for theweights variable and its summary. (b) The subgraph with summary andconstant operations extracted from the flow layout and re-encoded asembedded input and output on the side of their neighbors.
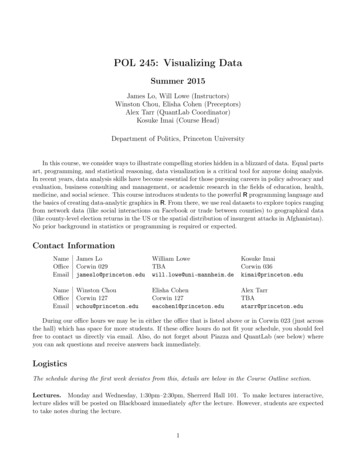
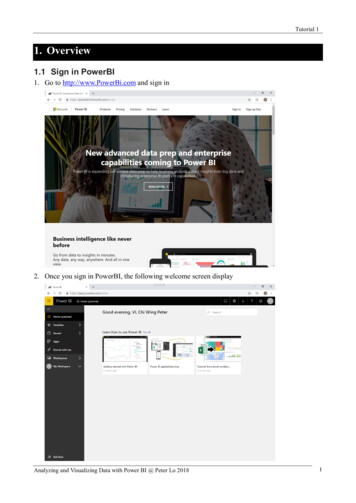
aExtract Non-critical OperationsWe encode the extracted constants and summaries as embedded inputs and outputs of their neighbor operations, or small icons on the leftand right of the node they connect to (Figure 3). A small circle represents a constant while a bar chart icon represents a summary operation.Edges of the embedded nodes have arrows to indicate the flow direction. We place embedded nodes on the side of their neighbor nodes tomake the overall layout more compact and avoid occlusion with otheredges that connect with the node on the top and bottom.As shown in Figure 4 (a-b), this transformation declutters the viewin two ways. First, removing the interconnected summary writer (red)frees logged operations (green) from being tied together (C3). Moreover, constants and summaries together account for a large fraction ofnodes (approximately 30% in a typical network). Extracting them cansignificantly reduce the graph size, making it less packed. Reducedsize also expedites subsequent transformation and layout calculation.Step 2. Build a Clustered Graph with Bundled EdgesbBuild a Clustered GraphcExtract Auxiliary NodesdFig. 4. Transforming the graph of a simple model for classifying handwritten digits (tf mnist simple). (a) A dataflow graph, which is large andwide and has many intertwining connections. The zoomed part of theraw graph highlights how the summary writer operation (red) is interconnected to logged operations in many different parts of the graph (green)via summary operations (blue). (b) The dataflow graph with summaryand constant operations extracted. Logged operations (green) are nowless intertwined. (c) An overview of the graph, which shows only toplevel group nodes in the hierarchy. (d) An overview with auxiliary nodesextracted to the side of the graph. Selecting an extracted node highlightsproxy icons attached to its graph neighbors.To reflect semantic structure of the model (C1), we build a hierarchical clustered graph by grouping operations based on their namespaces.We also bundle edges between groups to help simplify the layout andmake the clustered flow layout responsive and stable when users expand nodes. With these transformations, we can provide an overview(T1) that shows only the top-level groups in the hierarchy as the initialview, while allowing users to expand these groups to examine thei
TensorFlow [6] is Google’s system for the implementation and deploy-ment of large-scale machine learning models. Although deep learning is a central application, TensorFlow also supports a broad range of models including other types of learning algorit