Transcription
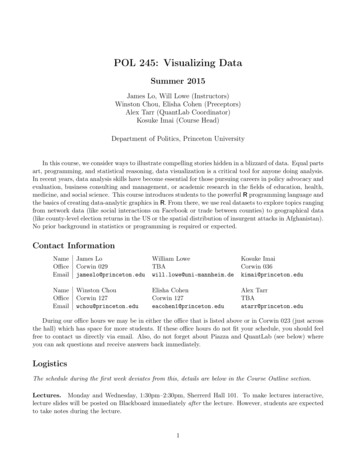
POL 245: Visualizing DataSummer 2015James Lo, Will Lowe (Instructors)Winston Chou, Elisha Cohen (Preceptors)Alex Tarr (QuantLab Coordinator)Kosuke Imai (Course Head)Department of Politics, Princeton UniversityIn this course, we consider ways to illustrate compelling stories hidden in a blizzard of data. Equal partsart, programming, and statistical reasoning, data visualization is a critical tool for anyone doing analysis.In recent years, data analysis skills have become essential for those pursuing careers in policy advocacy andevaluation, business consulting and management, or academic research in the fields of education, health,medicine, and social science. This course introduces students to the powerful R programming language andthe basics of creating data-analytic graphics in R. From there, we use real datasets to explore topics rangingfrom network data (like social interactions on Facebook or trade between counties) to geographical data(like county-level election returns in the US or the spatial distribution of insurgent attacks in Afghanistan).No prior background in statistics or programming is required or expected.Contact InformationNameOfficeEmailJames LoCorwin 029jameslo@princeton.eduWilliam LoweTBAwill.lowe@uni-mannheim.deKosuke ImaiCorwin 036kimai@princeton.eduNameOfficeEmailWinston ChouCorwin 127wchou@princeton.eduElisha CohenCorwin 127eacohen1@princeton.eduAlex TarrTBAatarr@princeton.eduDuring our office hours we may be in either the office that is listed above or in Corwin 023 (just acrossthe hall) which has space for more students. If these office hours do not fit your schedule, you should feelfree to contact us directly via email. Also, do not forget about Piazza and QuantLab (see below) whereyou can ask questions and receive answers back immediately.LogisticsThe schedule during the first week deviates from this, details are below in the Course Outline section.Lectures. Monday and Wednesday, 1:30pm–2:30pm, Sherrerd Hall 101. To make lectures interactive,lecture slides will be posted on Blackboard immediately after the lecture. However, students are expectedto take notes during the lecture.1
Precepts. Tuesday and Thursday, 1:30pm–2:50pm, Frist Campus Center 307, 309, and 329. We ask youto bring your personal laptop to precepts.QuantLabs. Monday, Tuesday, and Thursday, 3:00pm - 4:30pm, Frist Campus Center 307, 309, and 329.(following immediately after the lecture on Mondays and the precepts on Tuesdays and Thursdays) in thesame room as your precepts. You will be working with tutors on review questions, practice exercises, andproblem sets. Bring your own laptop to the QuantLabs.Guest Lectures. Friday, 10:30am–11:50am, Wallace Hall 300. These sessions occur during the secondweek of FSI through the final week. They involve guest speakers from various industries where datavisualization is used.Lunch with Guest Speaker. Friday, 12:00pm–1:30pm, Prospect House. The lunch with the last speakerwill be held at Mediterra, a downtown Princeton restaurant. Students will sign up to have lunch with oneof the five guest speakers at the beginning of the course. During the selected week, students and the courseteam will meet with the guest speaker during a casual, catered lunch.Course Requirements Class participation (15%): Students should actively participate in all aspects of the course. Classparticipation will be judged based on questions asked/answered during the lectures, the precepts,and on the online discussion board. Each portion is equally weighted. Review Questions (15%): During the QuantLab, students will work on the assigned portion ofthe textbook and electronically submit a small set of Review Questions. The answers to ReviewQuestions will be graded pass fail. Details on these assignments are announced at the QuantLab.This is an individual assessment with limited collaboration. Problem sets (50%): Each week will end with the posting of a problem set. These assignmentswill be posted on Thursday at the end of QuantLab via Blackboard. Hard copies of your problem setsmust be turned in at the beginning of the Tuesday precept. Electronic submission of your computercode via Blackboard must also be done by then. Each problem set will be equally weighted. This isan individual assessment with no collaboration. Final Project (20%): This is a group data analysis project. Students will be assigned to groups.Analyzing a data set of their choice, students will write a report of no more than 1,000 words summarizing a compelling relationship or story they identified in the data. No more than 3 figures/tablescan be used. Details regarding the final project will be announced later in the course. This is a groupassessment with collaboration allowed only within the assigned groups.Submission via Blackboard FoldersFor the answers to Problem Sets, students are required to turn in a pdf copy of their answers via assignmentfolders on Blackboard. In addition, students should submit a paper copy of their solutions. The answersshould include the annotated computer code as part of your solutions to the questions. For each assignment,you will submit your code to the appropriate folder as a single file named xxxPSetX.R where xxx is yourNetID and X is the handout/problem set number. For example, it might be kimaiPSet3.R for problem set3.2
Collaboration PolicyThe assignments in this course are designated as individual or group assessments. The degree of permissiblecollaboration depends on the kind of assignment: Review Questions. Students are encouraged to interact with each other, the instruction team, andQuantLab tutors in discussing their approaches and solutions. This includes conceptual discussionand actual computer code. However, for all other assignments, this degree of collaboration is notappropriate! Problem Sets. No collaboration is allowed. Students may ask clarifying questions regarding problem set and midterm questions to the instruction team through Piazza. This allows all students tobenefit from clarifications equally. Clarifying questions about the problem sets may not be asked ofQuantLab tutors, however. Final Project. Students may fully collaborate within their assigned groups, and may discuss theirgroup’s work with other students, the instruction team, and QuantLab tutors.Plagiarism PolicyViolations of the above collaboration policy will be treated as instances of plagiarism. This course willfollow a modified version of the guidelines used for computer science classes here at Princeton. Pleasetake this guideline seriously. In the past, plagiarism cases typically result in one-year suspension fromPrinceton.Programming necessitates that you reach your own understanding of the problem and discover a pathto its solution. Do not, under any circumstances, copy another person’s code. Incorporatingsomeone else’s code into your program in any form is a violation of academic regulations. Abettingplagiarism or unauthorized collaboration by sharing your code is also prohibited. Sharing code in digitalform is an especially egregious violation: do not e-mail your code to anyone.Novices often have the misconception that copying and mechanically transforming a program (byrearranging independent code, renaming variables, or similar operations) makes it something different.Actually, identifying plagiarized source code is easier than you might think. For example, there existscomputer software that can detect plagiarism.This policy supplements the University’s academic regulations, making explicit what constitutes aviolation for this course. Princeton Rights, Rules, Responsibilities handbook asserts:The only adequate defense for a student accused of an academic violation is that the workin question does not, in fact, constitute a violation. Neither the defense that the student wasignorant of the regulations concerning academic violations nor the defense that the student wasunder pressure at the time the violation was committed is considered an adequate defense.If you have any questions about these matters, please consult a member of the instruction team.TextbookThis course uses a draft manuscript of the following textbook.Imai, Kosuke (2015). A First Course in Quantitative Social Science. Under contract withPrinceton University Press.3
The textbook is made freely available to the students via Perusall at https://perusall.com. Studentsmust register first at this site in order to view the textbook. The instruction is available at Blackboard.Due to the copyright issues, this file should not be distributed to those who are not taking this class.Perusall enables students to comment on and ask questions about the textbook directly. We welcomeany feedback including typos, mistakes, and clarifications. Students who provide useful comments andquestions will receive extra credits (up to 10% of the course grade).Statistical SoftwareIn this course, we use the open-source statistical software R (http://www.r-project.org). R can be morepowerful than other statistical software such as SPSS, STATA and SAS, but it can also be more difficult tolearn. A variety of resources will be made available for POL 245 students in order to learn R as efficientlyas possible. To help make using R easier, we’ll be using RStudio (http://www.rstudio.com/)—a userinterface that simplifies many common operations.Get HelpMany students will find the materials of this course to be challenging. As such, students must seekimmediate help when struggling with the course. There are several ways, in which students can getin-person and online help.In-person Help Office Hours: 2:00pm to 3:30pm on Fridays in Corwin 127. You will be able to ask the instructionteam any questions you might have about the course materials. You may also e-mail to set up anappointment outside of the office hours. Problem Set Help Sessions: 7:00pm to 9:00pm on Sundays in Hargadon G001, G002, and G004(located in Baker Hall, Whitman College) and QuantLab, 3:00pm to 4:30pm on Mondays. Tutorswill not give you direct guidance on the actual problem set questions but will help you understandthe concepts required for solving them. R Drop-in Office Hours: 3:30pm to 4:30pm on Fridays, Butler 028. Dima Gorenshteyn will beavailable to answer any questions about R programming. R Workshop: 4:30pm to 6:00pm on Fridays, Butler 028. Dima Gorenshteyn will run a short workshopthat cover tricky R programming concepts introduced in each week. The details of a workshop willbe announced each week.On-line HelpIn addition to office hours and individual appointments, we will be available online to answer any questionsyou may have about the course materials and the problem sets. We use the Piazza discussion forum thatwill be linked on Blackboard course page or accessible directly at http://piazza.com.Before posting your question, please review previous posts to make sure that a similar question has notbeen answered. In accordance with the collaboration policy described above, you should not directly postyour code for a problem set. You should frame your questions in general terms rather than trying to haveus debug your code directly. You may subscribe to the Discussion Forum so that you receive your fellowstudents’ questions and answers to those questions. You should also feel free to respond to questions thatyou can answer. Piazza also has a free smartphone application if you are interested.4
Course OutlineIntroduction: July 21 – July 22During the first two days of the course, you will be introduced to R statistical programming environmentthrough the use of RStudio.Note, the first session on Tuesday, July 21 will be a lecture in Sherrerd Hall 101 and not a precept.The second session on Wednesday, July 22 will be a precept in the Frist Campus Center. The third sessionon Thursday, July 23 will be a lecture in Sherrerd Hall. And, for Friday, July 24 we will hold a precept inFrist Campus Center at 10:30 am. These changes affect only the first week of the course.LectureQuantLabPreceptJuly 21July 21July 22Overview of the courseWork on Chapter 1; Submit Chapter 1 Review Questions 1 and 2Application: Understanding World Population DynamicsCausality: July 22 – July 28We will learn how to infer causality from data. We learn the distinction between randomized experimentsand observational studies. Our applications include the evaluation of strategies for increasing voter turnoutand the effect of class size on educational achievement.QuantLab 1Lecture 1QuantLab 2Precept 1Lecture 2Precept 2JulyJulyJulyJulyJulyJuly222323242728Work on Chapter 2 (2.1–2.4); Submit Chapter 2 Review Questions 1ExperimentsWork on Chapter 2 (2.5–2.7); Submit Chapter 2 Review Questions 2Application: Efficacy of Small-class Size in Primary EducationObservational StudiesApplication: Success of Leader Assassination as a Natural ExperimentMeasurement: July 28 – August 4We consider how to measure public opinion using sample surveys. We also learn about a measurementstrategy regarding latent concepts like ideology. Our applications include surveys in Afghanistan andpolitical polarization in US Congress.QuantLab 1Lecture 1Precept 1QuantLab 2Lecture 2Precept 2July 28July 29July 29July 30August 3August 4Work on Chapter 3 (3.1–3.4); Submit Chapter 3 Review Questions 1Survey SamplingApplication: Political Efficacy in China and MexicoWork on Chapter 3 (3.5–3.8); Submit Chapter 3 Review Questions 2Measurement and ClusteringApplication: Voting in the United Nations General Assembly5
Prediction: August 4 – August 13We learn about prediction starting with the application of US presidential election forecasting. Studentswill be introduced to linear regression and how it is related to causality.QuantLab 1Lecture 1Precept 1QuantLab 2Lecture 2Precept 2QuantLab 11Lecture 8Precept ugust45671011111213Work on Chapter 4 (4.1); Submit Chapter 4 Review Questions 1Prediction and LoopApplication: Prediction Based on Betting MarketsWork
Visualizing the News New York Times 3 8/7 Aaron Strauss Executive Director How Campaigns Use Analytics and Exper-iments to Influence Voters Analyst Institute 4 8/14 Dan Chapsky Advertisement Data Scientist Truth, Beauty and Social Data: Using Open Data Online to Predict Offline Events Facebook 5 8/21 Elizabeth Roodhouse Social Scientist
