Transcription
Trading With MarketTiming IntelligenceAction/Reaction – A Revelation in MarketMovementsBy John Crane
Copyright 2015 John Crane. All rights reservedPublished by Traders Network LLC, Loveland, ColoradoALL RIGHT RESERVED. No part of this publication may be reproduced, stored in a retrievalsystem, or transmitted in any form or by any means, electronic, mechanical, photocopied,recorded or otherwise, without prior written permission of the publisher and the author.This publication is designed to provide accurate and authoritative information in regard to thesubject matter covered. It is sold with the understanding that the author and the publisher are notengaged in rendering legal, accounting, or other professional services.Authorization to photocopy items for internal or personal use, or for the internal or personal useof specific clients, is granted by Traders Network LLC. For more information contact TradersNetwork LLC, at 1-800-831-7654 or www.tradersnetwork.comLimit of Liability/Disclaimer of Warranty: While the publisher and author have used their bestefforts in preparing this book, they make no representations or warranties with respect to theaccuracy or completeness of the contents of this book and specifically disclaim any impliedwarranties of merchantability or fitness for a particular purpose. No warranty may be created orextended by sales representatives or written materials. The advice and strategies contained hereinmay not be suitable for your situation. You should consult with a professional where appropriate.Neither the publisher nor author shall be liable for any loss of profits or any other commercialdamages, including but not limited to special, incidental, consequential, or other damages. Allcharts used courtesy of NinjaTrader mPage 1
DisclaimerDISTRIBUTION IN SOME JURISDICTIONS MAY BE PROHIBITED OR RESTRICTED BYLAW. PERSONS IN POSSESSION OF THIS COMMUNICATION INDIRECTLY SHOULDINFORM THEMSELVES ABOUT AND OBSERVE ANY SUCH PROHIBITION ORRESTRICTIONS. TO THE EXTENT THAT YOU HAVE RECEIVED THISCOMMUNICATION INDIRECTLY AND SOLICITATIONS ARE PROHIBITED IN YOURJURISDICTION WITHOUT REGISTRATION, THE MARKET COMMENTARY IN THISCOMMUNICATION SHOULD NOT BE CONSIDERED A SOLICITATION.The risk of loss in trading futures and/or options is substantial and each investor and/or tradermust consider whether this is a suitable investment. Past performance, whether actual orindicated by simulated historical tests of strategies, is not indicative of future results. Tradingadvice is based on information taken from trades and statistical services and other sources thatTraders Network, LLC believes are reliable. We do not guarantee that such information isaccurate or complete and it should not be relied upon as such. Trading advice reflects our goodfaith judgment at a specific time and is subject to change without notice. There is no guaranteethat the advice we give will result in profitable trades.HYPOTHETICAL PERFORMANCE RESULTS HAVE MANY INHERENT LIMITATIONS,SOME OF WHICH ARE DESCRIBED BELOW. NO REPRESENTATION IS BEING MADETHAT ANY ACCOUNT WILL OR IS LIKELY TO ACHIEVE PROFITS OR LOSSESSIMILAR TO THOSE SHOWN. IN FACT, THERE ARE FREQUENTLY SHARPDIFFERENCES BETWEEN HYPOTHETICAL PERFORMANCE RESULTS AND THEACTUAL RESULTS SUBSEQUENTLY ACHIEVED BY ANY PARTICULAR TRADINGPROGRAM.ONE OF THE LIMITATIONS OF HYPOTHETICAL PERFORMANCE RESULTS IS THATTHEY ARE GENERALLY PREPARED WITH THE BENEFIT OF HINDSIGHT. INADDITION, HYPOTHETICAL TRADING DOES NOT INVOLVE FINANCIAL RISK, ANDNO HYPOTHETICAL TRADING RECORD CAN COMPLETELY ACCOUNT FOR THEIMPACT OF FINANCIAL RISK IN ACTUAL TRADING. FOR EXAMPLE, THE ABILITYTO WITHSTAND LOSSES OR TO ADHERE TO A PARTICULAR TRADING PROGRAMIN SPITE OF TRADING LOSSES ARE MATERIAL POINTS WHICH CAN ALSOADVERSELY AFFECT ACTUAL TRADING RESULTS. THERE ARE NUMEROUS OTHERFACTORS RELATED TO THE MARKETS IN GENERAL OR TO THE IMPLEMENTATIONOF ANY SPECIFIC TRADING PROGRAM WHICH CANNOT BE FULLY ACCOUNTEDFOR IN THE PREPARATION OF HYPOTHETICAL PERFORMANCE RESULTS AND ALLOF WHICH CAN ADVERSELY AFFECT ACTUAL TRADING ding.comPage 2
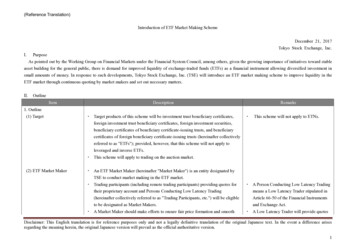
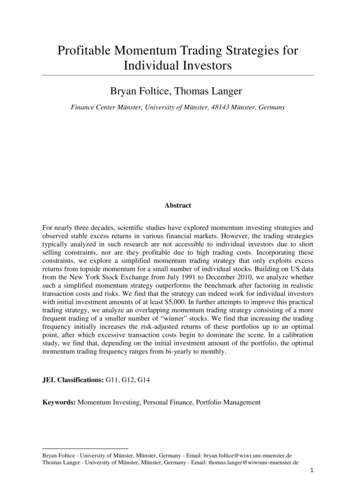
Trading with Market Timing Intelligenceusing Action/ReactionIt is important to note that every market movement is a function of the market moves thatpreceded it and all markets adhere to the laws of Action/Reaction. Even though each market hasits own personality that is unique to itself, all markets will also seek balance, thereforeAction/Reaction will always come into play. Reaction Point uses this price reality as a leadingindicator to provide earlier high probability entries and timely exits.The Reaction swing is the foundation of the entire trading strategy. Everything begins with theReaction swing. Therefore, it is important to understand what a Reaction swing is and how to useit.The Reaction SwingThe Reaction Swing is a price correction (counter-trend price move) within a trending market, and is usedas a timing tool for predicting future reaction points in the price trend. The first Reaction Swing is themeasuring point where counting and forecasting begin. A Reaction Swing should contain at least 3 to 8periods. If the Reaction swing has more than 8 price bars it becomes a complex Reaction swing. Thispattern is very important and is described later.A prediction for a trend reversal is made by performing first a Reverse Count and then a Forward Countfrom a Reaction Swing. Time periods, which appear as bars on a chart, are counted, first going backwardin time and then forward.To predict trend reversals, you first need a trending market. The current trend, up or down, is usuallyobvious by simply looking at a chart, but a series of higher highs and lows, or vice versa, lower highs andlows, defines a trending market. A typical stock or commodities chart which appears on one page orscreen will usually contain enough periods to comprise one or two intermediate trends.A Reaction swing will always begin and end with a pivot point. A pivot point contains aminimum of five consecutive price bars where the highest closing price (for a high pivot)is preceded by two price bars with lower closes and is followed by two consecutive pricebars with lower closes. A low pivot is where the lowest closing price is preceded by two highercloses and followed by two consecutive higher closes. See Figure # mPage 3
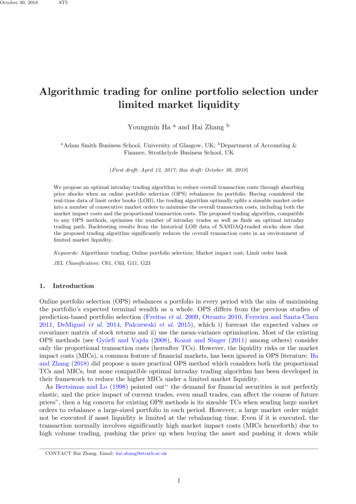
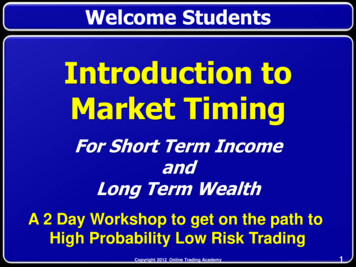
Figure # 1 –Pivot low and Pivot highIn other words, if the market is trending downward, a bearish Reaction swing forms when themarket makes a low pivot and trades higher - against the prevailing trend - followed by a highpivot where the market reverses and resumes the downward trend without trading above theprevious pivot high. The two pivot points mark the beginning and end of the Reaction swingConfirming a Reaction swingA Reaction swing will always begin and end with a pivot. This means a Reaction swing, in adownward trending market, will begin with a low pivot point and end with a high pivot point.The opposite is true for a Reaction swing in an upward trending market. The Reaction swingitself, requires a minimum of three price bars, including the price bar with the lowest closingprice and the price bar with the highest closing price, and at least one price bar in between thetwo pivot points. The swing pattern can contain more than three price bars, but requires aminimum of three. If there are two identical closes at the low or at the high they can be countedas part of the Reaction swing, with the first one created working as the pivot low/high. Threeidentical closes in a row is considered a Reaction swing.The first pivot of a Reaction swing must meet specific conditions to confirm the pivot. First,the low pivot point (in a downward trending market) is preceded by two price bars with higherclosing prices, marked as –1 and –2 in Figures # 2 and #3. These two closing prices do not needto be in any particular order as long as they both are higher than the lowest closing price.However, the price bar that follows the low close (pivot low) will close higher, marked as 1. Assoon as there is a close higher than the pivot low, it sets up a possible low pivot, but it is notconfirmed until there is another closing price above the close of 1. In this example, theconfirmation occurred two bars later when the price bar marked 3 closed above the close of omPage 4
Figure # 2 – A low pivot is confirmed when there is a closing price above the LP (Low Pivot) 1.A Reaction swing begins and ends with the lowest and highest closing prices—always use theclosing price. For example, when a market is trending lower, it will always make a low closingprice before it begins a corrective rally. This is the beginning of a possible Reaction swing.When this corrective rally comes to an end and then resumes the main downward trend, its highpivot point is the price bar with the highest closing price – and marks the end of the Reactionswing.Figure # 3 –Reaction swing begins and ends with closing ing.comPage 5
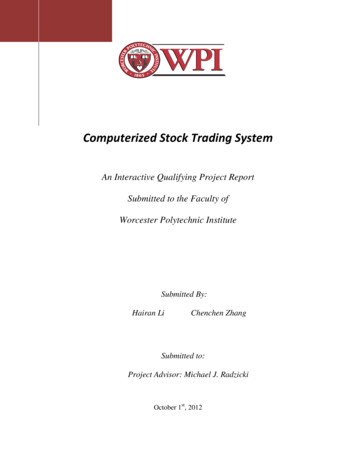
Since the beginning of the Reaction swing started with a low pivot point, the end of theReaction swing is confirmed with a high pivot before the resumption of the downward trend. SeeFigure # 3. The opposite occurs during an upward trending market.Therefore, all you need to know are the date or time of the highest closing price and thelowest closing price of the Reaction swing in order to move on to the next step - projectingfuture turning points or reaction points in the market called Reversal/ Reaction dates or pricebars.In traditional technical analysis, these chart patterns are called flags or pennants. Usually atrader will look at these patterns as a means to estimate the distance the market should move ifand when it breaks out of the pattern. Although this method predicts a good target area, it islimited as it only offers a one-dimensional approach - that of price alone whereas Market TimingIntelligence using Action/Reaction provides direction, time and price.As mentioned earlier, the Reaction swing is the foundation of the Action/Reaction. However,I do not look at the Reaction swing alone. I look at how the Reaction swing interacts with theprice action and price patterns before and after the Reaction swing. The entire cycle is asequence of connected price patterns leading up to the Reaction swing. Then that sequence isused to project forward and extrapolate future direction, duration and distance of the future pricemovement.There are two pattern sequences used. The first pattern sequence appears at major highs andmajor lows and signals a change in the existing trend. This pattern is called the Trend Reversal(TR) pattern sequence.When a market is at a major high or making a major turn, it will typically be followed by apullback to support. This is where bullish traders tend to enter the market expecting anotherbullish leg and a run past the recent high. However, if the market is forming a TR pattern it willrun into resistance somewhere between the 60% and 83% retracement levels and fail to movepast the recent high. This swing pattern failure is the first sign of a market losing momentum andcould lead to a shift in the trend.The TR pattern consists of five pivot points occurring in a specific order with a Reactionswing being formed by the final two pivot points, as shown in Figure # 4. The low pivot, thatfollows the #4 high pivot, is not marked in this illustration. It is not needed at this time, but it isused later to confirm the final Reaction swing of the TR sequence. That is because we do notneed to know this pivot point in order to have a potential signal in place. We only need to knowthe #4 pivot. However, the lower pivot will become important when we are ready to make theTime and Price trading.comPage 6
Figure #4 – TR Pattern Illustrated.All the rules listed below are for a market completing the bearish cycle and in the process offorming a bottom leading into a major trend shift. The same rules are reversed for a marketcompleting a bullish cycle and in the process of forming a major to top leading into a trend shift.See Figure # 5.1- The downward trending market must form a new low pivot, confirmed by the two highercloses as described in the pivot definition. ( marked as #1)2- The market will follow with a short-term counter-trend bounce to form a high pivot(marked as #2) before resuming the downward trend and posting a new low pivot(marked as #3) just beyond the #1 pivot low.3- The market must rally off the #3 pivot low and trade above the close price of the #2pivot. The market does not have to close above the #2 pivot, but only needs to trade equalto or above.4- After trading above the #2 pivot close price, the market should pull back to confirm anew high pivot (marked as #4). When the high pivot # 4 is confirmed with the two g.comPage 7
closes, the TR pattern sequence is in place for a potential buy signal. At this juncture oneof two things will happen. Either the market will continue the downward trend and tradebelow the #3 low or the market will fail to take out the low and reverse the trend andtrade above the #4 point. Either way, the Reaction swing will have an entry in place.Either sell below the #3 pivot low or buy above the #4 pivot high.Figure #5 - This chart show a bullish TR pattern with the initial upward price thrusttrading above the close of the pivot high marked #2.5- A buy stop is placed 1 tick above the high (price) of the #4 pivot. The buy stop remains inplace until it is elected or the market drops to a new low (below the #3 pivot low).6- If the price retraces more than 60% of the distance between the highest price of the #4pivot and the lowest low price at the #3 pivot, the buy stop is lowered and placed 1 tickabove the price bar that breached the 60% retracement level. This allows for an earlierentry. The new long position is risked to 4 ticks below the low of the #3 pivot low. SeeFigure # 6, #7 and comPage 8
Figure #6 - Once the retracement reaches the 60% buy zone the trigger (for a long entry)can be lowered to 1 tick above the high of the price bar the entered the 60% zone. Thisallows for an early entry and reduces the initial g.comPage 9
Figure # 7 - An example of the bearish TR pattern with the initial downward price thrusttrading below the close of the #2 pivot low. All the rules are reversed for the bearish rading.comPage 10
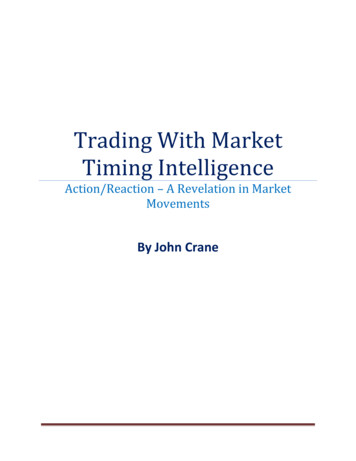
Figure # 8 Another example of a TR pattern with the 1st Reaction swing well above theprevious pivot high. The numbering has been shifted forward because the end of theReaction swing was confirmed with a pivot low ( marked as #4).7- The strength of the signal can be determined by the price action of the signal bar (theprice bar used to confirm the end of the corrective pullback). The more previous closesthe signal bar covers seems to increase the strength of the following price move. I havefound that the signal bar should trade above a minimum of the previous two closes (I callthis a two-close reversal) to confirm the reversal. The more closes the stronger the signal.(Three closes is stronger than two). I do this by visual observation, but I believe this canbe used as a signal strength indicator. (If the market trades below the low of the previousprice bar, before turning higher and trading above the two previous closes, it adds morecreditability to the signal.) See Figure # omPage 11
Figure # 9 – Two-close reversal.8- The signal bar is the price bar that forms immediately following the pivot low (the pricebar with the lowest closing price). If the signal bar is an “inside” price bar, the next pricebar is used as the signal bar. (*The trader can choose to keep the buy stop in place, abovethe pivot high, or place the stop 1-tick above the high of the signal bar for an earlierentry.) The rules are reversed in an upward trending market.I break the TR-pattern into two different types, based on how the initial price thrust off the lowunfolds. This is important because they have different rules to confirm an entry signal. The firstpattern setup (already described) needs the market to trade above the closing price of the #2pivot. The second pattern occurs when the market fails to trade above the closing price of the #2pivot.In this case, the rules are as follows:If the first upward price thrust—off the #3 pivot low---fails to trade above the highest close ofthe #2 pivot before the market confirms a #4 high pivot, the TR pattern sequence has not beenconfirmed and needs further confirmation. One of the following criteria is also needed for furtherconfirmation in addition to the rules previously rading.comPage 12
1- If the initial price thrust, off the #3 low, does not trade above the close price of the #2pivot, the price action of the signal bar becomes more important. To signal a new entry,the market must have retraced more than 60% of the distance between #4 to #3 and be atwo-close reversal to become a valid entry signal. If this new entry signal is notconfirmed, wait for a second reaction swing to form. As shown in Figure #10.2- A second Reaction swing can occur either above or below the close of the #2 pivot high.It can also be a smaller Reaction swing that forms inside the high and low of the previousReaction swing. The pivot high of the new (second) Reaction swing will also become thenew trigger price for the long entry. The rules for the signal bar also apply here.Figure # 10 – Double patterns3- The trigger price, for the buy signal, is 1 tick above the highest price of the most recentpivot high. (The 60% rule can also be applied here).4- If the second pattern is needed to confirm the pattern, the numbering sequence is nttrading.comPage 13
Trade Strength Confirmation (after the entry)The strength of the trade signal can be measured by observing the price action after the markethas penetrated the trigger price (buy stop). The first price bar to trade through the trigger priceand elect the buy stop should close above the high of the Reaction swing pattern. (If the pricetrades through the trigger price and reaches a new high, but pulls back to close inside theprevious Reaction swing pattern – below the highest price of the Reaction swing and above thelowest low of the Reaction swing - the market is showing a loss of momentum and could beready to fail. (This price action scenario is addressed later).If the initial (signal bar) price bar closes at or above the higher price of the Reaction swing, theposition is held with the stop loss underneath the newly confirmed pivot low. A second price barclose above the Reaction swing high, adds strength to the breakout signal with a third higherclose considered a very strong signal confirmation. Aggressive traders can use the third close assignal to add to positions. (The stop loss can be raised to just below the following price bar eachtime the new price bar trades above the high of the previous price bar.) The three higher closesallows for aggressive stop loss movement to breakeven or placed underneath the low of the firstprice bar with the entire price range above the pivot high. See Figure # 11.Figure # 11 – After the g.comPage 14
Swing Pattern FailureThe market will also signal to the trader when it is a weak signal and setting up for a failure. Ifthe trader is aware of this failure, they can adjust their risk management accordingly and eventake advantage of the failure. This price pattern can be a very important signal pattern and shouldbe watched carefully. Markets can make significant price moves in the opposite direction after aswing pattern failure.The rules listed below are for a market that has bottomed and is in an upward trend.Once again, it begins with the initial price thrust through the trigger price to elect the buy stopand enter a long position. When the market pushes through the trigger price it has traded abovethe Reaction swing high and reached a new high of the price move. However, if the market failsto hold this new high and falls back to close lower than the Reaction swing high, the price actionis signaling weakness and setting up for a failure and possible significant price movement in theopposite direction. This failure can occur on the first thrust price bar or one of the next two pricebars. Here are rules for a swing pattern failure when the market is trading higher and has justtriggered a buy stop to enter a long position. As shown in Figure # 12.1-The initial price bar holds the gains and closes above the high of the Reaction swing, but thefollowing price bar closes as an “inside” price bar. (Inside price bar means the high of the pricebar is below the high of the previous price bar and the low is above the low of the previous pricebar, therefore the entire price range remains “inside” the price range of the previous price bar.”)(Type #1)2- The initial price bar needs to penetrate the pivot high and trigger the buy stop, to confirm theReaction swing as it makes a new high for the current price move. The initial price bar fails tohold the new gains and falls back to close below the Reaction swing high. (Type #2)3- If the criteria outlined in #1 or #2 are met, look for the market to trade below the low of theinitial price bar to confirm the swing pattern failure. This is where the stop loss should be placedwhen the buy signal is first elected.Aggressive traders can use this price level to reverse positions and enter a new short position totake advantage of continued weakness in the ing.comPage 15
Figure # 12 - The Swing Pattern failure, typically appears at major turning points in the marketand helps identify a TR pattern.If you look at several TR patterns sequences you will notice that almost all of the major tops orbottoms, leading into a TR pattern reversal, begin with a failed swing pattern and the #3 point isthe initial thrust price bar that either fails or is followed by an “inside” price bar. Figure # comPage 16
Figure # 13 - The major low and major high both began with a Swing pattern failure.Trend Continuation (TC) PatternsThe Trend Continuation (TC) pattern sequence appears inside a trending market and addsconfirmation to the trend. Understanding how to use the TC pattern allows the trader to hold acurrent position, enter a new position or add to a current position with added confidence. The TCpattern is simple in structure, yet can be very powerful when used properly. As shown in rading.comPage 17
Figure # 14 – TC pattern sequence illustratedHere are the rules to identify a bullish (upward trending market) TC pattern:1- A TC pattern follows a TR pattern and will usually begin in the reaction zone projected fromthe reverse/forward count of the TR pattern.2- The bullish TC pattern begins with a high pivot (formed as the market pulls back from a newhigh (marked at #3) and end with a low pivot that is formed as the market resumes the existingtrend and leaves a low pivot, (marked as #4). See Figure #15 and .comPage 18
Figure # 15- A bullish TC pattern has formed between the #3 and #4 pivots.1- Once the high pivot has been confirmed (see rules to confirm Reaction swing) the buy stopcan be placed 1 tick above the highest high of the pivot that forms the beginning of the Reactionswing.2- The 60% rule can also be applied to the TC pattern and remains in play unless the markettrades more than 5 ticks below the low of the previous Reaction swing.3-The rules for signal pattern strength confirmation also applies to the TC pattern.4-The rules are reversed for a downward trending ing.comPage 19
Figure #16 - This chart shows two consecutive TC patterns. The first pattern began with the #1pivot low and ended with the #2 pivot high. The second began with the low pivot at #3 and endedwith the #4 pivot. They both followed the bearish TR pattern.Trend Continuation (TC) Patterns - Complex1-The Reaction swing that forms a TC pattern contains a minimum of three price bars (includingthe price bar with the highest closing price and the price bar with the lowest closing price). Areaction swing can contain as many as eight price bars. (See Figures #16, #17and # 18).2-A TC pattern with more than eight price bars will have a zigzag (small Reaction swing pattern)inside the larger Reaction swing that forms the TC pattern. This type of TC pattern is called acomplex TC pattern, also known as the A-B-C continuation pattern and can mark the center ofthe longer-term trend. This pattern can be a very powerful Time and Price rading.comPage 20
Figure #16 - A complex TC pattern will have more than eight price bars and contain a smallzigzag pattern in the center of the ding.comPage 21
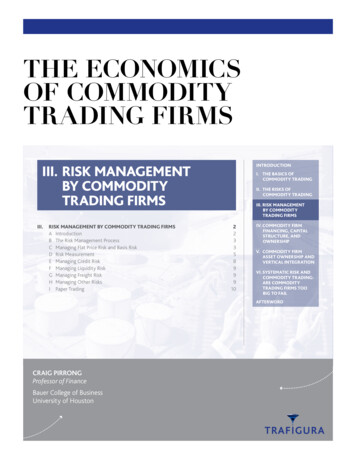
Figure # 17 - September Emini S&P – (5-minute chart) with a complex TC pattern illustrated.Figure # 18 – Complex TC (A-B-C Continuation) marked the center of the longer-term ng.comPage 22
Live trade examplesCrude Oil Trade Sequence Signal #1– The market had just traded out of the three-wave zigzagpattern and formed a bearish reaction swing. A sell stop was placed underneath price bar so themarket would trade below the previous two consecutive closes to trigger the g.comPage 23
Crude Oil Trade Sequence Signal #1 – The short position was closed when the market enteredthe projected reaction g.comPage 24
Crude Oil Trade Sequence Signal #2 – The market has formed a bullish TR pattern andconfirmed a high pivot (marked as (a)). The trend is bullish (green bars) The (a) pivot marks thebeginning of a reaction swing so a buy stop is placed above the (a) pivot high.The market forms a lower pivot high (b) so the buy stop is lowered to the (b) pivot high. Asmaller reaction swing forms inside the larger reaction swing. The buy is rading.comPage 25
Crude Oil Sequence Trade Signal # 2 – The market advanced into the projected reaction barand began to trade sideways. The sell stop (profit stop) was raised and placed underneath thelow of the reaction bar. The sell stop is moved to the low of the next price bar each time themarket trades to a new high. This process continues until the long position is ing.comPage 26
Crude Oil Trade Sequence Signal # 3 – The market turned lower and formed a new reactionswing. A sell stop was placed underneath the previous two closing prices. The sell was triggeredwith a wide range price bar.The short position was covered when the market retraced to the PFI (20-bar EMA) and tradedabove the previous highs. (Note: the short position should have been held because the marketwas still in a bearish mode and the market never posted more than three closes above PFI orabove previous pivot g.comPage 27
Crude Oil Trade Sequence Signal #4 – Entered new short position when market traded belowthe previous two closing prices. Protective stop is placed above the swing high.The short position was closed after market did not make a new low inside the reaction zone andtraded up to the buy stop that had been ding.comPage 28
E-Mini S&P Trade Sequence – The market posted a low at (B) and traded to a high at (C), toform a bullish TR pattern. A buy stop was placed at the (C) pivot high. (The buy stop was notlowered because the price did not pull back to the 60% level before trading higher.) The longposition was entered and protective stop placed underneath the (D) pivot low.A new TC pattern formed between (E) and (F) so a buy stop was placed above price bar of theprevious two closes. The PFI is bullish and market structure is bullish (green bar), suggestingthe market should advance. The long position was entered when the buy stop was triggered andthe protective stops placed underneath the (F) swing low.The market advances into the reaction zone and makes new high. The protective stops are movedand placed underneath the low of the reaction bar inside the zone. (At this level, I will make thedecision to exit at the market or let the market be stopped out). In this case, the stop loss israised each time the market makes a new g.comPage 29
Eurocurrency Trade Sequence – Market posts a high (B), followed by a low (C) below theprevious swing low to confirm a TR pattern. The original sell stop was placed underneath the(C) pivot low. The sell stop was raised and placed underneath the low of the price bar thatreached the 60% retracement level between the (B) high and the (C) low.A short position was entered as the sell stop was rading.comPage 30
Eurocurrency Trade Sequence – The market trades lower and posted a pivot low (E) inside theprojected reaction zone. The short posi
efforts in preparing this book, they make no representations or warranties with respect to the . The Reaction swing is the foundation of the entire trading strategy. Everything begins with the Reaction swing. Therefore, it is important to understand what a Reaction swing is and how to use . This