Transcription
WP-2014-023The causal impact of algorithmic trading on market qualityNidhi Aggarwal and Susan ThomasIndira Gandhi Institute of Development Research, MumbaiJuly -023.pdf
The causal impact of algorithmic trading on market qualityNidhi Aggarwal and Susan ThomasIndira Gandhi Institute of Development Research (IGIDR)General Arun Kumar Vaidya MargGoregaon (E), Mumbai- 400065, INDIAEmail(corresponding author):susant@igidr.ac.inAbstractThe causal impact of algorithmic trading on market quality has been difficult to establish due toendogeneity bias. We address this problem by using the introduction of co-location, an exogenous eventafter which algorithmic trading is known to increase. Matching procedures are used to identify amatched set of firms and set of dates that are used in a difference-in-difference regression to estimatecausal impact. We find that securities with higher algorithmic trading have lower liquidity costs, orderimbalance, and order volatility. There is new evidence that higher algorithmic trading leads to lowerintraday liquidity risk and a lower incidence of extreme intraday price movements.Keywords: Electronic limit order book markets, matching, difference-in-difference, efficiency,liquidity, volatility, flash crashesJEL Code: G10, G18Acknowledgements:The authors are with the Finance Research Group, IGIDR. Authors email: nidhi@igidr.ac.in, susant@igidr.ac.in. An earlier draftof the paper was titled: Market quality in the time of algorithmic trading. We are grateful to the National Stock Exchange of India,Ltd. for research support. We thank Chirag Anand for technical inputs, Corey Garriot and Ajay Shah for inputs into the researchdesign, and Venkatesh Panchapagesan for comments and suggestions. We are also grateful to the participants of the 4th EmergingMarkets Finance, 2013, conference, the 1st SEBI International Research Conference, 2014, and the NSE Research Seminar Seriesfor useful comments and suggestions. All errors and omissions remain our own and not that of our employer.
The causal impact of algorithmic trading onmarket qualityNidhi Aggarwal Susan ThomasJuly 2014AbstractThe causal impact of algorithmic trading on market quality hasbeen difficult to establish due to endogeneity bias. We address thisproblem by using the introduction of co-location, an exogenous eventafter which algorithmic trading is known to increase. Matching procedures are used to identify a matched set of firms and set of datesthat are used in a difference-in-difference regression to estimate causalimpact. We find that securities with higher algorithmic trading havelower liquidity costs, order imbalance, and order volatility. There isnew evidence that higher algorithmic trading leads to lower intradayliquidity risk and a lower incidence of extreme intraday price movements.JEL classification: G10, G18Keywords: Electronic limit order book markets, matching, difference-indifference, efficiency, liquidity, volatility, flash crashes The authors are with the Finance Research Group, IGIDR. Authors email:nidhi@igidr.ac.in, susant@igidr.ac.in. An earlier draft of the paper was titled: “Market quality in the time of algorithmic trading”. We are grateful to the National StockExchange of India, Ltd. for research support. We thank Chirag Anand for technicalinputs, Corey Garriot and Ajay Shah for inputs into the research design, Venkatesh Panchapagesan and Raghavendra Rau for comments and suggestions. We are also gratefulto the participants of the 4th Emerging Markets Finance, 2013, conference, the 1st SEBIInternational Research Conference, 2014, and the NSE Research Seminar Series for usefulcomments and suggestions. All errors and omissions remain our own and not that of ouremployer.1
Contents1 Introduction32 Algorithmic trading and market quality53 Research setting3.1 A clean microstructure . . . . . . . . . . . . . . . . . . . . . .3.2 A unique dataset . . . . . . . . . . . . . . . . . . . . . . . . .3.3 An exogenous event: Introduction of co-location facilities . . .66784 Measurement4.1 AT intensity . . . . .4.2 Market quality . . .4.2.1 Liquidity . . .4.2.2 Risk . . . . .4.2.3 Efficiency . .4.2.4 Extreme price. . . . . . . . . . . . . . . . . . . . . . . . . . . . . . .movements.5 Research design5.1 Addressing endogeniety: selecting the sample period .5.2 Addressing endogeniety: selecting matched securities5.3 Threats to validity: changes in the macro-economy .5.4 The difference-in-differences regression (DID) . . . . .8. 8. 9. 9. 10. 11. 11.1212141517.6 Data186.1 Matched sample of stocks . . . . . . . . . . . . . . . . . . . . 206.2 Matched sample of dates . . . . . . . . . . . . . . . . . . . . . 227 Results7.1 The7.2 The7.3 The7.4 Theimpactimpactimpactimpactononononliquidity . .volatility . .efficiency . .extreme price. . . . . . . . . . . . . . . . . . .movements.24242426268 Robustness tests278.1 Simulating a placebo . . . . . . . . . . . . . . . . . . . . . . . 288.2 Testing sensitivity to match design . . . . . . . . . . . . . . . 289 Conclusion292
1IntroductionTechnology has played an increasingly important role in the developmentof securities markets since the 1990s. It was readily embraced in the backend functions of clearing and settlement at exchanges, but it has played amore controversial role in the trading process. Earlier, in the 1970s, therewas much debate about moving from open outcry markets to electronic limitorder book markets. The latter became accepted as the dominant form oftrading only in the last decade. A similar controversy now marks the debateon the role of algorithmic trading in exchanges, where computer algorithmsdirectly place orders to trade. Policy makers, who largely encouraged theuse of technology by mandating best execution practices for investors in the1990s, are now exploring interventions to curb high frequency trading, in the2010s.How algorithmic trading (AT) affects the quality of securities markets hasbeen extensively analysed previously. These analyses, however, faced challenges in establishing causal linkages between changes in AT and changes inmarket quality (Biais and Foucault, 2014). Using a novel dataset and marketsetting, we set out to address some of these challenges.One of the abovementioned challenges is the preponderance of fragmentedtrading. In markets such as those in the U.S. which is the focus of mostof the research work in this field, trading takes place at numerous venues,each with varying market access and microstructure. This makes it hard tounderstand the causal impact of any single microstructure feature, such asalgorithmic trading, on any one trading venue. In contrast, the setting in thispaper is the National Stock Exchange in India, where most of equity spottrading and all the derivatives trading is concentrated at a single exchange,for the duration of the analysis.A second challenge is the lack of clear identification of orders and tradesas being generated by algorithms. Much of the existing research is based onproxies of algorithmic trading which leads to weak identification (Hendershottet al., 2011; Hasbrouck and Saar, 2013). Where there is better identification,the datasets are restrictive. Either the sample of securities is limited, or theperiod under study is short (Hendershott and Riordan, 2013). In contrast,the data in this paper has every order, and the counter-party order on everytrade, flagged by the exchange as being AT or not, for all the securities thattraded, for five years.A third challenge is in establishing causality. The problem of endogeniety3
arises because other unobserved factors can be the common cause for highalgorithmic trading and high levels of market quality on a security.This paper has three advantages in establishing a causal link between AT andchanges in market quality. The first advantage is an exogenous identificationevent when the exchange commissioned co-location facilities (co-lo). Such anevent directly affects the level of algorithmic trading, but not market quality.The second advantage is wide span of data which permits the use of matching techniques to select a sample of dates in the pre co-lo and post co-loperiods that have similar macroeconomic conditions. This ensures comparability without requiring assumptions about functional forms to be used asregression-style controls.The last advantage is the comprehensive coverage on the securities traded onthe exchange, that can be used to control for endogeniety bias. A propensity score matching algorithm is used to identify pairs of securities that arematched on firm characteristics such as size, price and returns volatility butdiffer on the amount of AT. The securities which have a large change in thelevel of AT activity after co-lo are the treated group. The control group aresecurities with AT activity that was similar to the treated security beforeco-lo, but did not show a significant change in AT activity after co-lo. Adifference-in-differences regression is used to estimate the change in marketquality of the treated relative to control securities. Any significant differencesbetween the two can be attributed to AT.The estimated coefficients show that, on average, higher AT causes bettermarket quality. This includes lower impact costs, larger number of sharesavailable for trade, lower imbalance between the number of shares availableto buy and sell, and a sharp drop in price volatility. The depth (measured bythe monetary value available to trade) is not significantly affected by higherAT at the touch (best bid and offer).This paper adds new evidence to the literature about the causal impact of ATon the stability of market price and liquidity. Policy makers and regulatorsoften voice concerns that the higher level of liquidity is transient because ATexits the market rapidly when there is unexpected news. Their main criticismis that AT causes a higher probability of extreme drops and reversals overa very short period of time during the trading day. The estimates in thispaper show that AT lowers intraday liquidity risk. It also shows that higherAT leads to a lower incidence of extreme price movements during the tradingday.This paper presents results that are consistent with the existing literature,4
as well as new evidence. We use a dataset that overcomes the challenges inidentification of and a research design that addresses the endogeniety bias toproduce the closest attempt thus far on establishing the causal impact of ATon market quality.The remainder of the paper is organized as follows: Section 2 summarizesthe literature. Section 3 provides a brief detail on the institutional framework. Section 4 discusses the identification of algorithmic trading activityand various market quality measures. Section 5 describes the approach usedfor analysis in detail. Section 6 describes the process of sample selection,and presents summary statistics about the final sample. Section 7 presentsthe estimation results, followed by Section 8 which test the robustness of theestimates. Section 9 concludes.2Algorithmic trading and market qualityThe rapidly expanding literature on algorithmic trading (AT) focuses onwhether such trading enhances the ability of markets to improve long terminvestor welfare and capital efficiency for firms. Theory suggests that highfrequency trading, a subset of AT, can have both positive and negative contributions. The positive contribution is in transmitting information morerapidly into market prices (Jovanovic and Menkveld, 2010; Martinez andRosu, 2013), and improving market liquidity (Hoffmann, 2012; Foucault,1999). The negative contribution is in increasing adverse selection costsfor existing (non-algorithmic) traders which can have negative externalities(Biais et al., 2013; Cartea and Penalva, 2012).Empirical research finds more consensus. A higher presence of AT is correlated with lower costs of liquidity as well as lower short term volatility(Hendershott et al., 2011; Hasbrouck and Saar, 2013). Others find higherprice efficiency and liquidity with higher levels of HFT, particularly aroundtimes of market stress (Menkveld, 2013; Carrion, 2013; Brogaard et al., 2012;Chaboud et al., 2009), and that AT demands liquidity when it is cheap andsupplies it when liquidity is scarce (Hendershott and Riordan, 2013; Carrion,2013).But this literature comes with well documented limitations (Biais and Foucault, 2014). One limitation is that much of the empirical analysis is donewithout explicit identification of AT. Recent data has better identificationbut are restricted to either very few securities or a short period of time. For5
example, Hendershott and Riordan (2013) studies 30 DAX securities for 13days.A greater limitation is that the literature has not readily established causallinks between AT and market quality because of the inherent endogeneitywhich makes it difficult to determine the direction of causality. For example,when news arrives, there can simultaneously be an increase in AT activityon a security and an increase in the observed market liquidity. The commonfactor – information arrival – is what causes the change in both. It wouldbe misleading to make a causal inference based purely on a high correlationbetween AT and market liquidity in this case.One approach to counter this endogeneity bias is to use an exogenous eventthat is expected to directly affect the extent of AT, but not (say) marketliquidity. These events then become instruments to identify the direction ofcausality between AT and the market quality variable. Riordan and Storkenmaier (2012) analyse the effect of a drop in latency at the Deutsche Bourse,and find the event is correlated with decreased spreads and higher price efficiency.1 Bohemer et al. (2012) uses the introduction of co-location at 39exchanges worldwide, and find that higher AT is correlated with higher market liquidity and efficiency.While these strengthen the argument for links between higher AT and better market quality, the community of policy makers and practitioners remainunconvinced and mistrustful of the role of AT. If the reason lies in these limitations of the restricted datasets and the persistence of endogeniety problems,we present a research setting that uses a market microstructure and a uniquedataset to counter these issues.3Research settingThis paper draws on three strengths. First, it uses a microstructure setting where most spot trading and all derivatives trading takes place at oneexchange. Second, the underlying data infrastructure precisely flags everyorder and the counterparties of every trade as coming from an algorithmicsource (marked at) or not. Third, it uses the exogenous event when colocation facilities were introduced on the exchange, and market quality can1Studies such as Viljoen et al. (2011), Frino et al. (2013) also examine the impact ofAT on the futures market around such events and find a positive effect of AT on marketquality.6
be measured and analysed both before and after this event.3.1A clean microstructureThe market on which we analyse the impact of AT on market quality is oneof the three exchanges2 trading equity in India: the National Stock Exchange(NSE). The NSE is one of the highest ranked equity markets in the worldin terms of transaction intensity (WFE, 2012). Unlike in the U.S., whereequity trading is fragmented across multiple platforms, the NSE has thelargest share of the equity market activity in India.3 These features helpto address one of the limitations pointed out by Biais and Foucault (2014),that most of the existing studies rely on a single market or a single asset, andthat the lack of cross-market data can affect inference because high frequencytraders are likely to take positions in multiple markets at the same time.The NSE spot market is an electronic limit order book market, which tradesaround 1500 securities. All trades are cleared with netting by novation atthe clearing corporation and settled on a T 2 basis. Trades that are offsetwithin the day account for roughly 70% of the turnover. Of the trades that aresettled, typically around 10-15% are done by institutional investors. Thus,most of the trading can be attributed to retail investors or proprietary tradingby securities firms.3.2A unique datasetOur analysis uses tick by tick dataset of all equity orders and trades from theNSE for a five-year period, 2008 to 2013. The NSE disseminates informationabout trades and orders, with prices and quantities that are time-stamped tojiffies. In addition to other information,4 each order and trade is also taggedwith an AT flag that allows us to identify if the order/trade originated froman AT or a non-AT.This is in contrast to prior literature where the impact of AT is observedby proxy, either through electronic message traffic (Hendershott et al., 2011;2The other two are the Bombay Stock Exchange and Multi-commodity Stock Exchange.75% of the traded volumes on the Indian equity spot market and 100% of the tradedvolume on equity derivatives took place on the NSE during the period of our analysis(SEBI, 2013).4This includes tags for special orders such as “Stop-Loss”, “Immediate Or Cancel” and“Hidden orders”.37
Bohemer et al., 2012) or RunsInProcess using the number of linked messagesper 10-minute intervals (Hasbrouck and Saar, 2013). The closest direct measure of algorithmic trading is where the exchange identifies trading firms as‘engaging primarily in high frequency trading’, such as that used in Brogaard(2010); Brogaard et al. (2012); Carrion (2013). However, because the dataare available only on 120 randomly selected securities that the high frequencyfirms trade in, these do not comprise the comprehensive set of all high frequency trades in the market. Another example is described in Hendershottand Riordan (2013), which uses data that contain all AT orders at the German exchange DAX but that only include 30 securities over 13 trading days.In comparison to these samples, the data from NSE are not so restricted; allsecurities for the entire period are covered.3.3An exogenous event: Introduction of co-locationfacilitiesAutomated order placement began in India with a few securities firms thatused technology for equity spot arbitrage between the NSE and the BombayStock Exchange (BSE). Even after the securities regulator issued regulationsgoverning AT in April 2008 (SEBI (2008)), the level of AT remained low.5A significant change in the amount of AT came with the introduction ofco-location facilities at the NSE in January 2010, suggesting that the earliertechnology was a bottleneck to effective AT. After co-location was introduced,latency dropped from 10-30 ms (milliseconds) to 2-6 ms, giving traders whoestablished automated systems in the co-location facility a significant edge.This clear shift in technology on a well-identified date serves as an identification mechanism for the change in the level of AT intensity in the market.4MeasurementWe use this research setting to innovate on measurement and research designin order to obtain causal inference. We start with the measurement of thelevel of AT intensity in the market and follow by measures of market qualitycalculated from the trades and orders data.5Indian markets slowly warming up to algorithmic trading, The Mint, July 14 20098
4.1AT intensityBoth orders and trades data for all securities are tagged as AT by the NSE.6We use trades data to calculate the AT activity for a security based on thenumber of trades, where the algorithmic trader can be the buyer or the seller,or both. This is calculated over a fixed interval of time within the trading dayto obtain a discrete measure of the AT activity for a security, at-intensity.at-intensityi,t is calculated as the fraction of the AT trades in security itaking place within a five-minute interval asat-intensityi,t 100 ttvAT,i,tttvi,twhere ttvAT,i,t is the traded value of AT trades in the tth time interval andttvi,t is the total traded value of all trades in the same period.4.2Market qualityAccess to high frequency data at the order level for each security allows formeasures covering three dimensions of market quality: liquidity, volatilityand efficiency. While the measures of market liquidity and volatility arecommon to the rest of the literature, to our knowledge, this paper is the firstto analyse the intraday volatility of liquidity and extreme price movements.4.2.1LiquidityMarket liquidity is measured in two parts, transactions costs and depth.Transactions costs denote the price of immediacy, measured as the cost executing a market order, and are higher for less liquid markets. Depth measuresthe number of shares available for trade at any given point in time and islower for less liquid markets. Given access to the full limit order book fora security, there are various levels at which the available depth can be measured. In keeping with the rest of the literature, we measure depth both asvalue of shares as well as as number of shares available for trading.6The identification is done at the level of the I.P. address of the computer from wherethe order is generated.9
Transactions costs:a) Quoted Spread (qspread): the difference between the best ask and the bestbid price at any given point of time. The spread for security ‘i’ at time ‘t’,qspreadi,t 100 (PBestAski,t PBestBidi,t )(PBestAski,t PBestBidi,t )/2b) Impact Cost (ic): ic to measure the transaction cost for a market orderof size Q that is larger than what is available at the best price. icQi,t forsecurity i at time t is calculated as: icQi,t 100 PQi,t PMi,tPMi,tPBestAski,t and PBestBidi,t are the best ask and bid prices, respectively, att. PQi,t is the execution price for a market order of Q, and PMi,t is themid-quote price. In our analysis, Q USD 500, or Rs 25,000, which is theaverage size of equity spot market transactions at NSE.The more liquid the market is, the lower the transactions costs are.Depth:c) The value available for trade at the best bid and ask price, top1depthi,t PBestBid,i,t QBestBid,i,t PBestAsk,i,t QBestAsk,i,td) The value available for trade at the best five bid and ask price, top5depthi,t Σ5k 1 PBid,k,i,t QBid,k,i,t Σ5k 1 PAsk,k,i,t QAsk,k,i,te) The total number of shares available for trade in the full limit order bookTSQi,t TBQi,tfor security i, depthi,t 2f) The difference in the total number of shares available for buy and sell,(TSQi,t TBQi,t ) 200oibi,t TBQ TSQi,ti,tPBestAski,t and PBestBidi,t are the best ask and bid prices, respectively, ofsecurity ‘i’ at time ‘t’. TSQi,t is the total quantity of shares available on thesell side and TBQi,t that on the buy side.For top1depth, top5depth, and depth, the more liquid the market, thelarger the values of the measure. For the oib, a more liquid market isassumed to be balanced between the quantity available for buy and selltransactions. A more liquid market is assumed to have oib 0.4.2.2RiskTwo aspects of market risk are observed from the limit order book, price riskand liquidity risk. This allows for three measures of market risk:10
g) Price risk (rvol): The variance of intraday returns, where returns are calculated using traded prices at a frequency of one-second as:s2Σ300j 1 (ri,t,j r i,t )rvoli,t n 1where ‘t’ indexes the five-minute time interval within the trading day and‘j’ indexes one-second time intervals within each five-minute interval. ri,tindicates the mean returns within the five-minute interval, t.h) Price risk (range): The difference between the highest and the lowest midquote in a five-minute interval, expressed as a percentage of the mid-quoteprice (Hasbrouck and Saar, 2013):rangei,t 100 Max(Pi,t ) Min(Pi,t )PMi,twhere ‘t’ indexes the five-minute time interval within the trading day, Max(Pi,t )indicates the maximum price of security ‘i’ interval ‘t’, Min(Pi,t ) indicatesthe minimum price of that security in that interval, and PMi,t indicates themid-quote price of that security in the same interval.The range provides a robustness check on the rvol.i) Liquidity risk (lrisk): The volatility of the impact cost of transaction of afixed size, Q. Since the impact cost can be measured at multiple time pointsduring the trading day, we calculate the standard deviation of ic(Q)i,t forfive-minute intervals. This measures the intraday liquidity risk.s2Σ300j 1 (ici,j ici,t )lriski,t n 1‘t’ indexes the five-minute time interval, while j indexes the one-second timepoints within interval t. ici,t is the average ic(q) of the five-minute interval.4.2.3EfficiencyWe use the variance ratio to measure market efficiency:j) Variance Ratio (vr): The ratio of 1/k times the variance of the k-periodreturn to the variance of the one-period return (Lo and MacKinlay, 1988).2(k)]vr(k)i σk·σ[r2t[rt]where rt is the one-period continuously compounded return, rt (k) rt rt 1 . . . rt k . k indicates the lag at which the variance ratio (vr) is to becomputed. In this paper, we calculate vr at k 2. We do not expect vr tobe significantly different from 1 in an efficient market.11
4.2.4Extreme price movementsA fear amongst policy makers is that AT causes higher price instability, whichhurts investors. We measure this using the kurtosis of the returns.k) Kurtosis (kurtosis): The incidence of extreme price movements. kurtosisi,t 4ΣNj 1 (ri,t,j r i,t )(n 1)σr4i,twhere ri,t,j denotes the returns in the five-minute interval, ‘t’ for each second,j represents the observations within the interval from 1 . . . N , and σri,t represents the standard deviation of returns in that five-minute interval. Whenthe kurtosis is greater than 3, it indicates that the returns distribution hasfatter tails, which implies a larger incidence of extreme price movements.A higher tail risk will imply that the kurtosis value is significantly differentfrom 3.5Research designTwo features of the research design address the endogeniety bias. The firstidentifies an exogenous event that effects AT but not market quality andidentifies the sample period chosen for the analysis. The second identifiespairs of securities that are matched except for the AT intensity and identifiesthe sample subset of securities.5.1Addressing endogeniety: selecting the sample periodRiordan and Storkenmaier (2012) and Bohemer et al. (2012) use an exogenousevent as an instrument to identify periods where AT activity is different, butwhere market quality would otherwise be unchanged. We follow a similarapproach. The NSE introduced co-location facilities (henceforth referred toas co-lo) in January 2010. The standard event study would analyse marketquality changes immediately before and after this date. However, if differentmarket participants adjust to the co-lo at a different pace, we expect thatany change in AT intensity would stabilise after the overall market adoptionof co-lo, much after its introduction. If the change in AT has not stabilised,related changes in market quality may not be fully measured.12
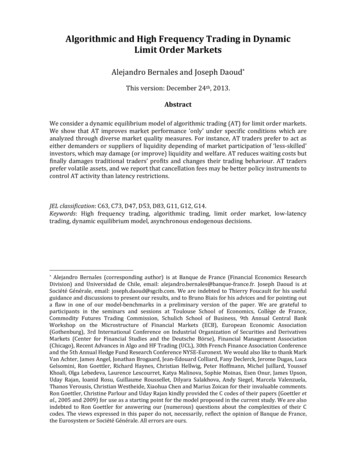
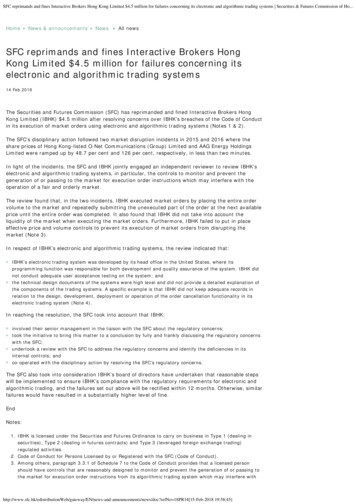
Figure 1 AT intensity between 2009 and 2013The graph shows AT intensity for the overall equity spot market at NSE between 2009and 2013. AT intensity is measured as a fraction of the total traded value of AT tradesin a day vis-a-vis the total traded value on that day. The dotted line shows the date onwhich co-lo was introduced by NSE.5040301020AT Intensity (%)6070Start ofco lo20092010201120122013Figure 1 plots the daily average AT intensity for the overall market, from2009 to 2013. The AT intensity was around 20% before the introduction ofthe co-lo in January 2010 (marked by the vertical line in the graph). TheAT intensity steadily increased between January 2010 and July 2011, whenparticipants were adopting the new technology.The adoption follows an S-curve, which clarifies that a sharply defined eventstudy of a short period immediately before and after the introduction of co-lomay not reveal the full impact of AT on market quality. The growth of ATintensity stabilized at 50% only after July 2011, one and a half years afterthe introduction of co-lo. From Figure 1, we select the following two periodsfor our analysis: pre co-lo: January 1, 2009 to December 31, 2009 (260 days), where the datashow a low level of AT intensity. post co-lo: July 1, 2012 to Aug 31, 2013 (291 days), where the AT intensityis significantly higher.Endogeneity bias presents a critical barrier to causal inference on whetherAT affects market quality. Securities with high market quality (such as high13
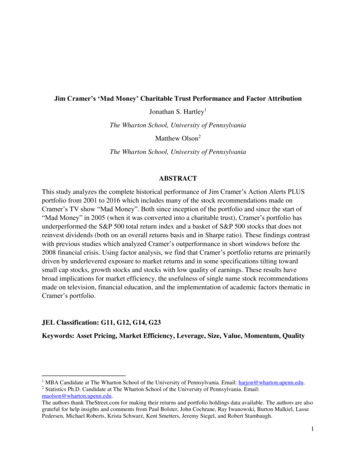
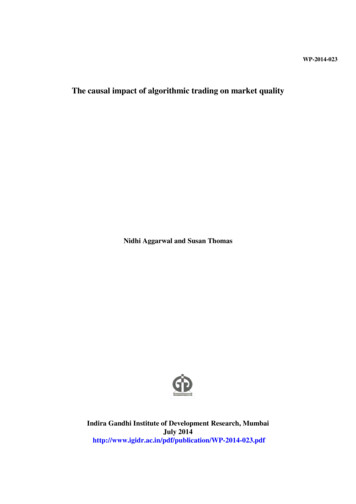
Figure 2 Cross sectional heterogeneity in AT intensityThe graph plots the daily average level of AT intensity in the pre co-lo and post co-loperiods, for each security in the sample period.Each circle on the graph represents a security. The size of the dot is proportional to themarket capitalisation of the security. While all the large dots (large firms) have uniformlymoved from low AT intensity (close to the x-axis) in the pre co-lo period to far away inthe post co-lo period, there is a significant cross-sectional variation in how AT intensitychanged for the smaller dots (medium- and small-sized firms).Q3 20131007575AT Intensity (%)AT Intensity (%)Q1 2009100502550250005001000150020000MCap (Rs ‘000s)100020003000MCap (Rs ‘000s)liquidity) are most likely to be more attractive to algorithmic traders. Thiscomplicates establishing whether AT intensity causes higher levels of market quality or whether other unobserved factors simultaneously cause highmarket quality and high AT intensity.One strategy to establish causal links is to identify securities that are identicalin every way, but for how much AT activity they attract. For example, largesized firms tend to be more liquid than small-sized firms. If a group of largesized securities get higher AT activity after the i
2 Algorithmic trading and market quality The rapidly expanding literature on algorithmic trading (AT) focuses on whether such trading enhances the ability of markets to improve long term investor welfare and capital e ciency for rms. Theory suggests that high frequency trading, a subset o