Transcription
Hill et al. BMC Public Health (2017) 17:802DOI 10.1186/s12889-017-4807-5RESEARCH ARTICLEOpen AccessSocial disparities in the prevalence ofdiabetes in Australia and in thedevelopment of end stage renal diseasedue to diabetes for Aboriginal and TorresStrait Islanders in Australia and Maori andPacific Islanders in New ZealandKathleen Hill1*, Paul Ward1, Blair S. Grace2 and Jonathan Gleadle3AbstractBackground: Disparities in health status occur between people with differing socioeconomic status and disadvantagedgroups usually have the highest risk exposure and the worst health outcome. We sought to examine the social disparitiesin the population prevalence of diabetes and in the development of treated end stage renal disease due to type 1diabetes which has not previously been studied in Australia and New Zealand in isolation from type 2 diabetes.Methods: This observational study examined the population prevalence of diabetes in a sample of the Australianpopulation (7,434,492) using data from the National Diabetes Services Scheme and of treated end stage renal diseasedue to diabetes using data from the Australian and New Zealand Dialysis and Transplant Registry. The data were thencorrelated with the Australian Bureau of Statistics Socioeconomic Indexes for Areas for an examination ofsocioeconomic disparities.Results: There is a social gradient in the prevalence of diabetes in Australia with disease incidence decreasingincrementally with increasing affluence (Spearman’s rho .765 p 0.001). There is a higher risk of developing endstage renal disease due to type 1 diabetes for males with low socioeconomic status (RR 1.20; CI 1.002–1.459) incomparison to females with low socioeconomic status. In Australia and New Zealand Aboriginal and Torres StraitIslanders, Maori and Pacific Islanders appear to have a low risk of end stage renal disease due to type 1 diabetes butcontinue to carry a vastly disproportionate burden of end stage renal disease due to type 2 diabetes (RR 6.57 CI 6.04–7.14 & 6.48 CI 6.02–6.97 respectively p 0.001) in comparison to other Australian and New Zealanders.Conclusion: Whilst low socioeconomic status is associated with a higher prevalence of diabetes the inverse socialgradient seen in this study has not previously been reported. The social disparity seen in relation to treated end stagerenal disease due to type 2 diabetes for Aboriginal and Torres Strait Islanders, Maori and Pacific Islanders has changedvery little in the past 20 years. Addressing the increasing incidence of diabetes in Australia requires consideration of theunderlying social determinants of health.Keywords: Diabetes, Socioeconomic status, Aboriginal and Torres Strait islanders, Renal disease, Australia, New Zealand* Correspondence: kathy.hill@flinders.edu.au1Discipline of Public Health, Flinders University, Adelaide, South Australia,AustraliaFull list of author information is available at the end of the article The Author(s). 2017 Open Access This article is distributed under the terms of the Creative Commons Attribution 4.0International License (http://creativecommons.org/licenses/by/4.0/), which permits unrestricted use, distribution, andreproduction in any medium, provided you give appropriate credit to the original author(s) and the source, provide a link tothe Creative Commons license, and indicate if changes were made. The Creative Commons Public Domain Dedication o/1.0/) applies to the data made available in this article, unless otherwise stated.
Hill et al. BMC Public Health (2017) 17:802BackgroundOver one million Australians are living with diabetesand 10% of these have type 1 diabetes mellitus (T1DM).The childhood incidence rate of T1DM in Australia(22.5 per 100,000 population) is one of the highest in theworld [1] and sits in the top 10 of countries comparedacross the globe [2]. The population prevalence oftype 2 diabetes mellitus (T2DM) in Australia is similar to European countries at 5%, however a higher incidence is seen in New Zealand (7.3%) and has also beendemonstrated to be much higher in other countries, forexample in Malaysia (17.9%) [3]. Whilst the onset ofT2DM is largely attributed to age and obesity with someevidence of predisposing genetic risk [4], the aetiology ofT1DM remains unknown. The process through whichpancreatic beta cell destruction occurs is autoimmunehowever it is thought to occur in genetically susceptibleindividuals and a wide number of hypotheses regarding anenvironmental trigger have been studied but not yetproven [5]. In Australia a higher prevalence of T2DM isknown to be associated with low area socioeconomicstatus (SES) [6] and potentially related to higher rates ofobesity. In contrast to T2DM no association with low areaSES has previously been demonstrated for T1DM [7–9].In Europe, Canada and the United States socioeconomically disadvantaged people have higher rates of morbidityand mortality in T1DM [10–14]. However very little iscurrently known regarding T1DM prevalence in Australiaand the disease outcome of treated end stage renal disease(ESRD) due to T1DM for people with low area SES, thisregions Indigenous minority populations, Aboriginal andTorres Strait Islanders, and Maori and Pacific Islanders.This study is an exploration of social disparities in diabetesin relation to area SES and Aboriginal and Torres StraitIslander, Maori and Pacific Islander ethnicity.In 2014, there were 25,626 people in Australia andNew Zealand receiving renal replacement therapy forESRD, and 37% of new cases (n 954) were attributedto diabetic nephropathy [15]. In this region, people withlow area SES are more likely to progress to ESRD due tokidney disease of any aetiology, but this disparity is mostpronounced in diabetic nephropathy caused by T2DM[16, 17] with a relative risk of progression to ESRD forthe most disadvantaged decile versus the most advantaged decile of 2.38 [17]. While studies from othercountries have found a higher likelihood of ESRD due toT1DM for people with low SES [18, 19] this has not previously been studied separately from T2DM in Australia.The incidence of T1DM in the Aboriginal and TorresStrait Islander population is reported to be 9 per100,000 but this may be an underestimate because oflower levels of registration with the National DiabetesServices Scheme and underreporting of Indigenousstatus at diagnosis [7]. Although the incidence of T1DMPage 2 of 8nephropathy has not previously been reported forAboriginal and Torres Strait Islanders, Maori and PacificIslanders, the incidence of progression to ESRD fromchronic kidney disease in these populations due to anycause is much higher than the general population [20]. Itis also known that Aboriginal and Torres StraitIslanders, Maori and Pacific Islanders have a disproportionate burden of ESRD [15] from diabetic nephropathy,which is attributed to a higher prevalence of T2DM butalso to an increased likelihood of progressive renaldisease [20]. This has largely been attributed to individual behaviours [20] however limited access to appropriate health care services is a strong determinant of healthoutcomes [21].MethodsAimsThe aims of this study were to examine the populationprevalence of diabetes in Australia for an associationwith area SES. This study also sought to determinewhether there is any relationship between T1DM ESRDand area SES in Australia, and to re-examine diabeticnephropathy ESRD for this region’s most socially disadvantaged and vulnerable minority populations: Aboriginaland Torres Strait Islanders in Australia, and Maori andPacific Islanders in New Zealand.Study designThis observational study is a secondary analysis of existingdata using an ecological design to make large scale comparisons between groups [22]. Ethical approval for theresearch was obtained from the Southern AdelaideClinical Human Research Ethics Committee (SACHREC),reference number 564.13.Study periodThis study examined all reported cases of T1DM ESRDfor a 5 year period from 2008 to 2012 and the Australianpopulation prevalence of diabetes as recorded in 2014.Data sourcesTreated end stage renal diseaseThe Australia and New Zealand Dialysis and TransplantRegistry (ANZDATA), located within the South AustralianHealth and Medical Research Institute, record the incidence and outcomes of dialysis and transplant treatmentfor people with ESRD and receive their data annually fromindividual Renal units. The information collected by theANZDATA Registry is used for research that is of benefitto the data contributors, a process overseen by a networkof nephrologists, surgeons and renal nurses with interestand expertise in using the data [23]. Australian populationdata and individual-level de-identified data (gender, age,age of development of ESRD) for all cases of ESRD due to
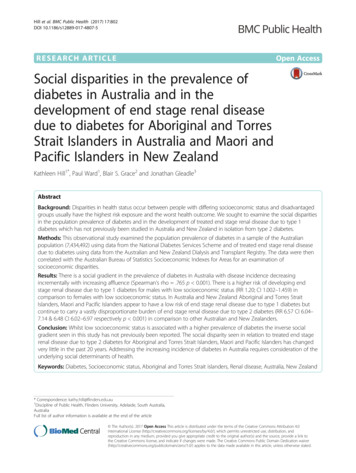
Hill et al. BMC Public Health (2017) 17:802T1DM for a five-year period (n 534) were obtained fromthe ANZDATA Registry. Data were also obtained on therelative risk ratio (RR) for T1DM and T2DM ESRD forAboriginal and Torres Strait Islanders and Maori andPacific Islanders through an analysis of all data heldin the registry.Socioeconomic statusThe Socio-Economic Indexes for Areas (SEIFA) is anindex developed by the Australian Bureau of Statisticsthat ranks areas in Australia according to relative socioeconomic advantage based on information from thefive-yearly Census [24]. The structure of SEIFA allowsmeasurement of key components of area SES such as income, wealth, social class, occupation, education andcommunity cohesion and individual data from within apost code area is aggregated to rank that post code byarea SES. A SEIFA index summarises the characteristicsof people and households within an Australian postalarea. The combination of these measures allows an integration of the individual, household and communityfactors that can influence health [25]. Data in SEIFA areranked in deciles from 1 (lowest area SES) to 10 (highestarea SES). ANZDATA records the residential postcodefor each Australian case of ESRD and these post codeswere used to explore population prevalence of diabetesto estimate the relative risk of ESRD. The postal areasSEIFA (2011) was used to identify the area SES for eachpostcode. The population in each post code ranged from294 to 102,224 however the median population per postcode was 17,467 people.The prevalence of diabetes in a sample of the AustralianpopulationThis study examined the population prevalence of diabetes in a cross sectional way rather than a whole ofregion way using the T1DM ESRD post codes as a sample. Using the post codes for each case of T1DM ESRDthe total size of the population studied for diabetesprevalence was 7,434,492 which represents one third ofthe Australian population. Population size (number ofpeople) in each postcode with a case of T1DM ESRDwas recorded, and the population prevalence of diabetesin that postcode (number of people with diabetes) whichis recorded by the National Diabetes Service Schemeregistrant database was then used to calculate diabetesprevalence as a percentage. The data were then converted into population prevalence by SEIFA decile usingthe Australian Bureau of Statistics database which liststhe SEIFA decile for each postcode. People newlydiagnosed with diabetes register with the NationalDiabetes Services Scheme and the register is thought tohave almost complete coverage.Page 3 of 8Statistical analysisThe characteristics of the data determined the descriptiveand inferential statistics used through an examination ofnormality, distribution and the level of measurement [26].For the continuous data, Levine’s tests of normality wereused, which have an assumption that the variance betweengroups is normally distributed. For normally distributeddata, the parametric t-test was used for independentvariables with two categories, and an analysis of variance(ANOVA) was used for independent variables with morethan two categories. Where the continuous dependentvariable was not normally distributed and the independentvariable had more than two categories, the nonparametric Kruskal–Wallis tests and Spearman’s rank correlation coefficients were used [27, 28]. To calculate therelative risk of T1DM ESRD in relation to area SES the 10SEIFA deciles were further condensed into two categoriesof low area SES (deciles 1–5) and high area SES (deciles6–10). Relative risk estimates were calculated within achi-squared analysis. Data were analysed in SPSS Statisticsfor Windows, version 21, IBM Corp., Armonk, NY; IBMCorp 2012.ResultsPrevalence of diabetes mellitus in the population sample(2014)Population prevalence for any form of diabetes was plotted against the SEIFA deciles.1 The mean prevalence ofdiabetes was 5.3% (IQR 4.2–6.3, SD 1.63). The prevalence of diabetes in the Australian population variesconsiderably by SEIFA decile. There was an incrementalincrease in prevalence as area SES decreased, with thelowest SEIFA decile having a prevalence of diabetesmore than double that of the highest decile, demonstrating an inverse social gradient (Fig. 1). The correlationcoefficient for association between SEIFA decile and thepercentage of the population with diabetes was .765(Spearman’s p 0.001).Most diabetes cases in Fig. 1 are T2DM (85%) with theremaining 15% comprising of T1DM (12%) and gestational diabetes (3%). The outliers seen in Figs. 1 and 2were included in the analysis. They represent postcodes(communities) with a much higher or much lowerprevalence than that seen in the decile overall and mayrepresent familial clustering or a particularly high density of a single minority ethnic group, both of which areknown to be associated with diabetes prevalence.Prevalence of type 1 diabetes mellitus in the populationsample (2014)In Fig. 2, T1DM data are presented separately to allother types of diabetes. The mean prevalence of T1DMwas 0.588% of the population (IQR 0.49–0.66, SD 0.161).The national prevalence of T1DM is known to be 0.5%
Hill et al. BMC Public Health (2017) 17:802Page 4 of 45.315.094.324.013.38Fig. 1 Population prevalence (percentage) of any form of diabetes by collation of the sample post codes ranked into SEIFA deciles from 1 (lowestarea SES) to 10 (highest area SES) 2014of the population and previously this has been reportedas not being associated with area SES [29]. The resultsshow that population prevalence of T1DM in this studyfollowed a small but statistically significant inversegradient with higher area SES deciles having an overalllower population prevalence of T1DM (Fig. 2).2 The correlation coefficient for association between SEIFA decileand the percentage of the population with T1DM was .397 (Spearman’s p 0.001).Type 1 diabetes mellitus treated end stage renal diseaseIncidence rates (new presentations) of T1DM ESRD inAustralia are shown in Table 1. Rates have been steadilyincreasing but there was a much lower incidence forpeople of Aboriginal and Torres Strait Islander ethnicity.The crude incidence of ESRD due to any cause permillion population was 112 [15] with T1DM representing about 4.9% of cases in 2012.Age of presentation with type 1 diabetes mellitus andend stage renal diseaseThere was an even distribution of age of onset for incident T1DM ESRD cases for both males (n 303) andfemales (n 231). Table 2 describes the incidence ratesof T1DM ESRD during the period studied by age group.The youngest person diagnosed with T1DM ESRD inthe period was aged 14 years and the oldest was 81 years.The mean age of presentation was 45 (SD 11.72) andvery few cases were diagnosed after the age of 60 years.Age of onset of ESRD in T1DM did not differsignificantly by gender (p .612) however more malesdeveloped T1DM ESRD than females (56.3% versus43.3%). The extremely small number of Aboriginal 597.598.547.544.520.492Fig. 2 Population prevalence (percentage) of T1DM in Australia by collation of the sample post codes ranked into SEIFA deciles from 1 (lowestarea SES) to 10 (highest area SES) 2014
Hill et al. BMC Public Health (2017) 17:802Page 5 of 8Table 1 T1DM ESRD incidence rates per million population withthe lower and upper bound values for the period 2008–2012Year Australia (non-Aboriginal Aboriginal and TorresMaori (NZ)and Torres Strait Islander) Strait Islander (Australia)(CI 6.04–7.14, p 0.001) and 6.48 for Maori and PacificIslanders (CI 6.02–6.97, p 0.001) [30] in comparison toall other Australians and New Zealanders.2008 5.90 (4.69–7.34)0.26 (0.03–0.95)6.22 (1.69–15.93)Discussion2009 4.86 (3.77–6.16)0.51 (0.14–1.33)6.12 (1.66–15.68)Population prevalence of diabetes2010 5.43 (4.29–6.79)0.63 (0.20–1.48)3.01 (0.36–10.88)2011 6.50 (5.25–7.96)0.12 (0.003–0.69)5.93 (1.61–15.20)2012 8.27 (6.85–9.89)0.36 (0.07–1.06)The prevalence of diabetes in the Australian populationfollows a pronounced inverse social gradient, increasingincrementally as area SES falls. It was previously reported that the national prevalence of diabetes was 5.4%and that low area SES was associated with a threefoldhigher prevalence of T2DM [6], but the striking anduniform social gradient demonstrated in this study hasnot been described previously. A recent study inGermany has also demonstrated a social gradient in theprevalence of diabetes [31] suggesting that this may be aglobal phenomenon. Across the Australian populationthere was also a statistically significant gradient inT1DM with the highest incidence also seen in the lowestarea SES. Although the incidence of T1DM shows alarge variation worldwide, environmental or geneticcausation has not yet been determined [32] and this isthe first Australian study to describe an inverse relationship between incidence of T1DM and area SES.an/aano Maori cases reported for this yearTorres Strait Islanders and Maori seen over this periodmake a comparison on age of onset between groupsunreliable.Type 1 diabetes mellitus treated end stage renal disease,socioeconomic status, age and genderThere were similar numbers of incident cases of T1DMESRD in each SEIFA decile from the lowest area SES (1)through to 9 (range 43–50) with a slightly smaller number (32) in decile 10, the most advantaged area SES.There was little difference in age of presentation by areaSES, with the mean age being almost identical betweendeciles 1 (47.31) and 10 (47.19). A multivariate one-wayANOVA demonstrated no significant difference betweenthe age of presentation in relation to area SES for malesor females (p .766, p .289). However, males of lowarea SES were overall at increased risk of T1DM ESRDcompared with females of low area SES (RR 1.20, CI1.002–1.459, p .043).Ethnic disparities in type 1 diabetes mellitus and type 2diabetes mellitus treated end stage renal disease inaboriginal and Torres Strait islanders, Maori and PacificislandersThe number of Aboriginal and Torres Strait Islanders andMaori and Pacific Islanders with ESRD from T1DM wasvery low, whilst the RR for all other Australians and NewZealanders in comparison to Aboriginal and Torres StraitIslanders, Maori and Pacific Islanders was 2.99 (CI 2.14–4.18, p 0.001) [30]. For ESRD in the setting of T2DMhowever the RR was 6.57 for Indigenous AustraliansTable 2 T1DM ESRD new cases for the period 2008–2012 classifiedby age groupAge groupPercentage of new cases 200.2%21–3010.8%31–4029%41–5030%51–6021% 609%Type 1 diabetes mellitus and treated end stage renaldiseaseThe mean age of presentation with T1DM ESRD(45 years) is significantly lower than for other aetiologiescombined (other than paediatric-specific kidney disease)with the national mean age of presentation with ESRDbeing 60 years [33]. There were few T1DM ESRD casesdiagnosed after the age of 60 years, probably because ofhigher mortality seen in T1DM [34]. There was anexcess of ESRD for males with T1DM in Australia andthis may be due to several factors. There is an overallhigher incidence of T1DM in males [7], higher cardiacmortality has been demonstrated for females withT1DM [35, 36] resulting in death before the development of ESRD, a higher risk for males of developingESRD regardless of disease aetiology [33] and a bias inpropensity to treat towards males [37]. This study hasalso shown an increased risk of ESRD for males of lowarea SES. There is considerable evidence for poorer outcomes in people of low SES with T1DM [10, 14] and ofthe higher risk of ESRD for males [38, 39], however noother studies to date have found an increased risk ofESRD only for males of low area SES. A recent Swedishstudy found that being of low SES increased the risk ofdeath two- or three-fold, and that males were morelikely to die overall, but this was not explicitly examinedin relation to males of low SES [40]. Health care accessis an important social determinant of health outcomesin T1DM and Australia offers a Universal ‘free’ health
Hill et al. BMC Public Health (2017) 17:802care service. However people with low SES have lowerlevels of health literacy defined as more than literacyand numeracy to incorporate a degree of difficulty in navigating the health care service irrespective of ‘universalcoverage’ [41]. Australian research is warranted to explorethe higher risk of ESRD for males of low area SES todetermine if it is an adverse outcome or in fact a survivaladvantage.Aboriginal and Torres Strait islanders, Maori and PacificislandersThe very low incidence of T1DM ESRD in the Aboriginaland Torres Strait Islander and Maori populations, inthe face of the extremely high incidence of T2DMESRD, is difficult to interpret for a number ofreasons. The issue of survival may be an underlying factorbecause there is a well-demonstrated intergenerationalcyclical disadvantage experienced by Indigenous people asa result of colonisation [42]. Aboriginal and Torres StraitIslander people have the worst health, lowest life expectancy and highest child mortality rates of all Australians[43] and death rates due to diabetes, which is generallyreported as T2DM in this population, are 30 times higherthan in other Australians [44]. In addition, there appearsto be no studies of young adult onset T1DM in theAboriginal and Torres Strait Islander population despiteAustralian data demonstrating that almost 50% of cases ofT1DM are diagnosed after the age of 15 years [1, 8].Studies conducted overseas suggest that up to 30% ofcases diagnosed as T2DM test positive for autoantibodiesand could be due to T1DM or late onset autoimmunediabetes in adults (LADA) [45]. This raises a secondpossibility, that of misclassification and conflation ofT1DM with T2DM, which could lead to incorrect treatment and earlier death. These findings in relation toT1DM suggest a need to investigate diabetes classificationin the Aboriginal and Torres Strait Islander populationwith autoantibody and C-peptide testing. It is also worthnoting that in regard to the grossly inflated risk of ESRDdue to T2DM in Aboriginal and Torres Strait Islanders,Maori and Pacific Islanders, these populations also havethe lowest SES, and being an ethnic minority and of lowSES are independently associated with poor outcomes indiabetes [46].Study limitationsReporting of census data to the Australian Bureau ofStatistics who develop the SEIFA categories is mandatoryin Australia. The risk of ecological fallacy is acknowledged when determining individual SES status from areaSES through the assumptions that are made about individuals based on group data [47]. However, the purposeof this study is not to determine causation but to makelarge scale comparisons between groups [22]. The use ofPage 6 of 8SEIFA categories has repeatedly demonstrated thathealth status is related to socioeconomic status howevercannot identify exactly which aspects of socioeconomicdisadvantage lead to health disadvantage [48]. Inaddition there may be status inconsistencies in theSEIFA SES areas. This study reports a sub-sample of theAustralian population for diabetes prevalence in relationto SES and a whole of population study would be neededto be fully conclusive. The association between area SESand ESRD could be a consequence of people moving toan area of low SES because of chronic illness andreduced capacity for income. In addition, there are competing risks for ESRD development in relation to thehigh cardiac mortality seen in T1DM. A diagnosis biasto T2DM for a case of T1DM cannot be excluded whenusing registry data and there may be inconsistent classification of ethnicity for Aboriginal and Torres StraitIslanders, Maori and Pacific Islanders. Data relating toprevalence and renal outcomes of T1DM in the Aboriginal and Torres Strait Islander, Maori and Pacific Islanderpopulation is thought to be widely underreported andinsufficient for conclusions to be drawn. The 5 year timeframe used in this study is a limitation and may have impacted on the strength of the results. The data in Table1 describing the incidence of T1DM ESRD would bemore fully understood with the addition of standardizedrates/reference population however to our knowledge nosuch data on T1DM is kept in Australia due to theabsence of a T1DM registry.ConclusionThis study has demonstrated a uniform inverse socialgradient in diabetes prevalence in Australia confirmingthe strong association between socioeconomic disadvantage and the disease. With regard to diabetic nephropathy ESRD whilst it has previously been demonstratedusing ANZDATA that populations in Australia of lowarea SES carry a heavier burden of ESRD this study ofT1DM ESRD over a five-year period shows that thereappears to be an increased risk only for males of lowarea SES. ESRD may not be the most suitable measureof disproportionate outcomes in T1DM in Australiagiven that a high mortality from the disease for peopleof low SES before reaching ESRD is likely. Othercountries have reported an inverse relationship betweenSES and mortality in T1DM [10–14] with a much higherlikelihood of death for people who are socioeconomicallydisadvantaged and this disparity is more pronounced inT1DM than in T2DM [49]. For this reason, it remainsuncertain whether this study demonstrates an increasedrisk for males or a survival advantage. While there aredoubts about classification of diabetes in the Aboriginaland Torres Strait Islander population, the grossly inflated risk of diabetic nephropathy ESRD for Aboriginal
Hill et al. BMC Public Health (2017) 17:802and Torres Strait Islanders, Maori and Pacific Islandersover the time period studied is a shared disparate outcome across these three minority populations that haschanged little in the past 20 years.Endnotes1Data are presented in box and whisker plots with outliers (extreme cases in each decile) represented by thesymbols * which denote individual postcodes.2The postcode with zero prevalence seen in decile 1(lowest area SES) in Fig. 2 is a remote area and mayrepresent lack of services and/or registration with theNational Diabetes Services Scheme.AbbreviationsANZDATA: Australia and New Zealand Dialysis and Transplant Registry;ESRD: End Stage Renal Disease; RR: Relative Risk; SEIFA: SocioeconomicIndexed for Areas; SES: Socioeconomic Status; T1DM: Type 1 DiabetesMellitus; T2DM : Type 2 Diabetes MellitusAcknowledgementsThe data reported here have been supplied by the Australia and NewZealand Dialysis and Transplant Registry. The interpretation and reporting ofthese data are the responsibility of the author and should not be seen as anofficial policy or interpretation of the Australia and New Zealand Dialysis andTransplant Registry.The authors acknowledge the contribution of Aarti Gulyani from ANZDATAfor assistance with interpretation of the RR of ESRD due to diabetes and indetermining the accuracy of the population level data reported. This workwithin the ANZDATA registry is supported by NHMRC program and capacitybuilding grants.The authors also thank the patients and the staff of the Renal units inAustralia and New Zealand who make these data possible.FundingNo specific funding was received to conduct this research.Availability of data and materialsThe population data reported in this manuscript is publicly available via theNational Diabetes Services Scheme and the Australian Bureau of Statistics.The ESRD data is held by the ANZDATA Registry and subject to a request toaccess dependent upon ethical approval.Authors’ contributionsKH prepared the manuscript based on her original research, PW contibutedto the design of the study and editing the manuscript, BG contributed tothe data analysis and editing the manuscript, JG contributed to the designof the study and editing the manuscript. All authors read and approved thefinal version of the manuscript.Ethics approval and consent to participateEthical approval to conduct this study was obtained from the SouthernAdelaide Clinical Human Research Ethics Committee (SACHREC), referencenumber 564.13.Consent for publicationNot applicable.Competing interestsThe authors declare that they have no competing interests.Publisher’s NoteSpringer Nature remains neutral with regard to jurisdictional claims inpublished maps and institutional affiliations.Page 7 of 8Author details1Discipline of Public Health, Flinders University, Adelaide, South Australia,Australia. 2Faculty of Health and Medical Sciences, University of Adelaide,Adelaide, South Australia, Australia. 3School of Medicine, Flinders University,Adelaide, South Australia, Australia.Received: 27 February 2017 Accepted: 28 September 2017References1. Diabetes Australia. 2014. https://www.diabetesaustralia.com.au/.2. Diabetes UK. 2017. https://www.diabetes.org.uk/.3. International Diabetes Federation, 2015.4. Talmud PJ, et al. Sixty-Five Common Genetic Variants and Prediction ofType 2 Diabetes. Diabetes. 2015;64(5):1830–40.5. Knip M. Pathogenesis of type 1 diabetes: implications for incidence trends.Horm Res Paediatr. 2011;76(Suppl 1):57–64.6. Australian Institute of Health and Welf
Islanders, Maori and Pacific Islanders appear to have a low risk of end stage renal disease due to type 1 diabetes but continue to carry a vastly disproportionate burden of end stage renal disease due to type 2 diabetes (RR 6.57 CI 6.04– 7.14 & 6.48 CI 6.02–6.97 respectively p 0.0