Transcription
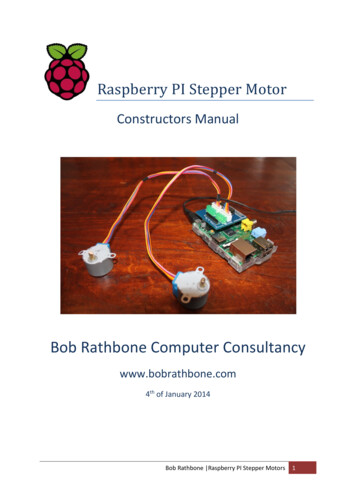
ARM Assembly Programming UsingRaspberry Pi1 IntroductionThe Raspberry Pi is an inexpensive credit-card sized Linux computer. At its core is an ARMv6 CPU. Thefree download Raspbian package (from NOOBS ins all the software necessary for ARM assembly language programming.The downloaded package includes Raspbian operating system and several programming languagesupports. Among them is the GNU Compiler Collection (GCC) which supports programming in C, C andassembly languages.In this document, we will use the commands as (assembler), ld (link loader), and gdb (GNU debugger)from GCC. These are command of command line interface that can be executed from the commandprompt. If you are using the graphic user interface (GUI), the command prompt is available fromLXTerminal which is part of the Raspbian software package.We will assume the reader is comfortable using the command line interface of the Raspberry Pi. TheRaspbian software package comes with two command line text editors: nano editor and vi that may beused to enter and edit the assembly source code. If you prefer to use a GUI text editor, Leafpad isavailable. For more text editor options , please x/usage/text-editors.mdLastly, the screenshots in this document were captured remotely using Tera Term terminal emulator.The content should look identical to the console display of the Raspberry Pi.Below are the versions of the assembler and linker used in this document.Figure 1: Display of version numbers for as and ld used in this document2 The DifferencesThe example programs in the book were developed using Keil MDK-ARM and uVision IDE. Theseprograms are intended to be stand-alone programs in an embedded ARM microcontroller. Programsdeveloped using GCC tools in Raspberry Pi are applications running under the Raspbian OS. Here aresome of the major differences:1 of 23
1. The code and data of the program are all loaded in the RAM allocated by the OS using virtualmemory addressing. The virtual memory address is the address that the program sees. From aprogrammer’s perspective, it should make no difference unless you are attempting toread/write the hardware registers.2. The program is running under Raspbian OS. The OS provides services such as console read/writeor file I/O.3. The syntax for the assembly source file is different. GCC was developed to support manydifferent processors. With the recent version of GCC assembler (v2.24), ARM instructions arekept the same as Keil MDK-ARM, the other parts of the syntax are slightly different.a. Comments are preceded by ‘@’ instead of ‘;’. The assembler also accepts C stylecomment enclosed with ‘/* */’ and ‘//’.b. Labels must be followed by a ‘:’.c. The syntaxes of the directives are different but the mappings are straightforward. Belowis a comparison table of the frequently used directives:GCC Directive.textKeil MDK-ARM DirectiveTEXT.dataDATA.global label.extern label.byte byte [,byte, byte, ].hword hw [,hw, hw, ].word word [,word, word, ].float float [,float, float, ]GLOBAL or EXPORTEXTERNDCBDCWDCDDCFS.double double [,double,double, ].space #bytes [,fill]DCFD.align nALIGN.ascii “ASCII string”.asciz “ASCII string”DCB “ASCII string”DCB “ASCII string”, 0.equ symbol, value.set variable, value.endEQUSETAENDSPACE or FILLExplanationSignifies the beginning of code orconstantSignifies the beginning of read/writedataMakes the label visible to linkerlabel is declared outside of this fileDeclares byte (8-bit) dataDeclares halfword (16-bit) dataDeclares word (32-bit) dataDeclares single precision floatingpoint (32-bit) dataDeclares double precision floatingpoint (64-bit) dataDeclares memory (in bytes) withoptional fillAligns address to 2 to the power ofn byteDeclares an ASCII stringDeclares an ASCII string with nullterminationSets the symbol with a constant valueSets the variable with a new valueSignifies the end of the programTable 1: Comparison of GCC directives and Keil MDK-ARM directives3 Sample Program ConversionBelow is Program 2-1 from the book that was written in Keil MDK-ARM syntax.2 of 23
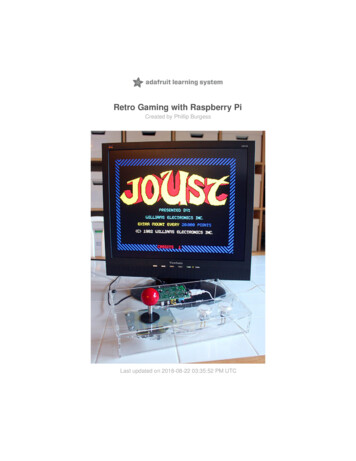
Program 2-1 Using Keil MDK-ARM syntax; ARM Assembly Language Program To Add Some Data and Store the SUM in R3.HEREAREAENTRYMOVMOVADDBENDPROG 2 1, CODE, READONLYR1, #0x25R2, #0x34R3, R2, R1HERE;;;;R1 R2 R3 stay0x250x34R2 R1here foreverThe same program in GCC syntax for Raspberry Pi is below.Program 2-1p Using GCC as version 2.24 syntax@P2 1.s ARM Assembly Language Program To Add Some Data and Store the SUM in R3.start:HERE:.global startMOVR1, #0x25MOVR2, #0x34ADDR3, R2, R1BHERE@@@@R1 R2 R3 stay0x250x34R2 R1here foreverThe changes are:1. Comments either use C-style /* */ or are preceded with ‘@’.2. Labels are followed by ‘:’.3. GCC linker is expecting a label “ start” for the entry point of the program. This label also mustbe made global so that it is visible to the linker.Technically the code of the program is marked by .text directive at the beginning and the end of theprogram should have the directive “.end”. However, GCC does not enforce either one.4 How to Assemble, Link and Run the ProgramIn this example, we enter the program above into a file name p2 1.s in the HOME/asm directory,assemble, link, and execute the program.First we make a directory with the name asm, change the current directory to asm and launch the editorvi for the file p2 1.s. We are showing the use of editor vi here but you may use any text editor youprefer.3 of 23
Figure 2: make asm directory, change to asm directory and launch editor viAfter typing in the program in vi, the file is saved.Figure 3: the sample program viewed in editor viThe program is assembled using command “as –o p2 1.o p2 1.s”. In this command, “as” is thename of the assembler, “–o p2 1.o” tells the assembler to create the output object file with the namep2 1.o, and lastly, “p2 1.s” is the assembly source file name (see below).Figure 4: the assemble commandLike many Unix1 programs, it produces no output to the console when the program ran without errors.1Raspbian is ported from Debian which derived from Linux and Linux is derived from Unix. All of them are verysimilar. In this document we will use Unix as a generic term for these operating system.4 of 23
Linker takes one or more object files and creates an executable file. To run the linker, use command“ld –o p2 1 p2 1.o”. In this command, “ld” is the name of the linker program, “–o p2 1” tells thelinker to produce the output executable file with the name p2 1, and lastly, “p2 1.o” is the inputobject file name.Figure 5: the linker commandAgain, the linker produces no output to the console when there were no errors.To execute the program, type the command “./p2 1” at the prompt. It tells the shell to execute theprogram named p2 1 at the current directory.Figure 6: the command to execute the program p2 1Recall the last instruction in the program is an infinite loop. After executing the first three instructions,the program is stuck at the infinite loop that consumes 100% of the CPU time. An infinite loop is typicalfor a program in a simple embedded system without an operating system. For now, type Ctrl-C toterminate the program and get the prompt back.Figure 7: Ctrl-C to terminate the program5 Program TerminationAs an application running under a multitasking operating system, the program should be terminatedwhen done. Otherwise, the program running a dummy infinite loop will consume the CPU time and slowdown all the other programs.To terminate a program, replace the dummy infinite loop at the end of the program “HERE: B HERE”by:MOVSVCR7, #105 of 23
The number 1 placed in Register 7 tells the operating system to terminate this program. The instruction“SVC 0” is the system call, that transfers the program execution to the operating system. If you placea different number in R7, the operating system will perform a difference service. We will visit a systemcall to write to the console later.After replacing the dummy infinite loop with the system call to end the program, run the assembler andlinker again. This time after you execute the program, the program will terminate by itself and theprompt reappears immediately without user intervention.6 Using GDBA computer without output is not very interesting like the previous example program. We will see howto generate output from a program in the next section, but for most of the programs in this book, theydemonstrate the manipulations of data between CPU registers and memory without any output. GDB(GNU Debugger) is a great tool to use to study the assembly programs. You can use GDB to step throughthe program and examine the contents of the registers and memory.In the following example, we will demonstrate how to control the execution of the program using GDBand examine the register and memory content.6.1 Preparation to Use GDBWhen a program is assembled, the executable machine code is generated. To ease the task of debugging,you add a flag “-g” to the assembler command line then the symbols and line numbers of the sourcecode will be preserved in the output executable file and the debugger will be able to link the machinecode to the source code line by line. To do this, assemble the program with the command (‘ ’ is theprompt): as -g -o p2 1.o p2 1.sThe linker command stays the same: ld -o p2 1 p2 1.oTo launch the GNU Debugger, type the command gdb followed by the executable file name at theprompt: gdb p2 1After displaying the license and warranty statements, the prompt is shown as (gdb). See Figure 8 below.6 of 23
Figure 8: assemble with debug option and launch of gdb6.2 Exit GDBGDB has a wealth of commands. We will only touch a few here. At the gdb prompt, you only need totype the minimal number of characters to be distinctive for the command. We will show the fullcommand but underscore the minimal required characters.To exit GDB, the command is “quit”.6.3 List source codeTo list the source code, the command is “list”. The list command displays 10 lines of the source codewith the line number in front of each line. To see the next 10 lines, just hit the Enter key.Figure 9: use gdb command list to display source code with line number6.4 Set breakpointTo be able to examine the registers or memory, we need to stop the program in its execution. Setting abreakpoint will stop the program execution before the breakpoint. The command to set breakpoint is7 of 23
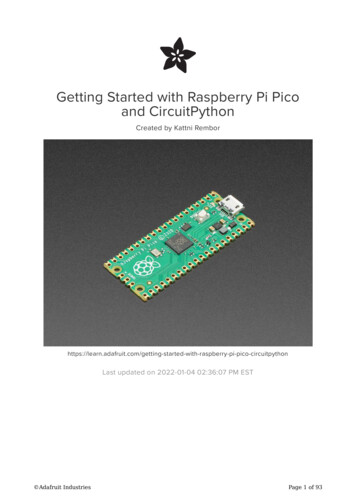
“break” followed by line number. The following command sets a breakpoint at line 6 of the program.When we run the program, the program execution will stop right before line 6 is executed. b 6GDB will provide a confirmation of the breakpoint.Figure 10: set a breakpoint at line 6 of the source code6.5 Run the programTo start the program, use command “run”. Program execution will start from the beginning until it hitsthe breakpoint. The line just following where the breakpoint was set will be displayed. Remember, thisinstruction has not been executed yet.Figure 11: run the program and it stops at the breakpoint6.6 Examine the CPU registersWith the program stopped before line 6, the last instruction on line 5 moved a literal value 0x25 intoRegister 1. We can verify that by using command “info registers”. The display consists of threecolumns: the register name, the contents in hexadecimal, and the contents in decimal. The registersholding addresses such as SP or PC will not display decimal values.8 of 23
Figure 12: display register contents using info register command6.7 Disassemble machine codeGDB has the ability of disassembling the machine code back to assembly instructions. The command is“disassemble”. Because the assembler does more than translating the source code to machineinstructions, the disassembled result may differ from the original source code. For example, a pseudoinstruction entered as “ldr R5, 0x1234” in the source code may have the disassembled output as“ldr r5, [PC, #32]”.Figure 13: disassemble the machine codeIn the disassembled display, the breakpoint instruction is marked by an arrow at the left margin.The disassemble command also takes a pair of starting address and ending address separated by acomma such as: disas 0x8054, 0x806cNote in the example in Figure 14 that although the last instruction of the program is at address0x00008060, the disassembled output continued until the specified address was met.9 of 23
Figure 14: disassemble the machine code between address 0x8054 and 0x806C6.8 Step through the instructionsWhen the program execution is halted by the breakpoint, we may continue by stepping one instructionat a time by using command “stepi”. The step instruction command may also take a numeric argumentto step more than one instruction at a time. For example, “stepi 5” will execute the five instructionsor until another breakpoint is hit.In the example below in Figure 15, we stepped two instructions and examined the register contents.Figure 15: step instruction twice and examine the register content6.9 Continue program executionWhen the program execution is stopped, you may continue from where execution was halted bycommand “continue”.In this example as seem in Figure 16, if we continue program execution and there are no morebreakpoints left, the program will run without stopping and we have no gdb prompt to issue a command.To stop program execution, hit Ctrl-C.Figure 16: continue the program execution and terminated by Ctrl-C6.10 Examine the memoryThe command to examine the memory is “x” followed by options and the starting address. Thiscommand has options of length, format, and size (see Table 2: options for examine memory command).With the options, the command looks like “x/nfs address”.10 of 23
OptionsNumber of itemsFormatSizePossible valuesany numberoctal, hex, decimal, unsigned decimal, bit, float,address, instruction, char, and stringbyte, halfword, word, giant (8-byte)Table 2: options for examine memory commandFor the example in Figure 1Figure 17 to display eight words in hexadecimal starting at location 0x8054,the command is “x/8xw 0x8054”.Figure 17: example of examine memory command7 Floating PointThe Raspberry Pi has hardware floating point support (VFP). You may write 32-bit or 64-bit floating pointinstructions in the assembly program.To assemble a program with floating point instructions, you need to let the assembler know that you areusing the VFP instructions by adding the command line option “-mfpu vfp”. A sample command will be: as -mfpu vfp -g -o p.o p.sThe linker command remains the same.In GDB, you may examine the VFP registers using command “info float”. The registers are displayedin 64-bit mode and 32-bit mode with floating point output and hexadecimal output. The content of theVFP status register fpscr is also displayed.8 Program Output8.1 Program Return ValueAlthough most of the programs in the book manipulate data internal to the processor and memory, it isstill convenient to generate output to be observed outside of the debugger. Recall in section 5 wediscussed terminating a program using system call #1. Following the Unix convention, when a programterminates, it should return an exit code. In an assembly program the exit code should be left in Register0 before the exit system call is made. After the program exit, the user may retrieve the exit code byreading the shell variable “ ?”. This is a simple method for a single integer output of a program.Using the last sample program, we will send the result of the addition to output. We do so by placingthe result in R0 before making the exit system call. The end of the program will look like this:MOVR0, R311 of 23
MOVSVCR7, #10After the program exit, at the prompt type command “echo ?” and the result 89 (decimal) will bedisplayed.Figure 18: an example of producing a program output number9 Assembly Programming with GUISo far, we have been using command line interface for programming and debugging. The rest of thisdocument will describe the use of a graphic user interface, Code::Blocks IDE, for assembly programming.Code::Blocks (http://www.codeblocks.org/) is an open source C, C and Fortran IDE licensed under theterm of GNU General Public License version 3. Although Code::Blocks is not intended for assemblylanguage programming, with GNU GCC compiler and GNU GDB debugger plug-ins, it can handleassembly language programming.Code::Blocks IDE does not support an assembly language only project so we need to start a C projectthen replace the “main.c” with an assembly language source file. (I will support a project with both Clanguage source files and assembly language source files but that is beyond the scope of this document.)As a C language project, the C start-up code will be automatically linked into the executable code butthis will be mostly transparent to the assembly programmer (or C programmer for that matter). We willdescribe the differences it causes later.9.1 Install Code::Blocks IDETo install Code::Blocks IDE, use the following command at the command prompt and all the requiredsoftware will be installed. sudo apt-get install codeblocksYou do need Internet connection to download and install the software package and it will take severalminutes to complete.12 of 23
9.2 Start Code::Blocks IDETo start the Code::Blocks IDE, click the start button (at the lower left corner of the Desktop), selectProgramming then Code::Blocks IDE. (To bring up the Desktop from command line interface, typecommand “startx”.)Figure 19: start Code::Blocks IDEThe first time you launch Code::Blocks IDE, it will ask you to confirm the compiler plug-ins. Unless youhave installed other compiler tools, it should detect only the GNU GCC compiler.9.3 Create a Code::Blocks Project9.4 Using Project Wizard to Create a ProjectAfter the IDE is launched, it displays the “Start here” window. Click on “Create a new project” link and awindow with the title “New from template” pops up.Keep the default wizard type as “Project” and click select “Console application” wizard then click the “Go”button (see Figure 20).13 of 23
Figure 20: create a new project using “Console application” wizardThe window will be replaced by “Console application” wizard. First it will ask for the selection ofprogramming language. Select “C” then click “Next ” button (See Figure 21).14 of 23
Figure 21: select C language for the projectThe next window asks for the project title and the folder where the project will be created. The wizardcreates a folder with the project name under the folder you specified and put all the project files andfolders in it. For example, we selected a folder “/home/pi/asm” and a project title “p2 1” (See Figure22). A folder “/home/pi/asm/p2 1” will be created and all the files and folders of this project will beplaced in it.Figure 22: specify project title and project folder locationClick “Next ” button and the next window is used to select compiler and configuration. Take the defaultselections as in Figure 23 then click “Finish” button.15 of 23
Figure 23: select compiler and configurations9.5 Replace the C File with an Assembly FileWhen we created a project for C language, the project wizard put in a template C source file called“main.c”. We will remove it and replace it with an assembly source file.Expand the project tree in the left panel and right click on “main.c” then select “Remove file fromproject” (See Figure 24).Figure 24: remove main.c from the projectNow, add an empty file to the project from menu File- New- Empty file (See Figure 25).16 of 23
Figure 25: add an empty file to the projectClick “Yes” button to confirm adding this file to the project (See Figure 26).Figure 26: click "Yes" to add the file to the projectIn order to add a file to the project, the file needs to be saved. The “Save file” window will pop up. Entera file name (for example, p2 1.s) and click “Save” button (See ). The file needs an extension of “.s” to berecognized as an assembly language source file.17 of 23
Figure 27: save the file with a file nameThe next window pops up will ask you to select the targets for this file (See Figure 28). Make sure“Debug” is selected before clicking on the “Ok” button.Figure 28: select target for the fileOnce the empty file is added to the project, we may type in the code. We will reuse the programexample from the early command line interface with a small change.18 of 23
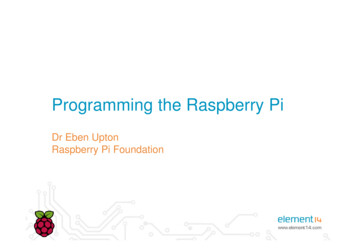
Program 2-1g Using GCC as version 2.24 syntax@P2 1.s ARM Assembly Language Program To Add Some Data and Store the SUM in R3.main:HERE:.global mainMOVR1, #0x25MOVR2, #0x34ADDR3, R2, R1BHERE@@@@R1 R2 R3 stay0x250x34R2 R1here foreverRecall the GCC linker is expecting a label “ start” as the entry point of the program. That’s why we usedit in the previous program. The difference here is that we are borrowing a C language project for ourassembly program. When GCC is linking a C program, it includes the C startup code at the beginning ofthe program. The C startup code has the label “ start” as the entry point and the program executionstarts there. At the end of the C startup code, the program branches to a label “main” so we need to use“main” as the label of the entry point of our program.9.6 Assemble the programTo run the assembler and linker, click the “Build” button (Figure 29).Figure 29: click "Build" button to assemble and link the programThe “Build log” window will show at the lower part of the window. Make sure there are no errors norwarnings (See Figure 30).Figure 30: Build log display9.7 Breakpoint and Launch of the DebuggerBefore we launch the debugger, it is a good idea to set a breakpoint. Otherwise, the debugger will run allthe way to the end of the program. To set a breakpoint, click at the margin just to the right of the line19 of 23
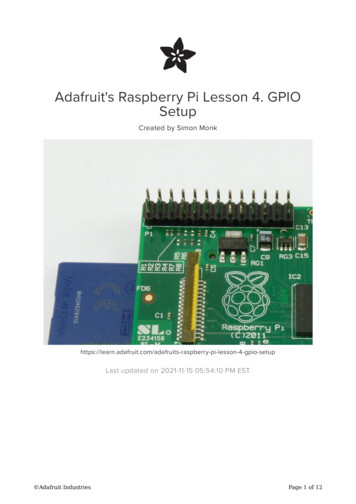
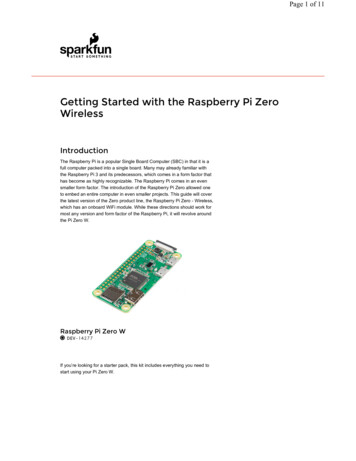
number in the source editor window and a red stop sign will show. To remove a breakpoint, click on thered stop sign and the breakpoint will be removed.With the breakpoint set, click “Debug / Continue” button to launch the debugger (See Figure 31).Figure 31: breakpoint and “Debug” buttonThe debugger changes the perspective of IDE then run the program until a breakpoint is hit. In ourprogram with the breakpoint on line 5, the program executes until right before the instruction on line 5is executed.Figure 32: the debugger stops before the breakpoint line is executedFrom Figure 32 above, you may see that there is a yellow triangle superimposed on the stop sign on line5 denotes that the program execution is halted and the program counter is pointing to the instructionon line 5. The same is shown in the Disassembly window. The CPU Register window shows that r1 hasthe content of 0x25 as the result of the instruction on line 4.20 of 23
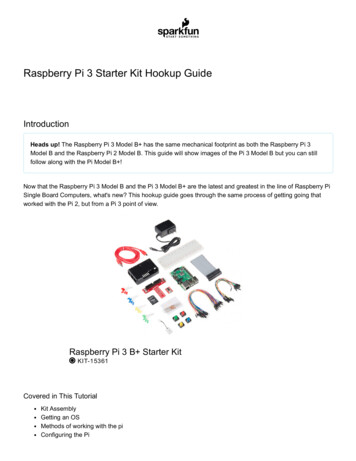
If Register window or Disassembly window is not visible, you may enable them from menu“Debug- Debugging windows”.9.8 Stepping the InstructionWhen the program execution is halted, the “Next instruction” button may be used to step the programone instruction at a time ().Figure 33: the "Next instruction" buttonWhen the “Next instruction” button is pressed, the yellow arrow moves to the next instruction (line 6 inFigure 34). Also as the result of instruction on line 5, register r2 has the content changed to 0x34.Figure 34: the result of "Next instruction"9.9 Examine MemoryThe memory window can be enabled from menu “Debug- Debugging windows- Examine memory”(Figure 35).21 of 23
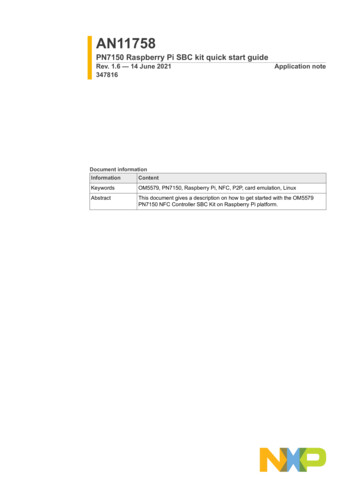
Figure 35: enable Examine memory window9.10 Floating Point RegistersThe floating point registers can be examined from menu “Debug- Information- FPU status” (Figure 36).Figure 36: display FPU status22 of 23
Bear in mind, the information displays are modal (when one of them is opened, you may not interactwith the debugger until it is closed).9.11 Stop the DebuggerTo stop the debugger and return to Edit/Build perspective of IDE, click “Stop debugger” button (Figure37).Figure 37: Stop debugger button10 ConclusionThis document described how to use GCC tools to write assembly programs in a Raspberry Pi. It alsodiscussed the use of GDB debugger. Lastly, the use of Code::Blocks IDE as the GUI is introduced.23 of 23
The same program in GCC syntax for Raspberry Pi is below. Program 2-1p Using GCC as version 2.24 syntax @P2_1.s ARM Assembly Language Program To Add Some Data and Store the SUM in R3. .global _start _start: MOV R1, #0x25 @ R1 0x25 MOV R2, #0x34 @ R2 0x34 ADD R