Transcription
xNEL
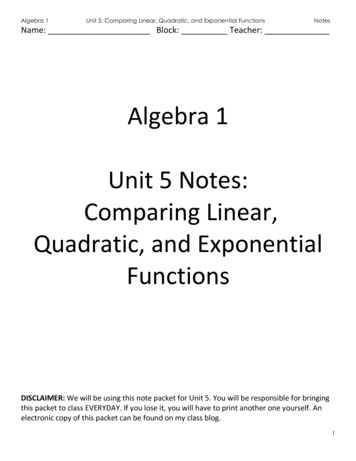
Chapter1Functions:Characteristicsand PropertiesGOALSYou will be able to Review and consolidate your knowledge ofthe properties and characteristics offunctions and their inverses Review and consolidate your knowledge ofgraphing functions using transformations Investigate the characteristics of piecewisefunctions? What type of function can beused to model the height of a golfball during its flight, and whatinformation about the relationshipbetween height and time can befound using this function?NEL1
1StudyGetting StartedSKILLS AND CONCEPTS You NeedAid For help, see the Review ofEssential Skills found at theNelson Advanced Functionswebsite.QuestionAppendix2R-33R-8, R-121. Evaluate f (x) 5 x 2 1 3x 2 4 for each of the following values.a) f (2)c) f a b14b) f (21)d) f (a 1 1)2. Factor each of the following expressions.a) x 2 1 2xy 1 y 2b) 5x 2 2 16x 1 3c) (x 1 y) 2 2 64d) ax 1 bx 2 ay 2 by3. State the transformations that are applied to each parent function,resulting in the given transformed function. Sketch the graphs of theparent function and transformed function.a) f (x) 5 x 2, y 5 f (x 2 3) 1 2xb) f (x) 5 2 , y 5 f (x 2 1) 1 2c) g(x) 5 sin x, y 5 22g(0.5x)d) g(x) 5 "x, y 5 22g(2x)4. State the domain and range of each function.a)4b) f (x) 5 x 2 2 6x 2 10y2x–4 –2 0–22c) y 51xd) y 5 3 sin x4e) g(x) 5 10x–45. Which of the following represent functions? Explain.a)4b) y 5 2(x 2 1) 2 1 3y2–4 –2 0–2–4x24c) y 5 6"x 2 4d) y 5 2x 2 4e) y 5 cos (2(x 2 30 ) 1 1)6. Consider the relation y 5 x 3.a) If (2, n) is a point on its graph, determine the value of n.b) If (m, 20) is a point on its graph, determine m correct to twodecimal places.7. A function can be described or defined in many ways. List thesedifferent ways, and explain how each can be used to determinewhether a relation is a function.2Getting StartedNEL
Getting StartedAPPLYING What You KnowModelling the Height of a FootballDuring a football game, a football is thrown by a quarterback who is 2 mtall. The football travels through the air for 4 s before it is caught by thewide receiver.?What function can be used to model the height of the footballabove the ground over time?A.Explain why the variables time, t, in seconds and height, h(t), inmetres are good choices to model this situation.B.What is h(0)? What does it mean in the context of this situation?C.What happens at t 5 2 s?D.What happens at t 5 4 s?E.Explain why each of the following functions is not a good model forthis situation. Support your claim with reasons and a well-labelledsketch.i) h(t) 5 25t(t 2 4)ii) h(t) 5 25(t 2 4) 2 1 2iii) h(t) 5 5t 2 1 4t 2 3F.Determine a model that can be used to represent the height of thefootball, given this additional information: The ball reached a maximum height of 22 m. The wide receiver who caught the ball is also 2 m tall.G.NELUse your model from part F to graph the height of the football overthe duration of its flight.Chapter 13
1.1FunctionsYOU WILL NEEDGOAL graph paper graphing calculator (optional)Represent and describe functions and their characteristics.LEARN ABOUT the MathJonathan and Tina are building an outdoor skating rink. They have enoughmaterials to make a rectangular rink with an area of about 1800 m2, andthey do not want to purchase any additional materials. They know, frompast experience, that a good rink must be approximately 30 m longer thanit is wide.What dimensions should they use to make their rink?EXAMPLE1Representing a situation using amathematical modelDetermine the dimensions that Jonathan and Tina should use to make their rink.Solution A: Using an algebraic modelLet x represent the length. Let y representthe width.A 5 xy1800 5 xy18005yxWe know the area must be1800 m2, so if we let thewidth be the independentvariable, we can write anexpression for the length.The width, in terms of x, is 1800xLet f (x) represent the difference betweenthe length and the width.1800f (x) 5 x 2,xwhere f (x) 5 30.x241.1Functions18005 30xUsing function notation,write an equation for thedifference in length and width.The relation is a functionbecause each input producesa unique output. In this casethe difference or value of thefunction must be 30.NEL
1.11800x(x) 2 x ab 5 x(30)xx 2 2 1800 5 30xx 2 30x 2 1800 5 0(x 2 60) (x 1 30) 5 02x 2 60 5 0 or x 1 30 5 0x 5 60 or x 5 230The length is 60 m.y518005 3060To solve the equation, multiplyall the terms in the equationby the lowest commondenominator, x, to eliminateany rational expressions.This results in a quadraticequation. Rearrange theequation so that it is in theform ax2 1 bx 1 c 5 0.Factor the left side.Solve for each factor. x 5 230is outside the domain of thefunction, since length cannotbe negative. This is aninadmissible solution.Calculate the width.The width is 30 m.The dimensions that are 30 m apart and will produce an area of 1800 m2are 60 m 3 30 m.Solution B: Using a numerical modelLet l represent the length. Let w represent the width.wlA 5 lw1800 5 lw18005wll 5 200180059w5200Check: l 2 w 5 200 2 9 2 30Length is the independentvariable.Its domain is 0 , l , 1800.Width is the dependent variable.Write an equation for thewidth in terms of length for afixed area of 1800 m2.Guess 1:l 5 10018005 18w5100Check: l 2 w 5 100 2 18 2 30Guess 2:NELUse different values for thelength to calculate possiblewidths. Check to see if thedifference between the lengthand width is 30.Chapter 15
Width (m) Length – WidthArea (m2)Length 090270Create a table ofvalues to investigatethe differencebetween the lengthand the width for avariety of lengths.The dimensions that are 30 m apart and produce an area of 1800 m2 are60 m 3 30 m.A function can also be represented with a graph. A graph provides a visual displayof how the variables in the function are related.Solution C: Using a graphical modelLet x represent the length. Let y representthe width.A 5 xy1800 5 xy18005yxUsing length (x) as theindependent variable, write anexpression for width (y).1800The width, in terms of x, is x .Let f (x) represent the differencebetween the dimensions.1800f (x) 5 x 2 xDetermine the appropriate window settingsto graph f (x) on a graphing calculator.61.1FunctionsThe value for x (length of rink)will be positive but surely lessthan 75 m, so we useXmin 5 0 and Xmax 5 75.We use the same settings forthe range of f(x), for simplicity.NEL
1.1Graph the difference function.TechUse the TRACEfeature on thegraph to investigatepoints with theordered pairs(length, length 2width) on f(x).SupportFor help using the graphingcalculator to find points ofintersection, see TechnicalAppendix, T-12.A length of 50 m gives a 14 m difference between the length and the width.Determine the length that exceeds the width by 30 m.To determine thelength that is 30 mlonger than thewidth, graphg(x) 5 30 in Y2 andlocate the point ofintersection for g(x)and f(x).The dimensions that are 30 m apart and produce an area of 1800 m2 are60 m 3 30 m.ReflectingA.Would the function change if width was used as the independentvariable instead of length? Explain.B.Is it necessary to restrict the domain and range in this problem? Explain.C.Why was it useful to think of the relationship between the length andthe width as a function to solve this problem?APPLY the MathEXAMPLE2Using reasoning to decide whether a relation is a functionDecide whether each of the following relations is a function. State the domain and range.a)4b) y 5y2–4 –2 0–2–4NELx241x2c)–2–10120123Chapter 17
Solutiona)4yApply the vertical line test. Any vertical line drawn on thegraph of a function passes through, at most, a single point.This indicates that each number in the domain corresponds toonly one number in the range, which is the condition for therelation to be a function.y f(x)2x–4 –2 0–224–4The graph represents an exponential function.Since the graph of this function has no breaks, or verticalasymptotes, and continues indefinitely in both the positiveand negative direction, its domain consists of all the realnumbers.D 5 5xPR6R 5 5 yPR 0 y . 226The function has a horizontal asymptote defined by theequation y 5 22. All its values lie above this horizontal line.b)23 22 21xf(x)191401 undefined123Create a table of values.11419The table indicates that each number in the domaincorresponds to only one number in the range.1f (x) 5 x 2 is a function.D 5 5xPR 0 x 2 0 6R 5 5 yPR 0 y . 061f(x) 5 x 2 has a vertical asymptote defined by x 5 0. Itsdomain consists of all the real numbers, except 0. It has ahorizontal asymptote defined by the equation y 5 0. All itsvalues are positive, since x is squared, so they lie above thishorizontal line.c)–2–10120123The mapping diagram indicates that each number in thedomain corresponds to only one number in the range.A function can have converging arrows but cannot havediverging arrows in a mapping diagram.This is a function.D 5 522, 21, 0, 1, 26R 5 50, 1, 2, 3681.1FunctionsThe first oval represents the elements found in the domain.The second oval represents the elements found in the range.NEL
1.1EXAMPLE3Using reasoning to determine the domainand range of a functionNaill rides a Ferris wheel that has a diameter of 6 m. The axle of the Ferris wheel is4 m above the ground. The Ferris wheel takes 90 s to make one complete rotation,and Naill rides for 10 rotations. What are the domain and range of the functionthat models Naill’s height above the ground, in terms of time, while he rides theFerris wheel?Solutionh(t) 5 a sin 3k(t 2 d)4 1 corh(t) 5 a cos 3k(t 2 d) 4 1 cThis situation involves circular motion,which can be modelled by a sine orcosine function.Examine the conditions on theindependent variable time to determinethe domain. Time cannot be negative,so the lower boundary is 0. The wheelrotates once every 90 s, and Naill ridesfor 10 complete rotations.D 5 5tPR 0 0 # t # 900 690 3 10 5 900The upper boundary is 900 s.663m3m1mR 5 5h(t) PR 0 1 # h(t) # 76NELExamine the conditions on the dependentvariable height to determine the range.The radius of the wheel is 3 m. Since theaxle is located 4 m above the ground, thelowest height that Naill can be above theground is the difference between theheight of the axle and the radius of thewheel: 4 2 3 5 1 m. This is the lowerboundary of the range.The greatest height he reaches is the sumof the height of the axle and the radiusof the wheel: 4 1 3 5 7 m. This is theupper boundary of the range.Chapter 19
In SummaryKey Ideas A function is a relation in which there is a unique output for each input. This means that each value of the independentvariable (the domain) must correspond to one, and only one, value of the dependent variable (the range). Functions can be represented graphically, numerically, or algebraically.Graphical ExampleNumerical ExamplesySet of ordered pairs:5(1, 3), (3, 5), (22, 9), (5, 11) 64Table of values:2–4 –2 0–2–4Algebraic Examplesx24xy224211001124y 5 2 sin (3x) 1 4orf (x) 5 2 sin (3x) 1 4Mapping diagram:–113–352–10Need to Know Function notation, f (x), is used to represent the valuesof the dependent variable in a function, so y 5 f (x). You can use the vertical line test to check whether agraph represents a function. A graph represents afunction if every vertical line intersects the graph in,at most, one point. This shows that there is only oneelement in the range for each element in thedomain. The domain and range of a function depend on thetype of function. The domain and range of a function that models aparticular situation may need to be restricted, basedon the situation. For example, negative values maynot have meaning when dealing with variables suchas time.101.1Functionsy0functionyxx0not a functionNEL
1.1CHECK Your Understanding1. State the domain and range of each relation. Then determinewhether the relation is a function, and justify your answer.a)y4c)2–12 –8 –40–2x4d) y 5 3x 2 58e)–4–6b)4y2–4 –2 0–25(1, 4), (1, 9), (2, 7),(3, 25), (4, 11)6–40–311223x246f ) y 5 25x 2–4–62. State the domain and range of each relation. Then determine whetherthe relation is a function, and justify your answer.a) y 5 22(x 1 1) 2 2 3b) y 51x13c) y 5 22xe) x 2 1 y 2 5 9d) y 5 cos x 1 1f ) y 5 2 sin xPRACTISING3. Determine whether each relation is a function, and state its domainand range.a)c)1357246b) 5 (2, 3), (1, 3), (5, 6),(0, 21)6NELe)012321410100d) 5 (2, 5), (6, 1), (2, 7),(8, 3)60123f ) 5(1, 2), (2, 1), (3, 4),(4, 3) 6Chapter 111
4. Determine whether each relation is a function, and state its domainKa)8and range.yb)6644220–2x–4 –2 0–2246c) x 2 5 2y 1 1yd) x 5 y 2x481216 203xf ) f (x) 5 3x 1 1e) y 5–45. Determine the equations that describe the following function rules:a) The input is 3 less than the output.b) The output is 5 less than the input multiplied by 2.c) Subtract 2 from the input and then multiply by 3 to find the output.d) The sum of the input and output is 5.6. Martin wants to build an additional closet in a corner of his bedroom.lBecause the closet will be in a corner, only two new walls need to bebuilt. The total length of the two new walls must be 12 m. Martin wantsthe length of the closet to be twice as long as the width, as shown in thediagram.a) Explain why l 5 2w.b) Let the function f (l ) be the sum of the length and the width. Findthe equation for f (l ).c) Graph y 5 f (l ).d) Find the desired length and width.wallwclosetwall7. The following table gives Tina’s height above the ground while riding aAFerris wheel, in relation to the time she was riding it.Time (s)020406080100120140160180200220240Height (m)5105051050510505a) Draw a graph of the relation, using time as the independent variableand height as the dependent variable.What is the domain?What is the range?Is this relation a function? Justify your answer.Another student sketched a graph, but used height as the independentvariable. What does this graph look like?f ) Is the relation in part e) a function? Justify your answer.b)c)d)e)121.1FunctionsNEL
1.18. Consider what happens to a relation when the coordinates of all itsordered pairs are switched.a) Give an example of a function that is still a function when itscoordinates are switched.b) Give an example of a function that is no longer a function whenits coordinates are switched.c) Give an example of a relation that is not a function, but becomes afunction when its coordinates are switched.9. Explain why a relation that fails the vertical line test is not a function.10. Consider the relation between x and y that consists of all points (x, y)such that the distance from (x, y) to the origin is 5.a) Is (4, 3) in the relation? Explain.b) Is (1, 5) in the relation? Explain.c) Is the relation a function? Explain.11. The table below lists all the ordered pairs that belong to thefunction g(x).x012345g(x)347121928a) Determine an equation for g(x).b) Does g(3) 2 g(2) 5 g(3 2 2) ? Explain.12. The factors of 4 are 1, 2, and 4. The sum of the factors isT1 1 2 1 4 5 7. The sum of the factors is called the sigma function.Therefore, f (4) 5 7.a) Find f (6), f (7), and f (8).c) Is f (12) 5 f (3) 3 f (4) ?b) Is f (15) 5 f (3) 3 f (5) ?d) Are there others that will work?13. Make a concept map to show what you have learned about functions.CPut “FUNCTION” in the centre of your concept map, and includethe following words:algebraic modeldependent variabledomainfunction notationgraphical modelindependent variablemapping modelnumerical modelrangevertical line testExtending14. Consider the relations x 2 1 y 2 5 25 and y 5 "25 2 x 2. Drawthe graphs of these relations, and determine whether each relation isa function. State the domain and range of each relation.15. You already know that y is a function of x if and only if the graphCommunicationTipA concept map is a type ofweb diagram used forexploring knowledge andgathering and sharinginformation. A concept mapconsists of cells that contain aconcept, item, or question andlinks. The links are labelled anddenote direction with an arrowsymbol. The labelled linksexplain the relationshipbetween the cells. The arrowdescribes the direction of therelationship and reads like asentence.passes the vertical line test. When is x a function of y? Explain.NELChapter 113
1.2Exploring Absolute ValueYOU WILL NEEDGOAL graph paper graphing calculatorDiscover the properties of the absolute value function.EXPLORE the MathAn average person’s blood pressure is dependent on their age and gender.For example, the average systolic blood pressure, Pn , for a 17-year-old girlis about 127 mm Hg. (The symbol mm Hg stands for millimetres ofmercury, which is a unit of measure for blood pressure.) The averagesystolic blood pressure for a 17-year-old boy is about 134 mm Hg.When doctors measure blood pressure, they compare the blood pressure tothe average blood pressure for people in the same age and gender group.This comparison, Pd , is calculated using the formula Pd 5 0 P 2 Pn 0 , whereP is the blood pressure reading and Pn is the average reading for people inthe same age and gender group.TechSupportTo use the absolute valuecommand on a graphingcalculator, press MATHand scroll right to NUM.Then press ENTER.?A.Jim is a 17-year-old boy whose most recent blood pressure reading was142 mm Hg. Calculate Pd for Jim.B.Joe is a 17-year-old boy whose most recent blood pressure reading was126 mm Hg. Calculate Pd for Joe.C.Blood PressureReading, PHow can the blood pressure readings of a group of people becompared?Compare the values of P 2 Pn and 0 P 2 Pn 0 that were used todetermine Pd for each boy. What do you notice?D.Complete the following table by calculating the values of Pd for thegiven blood pressure readings for 17-year-old boys.95100E.Draw a scatter plot of Pd as a function of blood pressure, ring Absolute ValueNEL
1.2Describe these characteristics of your graph:i) domainii) rangeiii) zerosiv) existence of any asymptotesv) shape of the graphvi) intervals of the domain in which the values of the function Pdare increasing and decreasing.vii) behaviour of the values of the function Pd as P becomes largerand smallerF.ReflectingG.Why might you predict the range of your graph to be greater than orequal to zero?H.What other function with domain greater than Pn could you haveused to plot the right side of your graph? Why does this make sense?I.What other function with domain less than Pn could you have used toplot the left side of your graph? Why does this make sense?J.How will the graph of y 5 0 x 0 compare with the graph ofPd 5 0 P 2 Pn 0 , if Pd is the y-coordinate and P is the x-coordinate?Use the characteristics you listed in part F to make your comparison.In SummaryKey Idea f(x) 5 0 x 0 is the absolute value function. On a number line, this functiondescribes the distance, f(x), of any number x from the origin.Need to Know For the function f(x) 5 0 x 0 , there is one zero located at the origin the graph is comprised of two linear functions and is defined as follows:x, if x 0f(x) 5 e2x, if x , 0 the graph is symmetric about the y-axis as x approaches large positive values, y approaches large positive values as x approaches large negative values, y approaches large positive values the absolute value function has domain 5xPR6 and range 5 yPR 0 y 06 every input in an absolute value returns an output that is non-negativeNEL0 230 5 30 30 5 3–5 –4 –3 –2 –1 0 1f(x) –x, x 062 3 4 5f(x) x, x 0y42–6 –4 –2 0–2x246–4–6Chapter 115
FURTHER Your Understanding1. Arrange these values in order, from least to greatest:0 25 0 , 0 20 0 , 0 2150 , 0 120 , 0 225 02. Evaluate.a) 0 222 0b) 2 0 235 0c) 0 25 2 13 00 28 0242160 222 0f)10 211 00 24 0e)d) 0 4 2 7 0 1 0 210 1 2 03. Express using absolute value notation.a) x , 23 or x . 3c) x # 21 or x 1b) 28 # x # 8d) x 2 65CommunicationTipTo show that a number is notincluded in the solution set,use an open dot at this value.A solid dot shows that thisvalue is included in thesolution set.4. Graph on a number line.a) 0 x 0 , 8b) 0 x 0 16c)0 x 0 # 24d) 0 x 0 . 275. Rewrite using absolute value notation.a)b)c)d)–4 –3 –2 –1 0 1 2 3 4–4 –3 –2 –1 0 1 2 3 4–4 –3 –2 –1 0 1 2 3 4–4 –3 –2 –1 0 1 2 3 46. Graph f (x) 5 0 x 2 8 0 and g (x) 5 0 2x 1 80 .a) What do you notice?b) How could you have predicted this?7. Graph the following functions.a) f (x) 5 0 x 2 2 0b) f (x) 5 0 x0 1 2c) f (x) 5 0 x 1 20d) f (x) 5 0 x 0 2 28. Compare the graphs you drew in question 7. How could you usetransformations to describe the graph of f (x) 5 0 x 1 3 0 2 4?9. Predict what the graph of f (x) 5 0 2x 1 10 will look like. Verify yourprediction using graphing technology.10. Predict what the graph of f (x) 5 3 2 0 2x 2 5 0 will look like. Verifyyour prediction using graphing technology.161.2Exploring Absolute ValueNEL
1.3Properties of Graphsof FunctionsYOU WILL NEEDGOAL graphing calculatorCompare and contrast the properties of various types of functions.INVESTIGATE the MathTwo students created a game that they called “Which function am I?” Inthis game, players turn over cards that are placed face down and match thecharacteristics and properties with the correct functions. The winner is theplayer who has the most pairs at the end of the game.The students have studied the following parent functions:2–4 –2 0–2h(x) 1xg(x) x2f(x) x22–4 –2 0–242–4 –2 0–2x24222–4 –2 0–24p(x) 2xm(x) xk(x) x –4 –2 0–2424q(x) sin x2–4 –2 0–22224 –180 0–2 180interval of increase?Which criteria could the students use to differentiate betweenthese different types of functions?A.Graph each of these parent functions on a graphing calculator, andsketch its graph. State the domain and range of each function, anddetermine its zeros and y-intercepts.B.NELDetermine the intervals of increase and the intervals of decrease foreach of the parent functions.the interval(s) within a function’sdomain, where the y-values ofthe function get larger, movingfrom left to rightinterval of decreasethe interval(s) within a function’sdomain, where the y-values ofthe function get smaller, movingfrom left to rightChapter 117
odd functionany function that hasrotational symmetry aboutthe origin; algebraically,all odd functions havethe propertyf(2x) 5 2f(x)yxC.State whether each parent function is an odd function, aneven function, or neither.D.Do any of the functions have vertical or horizontal asymptotes? If so,what are the equations of these asymptotes?E.Which graphs are continuous ? Which have discontinuities ?F.Complete the following statements to describe the end behaviour ofeach parent function.a) As x increases to large positive values, y . . .b) As x decreases to large negative values, y . . .even functionany function that is symmetricabout the y-axis; algebraically,all even functions have theproperty f(2x) 5 f(x)CommunicationTipIt is often convenient to use the symbol for infinity, , and the following notationto write the end behaviour of a function: For “As x increases to large positive values, y . . . ,” write “As x S , y S . . . ” For “As x decreases to large negative values, y . . . ,” write “As x S 2 , y S . . . ”yxG.Summarize your findings.continuous functionReflectingany function that does notcontain any holes or breaksover its entire domainH.Which of the parent functions can be distinguished by their domain?Which can be distinguished by their range? Which can bedistinguished by their zeros?I.An increasing function is one in which the function’s values increasefrom left to right over its entire domain. A decreasing function is onein which the function’s values decrease from left to right over its entiredomain. Which of the parent functions are increasing functions?Which are decreasing functions?J.Which properties of each function would make the function easy toidentify from a description of it?yxdiscontinuitya break in the graph of afunction is called a point ofdiscontinuityyx181.3Properties of Graphs of FunctionsNEL
1.3APPLY the MathEXAMPLE1Connecting the graph of a function with its characteristicsMatch each parent function card with a characteristic of its graph. Each card may only be used for one parentfunction.f(x) 2xf(x) x2–4 –2 0–2f(x) x 224Range:{yPR y 0}–4 –2 0–2x2Domain:{xPR}4f(x) sin (x)2–4 –2 0–222InfiniteNumber ofZeros4 –180 0–2 180As x 2 ,y 0.Solutionf(x) 2xAs x 2 ,y 0.2–4 –2 0–2244f(x) sin x2 –180 0–2NEL 180InfiniteNumber ofZerosThis property describesthe end behaviour:as x becomes negativelylarge, y approacheszero. The function musthave a horizontalasymptote defined byy 5 0. The functionmust be y 5 2x.The sine function isperiodic and continuesinfinitely, intersectingthe x-axis an infinitenumber of times.Chapter 119
f(x) x 2–4 –2 0–224f(x) xDomain:{xPR}2–4 –2 0–22The range 5 yPR Z y 06 indicates thatall y-values of the function must benon-negative. This is true for both f(x) 5 2xand f (x) 5 0 x 0. However, f(x) 5 2x hasthe x-axis as its horizontal asymptote,so y 2 0. Choose f(x) 5 0 x 0.Range:{yPR y 0}The remaining function, f(x) 5 x, matchesthe property 5xPR6.4If you are given some characteristics of a function, you may be able todetermine the equation of the function.EXAMPLE2Using reasoning to determine the equationof a parent functionState which of the parent functions in this lesson have the followingcharacteristics:a) Domain 5 5xPR6b) Range 5 5 yPR 0 21 # y # 16Solutiona) Domain 5 5xPR6f (x) 5 xg(x) 5 x 21h(x) 5 (Domain 5 5xPR 0 x 2 06)xk(x) 5 ZxZThere are five parentfunctions that matchthis characteristic andtwo that do not.m(x) 5 "x (Domain 5 5xPR 0 x 06)p(x) 5 2xq(x) 5 sin xb) Range 5 5 yPR Z 21 # y # 16f (x)g(x)k(x)p(x)q(x)201.35 x (Range 5 5 yPR6)5 x 2 (Range 5 5yPR 0 y 06)5 Zx Z (Range 5 5 yPR 0 y 06)5 2x (Range 5 5yPR 0 y 06)5 sin xProperties of Graphs of FunctionsOf these five functions,only the sine functionhas the range5 yPR 0 21 # y # 16.NEL
1.3Visualizing what the graph of a function looks like can help you remembersome of the characteristics of the function.EXAMPLE3Connecting the characteristics of afunction with its equationWhich of the following are characteristics of the parent function p(x) 5 2x ?Justify your reasoning.a) The graph is decreasing for all values in the domain of p(x).b) The graph is continuous for all values in the domain of p(x).c) The function p(x) is an even function.d) The function p(x) has no zeros.Solutionp(x) 5 2x10y864y 2x2–8 –6 –4 –2 0–2x24The function p(x) is an exponentialfunction with a base that is greaterthan 1.This type of function is increasingfor all values in its domain.–4a) This function is increasing forall values in the domain of p(x).b) The graph is continuous for all valuesin the domain of p(x).c) The function p(x) is not an evenfunction.d) The function p(x) has no zeros.This function has no breaks.This type of function is notsymmetric about the y-axis.f(2x) 5 22x. This substitutiondoes not result in f(x).As x approaches negative infinity,the graph gets arbitrarily close tothe x-axis but does not intersect it.Only b) and d) are characteristics of p(x).NELChapter 121
EXAMPLECommunicationTipThe interval (2 , 0) isdescribed using intervalnotation and is equivalent tox , 0 in set notation. The useof round brackets in intervalnotation indicates that theendpoint is not included in theinterval. The use of squarebrackets in interval notationindicates that the endpoint isincluded in the interval. Forexample, 323, 5) is equivalentto 23 # x , 5.4Determine a possible transformed parent function that has the followingcharacteristics, and sketch the function: D 5 5xPR6 R 5 5 yPR Z y 226 decreasing on the interval (2 , 0) increasing on the interval (0, )SolutionIntervals ofIncrease(0, )(2 , 0)k(x) 5 Z x Z(0, )(2 , 0)y21–2 –10–1–212y x2 – 2–3Properties of Graphs of Functionsy1x–2 –1State the intervals ofincrease and decreasefor the two remainingfunctions. Check to see ifthese intervals match thegiven conditions. Thereare two possible parentfunctions that have thegiven characteristics.Intervals ofDecreaseg(x) 5 x221.3List the functions thathave domain 5xPR6.Eliminate the functionsthat cannot have therange 5 yPR Z y 226.Each of the remainingfunctions can betranslated down twounits to have this range.f (x) 5 xg(x) 5 x 2k(x) 5 ZxZp(x) 5 2xq(x) 5 sin xFunction22Connecting the characteristics of a functionwith its equation and its graph0–1x12Sketch the graph of eachparent function shifted2 units down.–2 y x – 2–3NEL
1.3In SummaryKey IdeaFunctions can be categorized based on their graphical characteristics: domain and range intervals of increase and decrease x-intercepts and y-intercepts symmetry (even odd) continuity and discontinuity end behaviourNeed to Know Given a set of graphical characteristics, the type of function that has thesecharacteristics can be determined by eliminating those that do not have thesecharacteristics. Some characteristics are more helpful than others when determining the typeof function.CHECK Your Understanding1. Which graphical characteristic is the least helpful for differentiatingamong the parent functions? Why?2. Which graphical characteristic is the most helpful for differentiatingamong the parent functions? Why?3. One of the seven parent functions examined in this lesson istransformed to yield a graph with these characteristics: D 5 5xPR6 R 5 5yPR Z y . 26 As x S 2 , y S 2.What is the equation of the transformed function?PRACTISING4. For each pair of functions, give a characteristic that the two functionsKhave in common and a characteristic that distinguishes between them.1a) f (x) 5 and g(x) 5 xc) f (x) 5 x and g(x) 5 x 2xb) f (x) 5 sin x and g(x) 5 xd) f (x) 5 2x and g(x) 5 Zx Z5. For each function, determine f (2x) and 2f (2x) and compare itwith f (x) . Use this to decide whether each function is even, odd,or neither.a) f (x) 5 x 2 2 4d) f (x) 5 2x 3 1 xb) f (x) 5 sin x 1 xe) f (x) 5 2x 2 2 x1c) f (x) 5 2 xf ) f (x) 5 Z2x 1 3 ZxNELChapter 123 pa
NEL Chapter 1 5 1.1 The length is 60 m. The width is 30 m. The dimensions that are 30 m apart and will produce an area of are 60 m 330 m. 1800 m2 y 5 1800 60 530 x 560 or x 5230 x 260 50 or x 130 50 (x 2