Transcription
COM 140Gina’s Notes – Unit 5Saint Leo UniversityExcel Module 3: Performing Calculations with Formulas and FunctionsIn Excel, there many advanced formulas available and the functions are organized in ns from Excel 2010 or earlier, still supported to provide backward compatibilityCubeRetrieve data from multidimensional databases involving online analytical processing (OLAP)DatabaseRetrieve and analyze data stored in databasesDate & TimeAnalyze or create date and time values and time intervalsEngineeringAnalyze engineering problemsFinancialAnalyze information for business and financeInformationReturn information about the format, location, or contents or worksheet cellsLogicalReturn logical (true-false) valuesLookup & ReferenceLook up and return data matching a set of specified conditions form a rangeMath & TrigPerform math and trigonometry calculationStatisticalProvide statistical analyses of data setsTextReturn text values or evaluate textWebProvide information on web-based connections
COM 140Gina’s Notes – Unit 5Saint Leo UniversityAn example of some of the Common Math, Trig, and Statistical functions are listed in the following figure:FunctionDescriptionAVERAGE (number1[,number2, ])Calculates the average of a collection of numbers, where number1,number2, and so forth are numbers or cell referencesCOUNT(value1[,value2, ])Counts how many cells in a range contain numbers, where value1,value2, and so forth are either numbers or cell referencesCOUNTA(value1[,value2, ])Counts how many cells are not empty in ranges value1, value2,and so forth including both numbers and text entriesINT(number)Displays the integer portion of numberMAX(number1[,number2, ])Calculates the maximum value of a collection of number, wherenumber1, number2, and so forth are either numbers or cellreferencesMEDIAN(number1[,number2, ])Calculates the median, or middle, value of a collection of numbers,where number1, number2, and so forth are either numbers or cellreferencesMIN(value1[,value2, ])Calculates the minimum value of a collection of numbers, wherenumber1, number2, and so forth are either numbers or cellreferencesRAND()Returns a random number between 0 and 1ROUND(number,num digits)Round number to the number of digits specified by num digitsSUM(number1[,number2, ])Adds a collection of numbers, where number1, number2, and soforth are either numbers or cell references
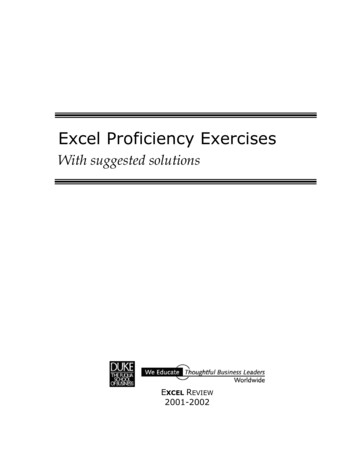
COM 140Gina’s Notes – Unit 5Saint Leo UniversityThere are multiple ways to insert a function; you can type it in, you select a function from the function categoryin the Function Library or you can open the Insert Function dialog box to search for a particular function.
COM 140Gina’s Notes – Unit 5Saint Leo UniversityWhen you want to reference a “cell” you can use absolute, relative, or a mix reference. A relative referencemeans that it will always interpret the value at the relative location of the cell and simply provides the locationof the cell such as “ A4”. Absolute cell reference remains fixed when the formula is copied to a new location,and it uses the before the designation such as “ A 4”. Mixed reference uses both relative and absolutereference, and it “locks” one part of the cell reference while the other part can change, and example would be“ A4” or “ A 4”. Relative references are used to repeat the same formula with cells in different locations.Absolute references are used with different formulas to refer to the same cell. Lastly, the mixed references areseldom used other than when creating tables of calculated values.
COM 140Gina’s Notes – Unit 5Saint Leo UniversityWe use the AutoFill tool to enter formulas and data and complete a series.You can display the current date with the TODAY function. You will practice using WORKDAY function to find thenext business working date. Additionally, you will use the COUNT and COUNTA functions. You will also learn howto use an IF function to return a value based on a condition.You will use are the VLOOKUP function to perform an exact match lookup within your worksheet.
COM 140Gina’s Notes – Unit 5Saint Leo UniversityLastly, you will perform a what-if analysis using trial and error as well as Goal Seek. A what-if analysis lets youexplore the impact that changing input values has on the calculated values in the workbook. With trial-and-errormethod, it requires some guesswork as you estimate which values to change and by how much. Goal Seekautomates the trial-and-error process by allowing you to specify a value for a calculated item, which Excel usesto determine the input value needed to reach that goal. In some ways, this is the opposite of trial and error asgoal seeks allows us to input the answer and then calculates the associated variables to arrive at the answer.Excel Module 4: Analyzing and Charting Financial DataExcel enables you to not only enter your data, formulate, and format it, but also to display it within a chart orgraph. In this section, you will learn how to create all types of charts and graphs. You will also get to use the PMTfunction to calculate a loan payment. You will also use a watermark.A chart can be placed within a worksheet, within a specific range on a worksheet, or inserted as its own tabbedworksheet. You will learn to apply styles to charts, format chart elements, and legends.
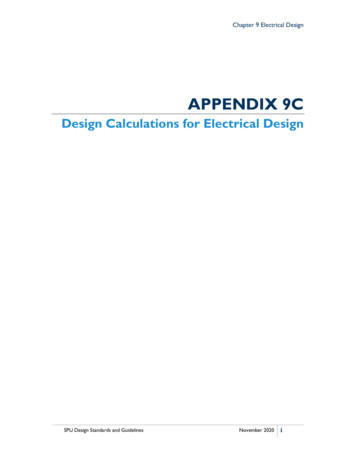
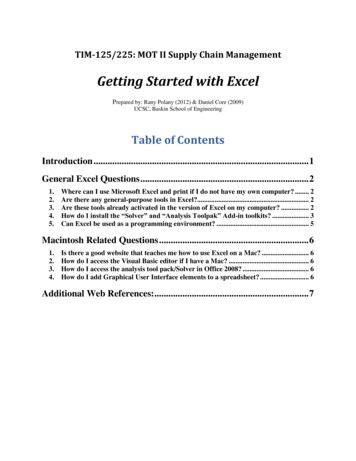
COM 140Gina’s Notes – Unit 5Saint Leo UniversityHere is a table listing the types of charts and their description and subtypes:Chart CategoryDescriptionChart SubtypeColumn or BarCompares values from different categories. Values areindicated by the height of the columns or the length of abar.2-D Column, 3-D Column, 2-D Bar,3-D BarHierarchyDisplays data that is organized into a hierarchy ofcategories where the size of the groups is based on anumber.Treemap, SunburstWaterfall or StockDisplays financial cash flow values or stock market data.Waterfall, StockLineCompares values from different categories. Values areindicated by the height of the lines. Often used to showtrends and changes over time.2-D Area, 3-D AreaStatisticDisplays a chart summarizing the distribution of valuesfrom a sample population.Histogram, Pareto, Box andWhiskerPieCompares relative values of different categories to thewhole. Values are indicated by the area of the pie slices2-D Pie, 3-D Pie, DoughnutX Y (Scatter)Shows the patterns or relationship between two or moresets of values. Often used in scientific studies andstatistical analysesScatter, BubbleSurface or RadarCompares three sets of values in a three-dimensionalchartSurface, RadarComboCombines two or more charts types to make the dataeasy to visualize, especially when the data is widelyvaried.Clustered Column-Line, ClusteredColumn-Line on Secondary Axis,Stacked Area-clustered ColumnPivotChartCreates a chart summarizing data from a PivotTablenoneYou will learn to create the following charts:
COM 140Gina’s Notes – Unit 5 Embedded pie chart & Column Chart Clustered column chart, Stacked column chartSaint Leo University
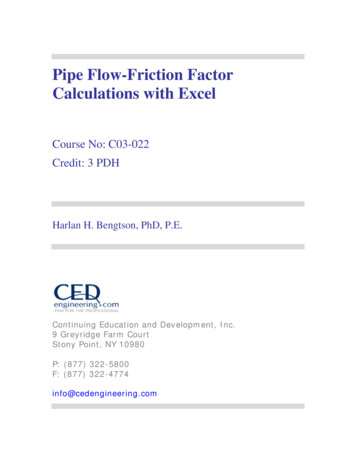
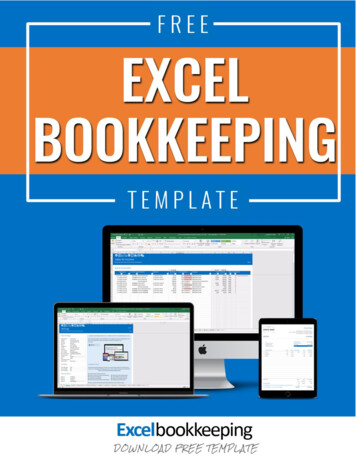
COM 140 Line chart Combination chartGina’s Notes – Unit 5Saint Leo University
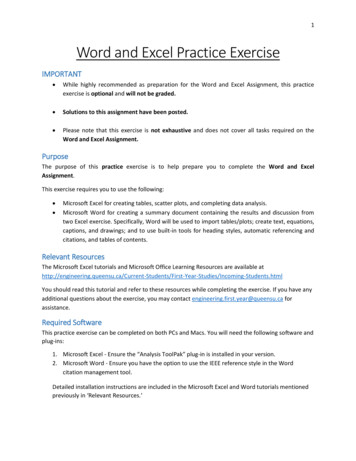
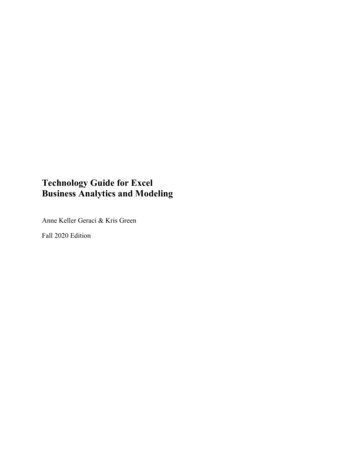
COM 140 Sparklines Data barsGina’s Notes – Unit 5Saint Leo University
COM 140Gina’s Notes – Unit 5Saint Leo UniversityLinks to Supplemental PowerPoints(Access to these links end once your access to this class ends. Please download a copy if you wish to retain acopy for future use.) Excel 2016 M03 PPTExcel 2016 M04 PPTImages used with permission from: Carey, P., DesJardins, C., Shaffer, A., Shellman, M., & Vodnik, S.(2016). New Perspectives Microsoft Office 365 & Office 2016. Boston, MA: Cengage Learning.
Waterfall or Stock Displays financial cash flow values or stock market data. Waterfall, Stock Line Compares values from different categories. Values are indicated by the height of the lines. Often used to show trends and changes over time. 2-D Area, 3-D Area Statistic Displays a chart summari