Transcription
Scientific Computing with MATLAB3. Manipulating Data SetsDra. K.-Y. Daisy FanDepartment of Computer ScienceCornell UniversityIthaca, NY, USAUNAM IIM 2012
Working with data and filesData that you have created or manipulated usingMATLAB can be saved to a data file for future use.Or you may use data provided by others. The MATLAB internal formatformat, matmat, is convenientif you and the future user uses MATLAB TheTh ASCII type isi universal,il butb oftenfrequiresimore low-level work Spreadsheet format is commonly used Imageg data comes in manyy form, with JPEGJas oneof the most commonly used.3
By the end of this lecture, you will be able to Save Workspace variable values to MATLAB’s.mat formatted file; import .mat data toWorkspaceSave Workspace matrices to ASCII files; importASCII files as matricesIImportddata fromfa spreadsheetdhImport an image file, process the data, and writeback an image fileWork with irregularlygy formatted ASCII files4
Saving Workspace data to filesave filename Simple way to save data with basic formatsOptions include file type and saving selectvariables.i blSSome examples:l% myFile.mat stores all variable values:sa e myFilesavem File% myFile.mat stores values of variables x,u:save myFileyx,, u% myFile.txt stores values of matrices ma and% mi in ASCII (plain text) format:save myFile.txtFil t t ma mii -asciiii% matrices must have same no. of columns!5
Importing .mat data into Workspaceload filenameOptions include loading only specified variables.variables Examples:% Load all variable values from myFile.mat:loadoad myFileye% Load values from myFile.txt as a matrix:load myFiley% Any file with an extension that is not% .mat is treated as ASCII file.% Matrix name now in workspace is myFile.myFile% Load values from myFile.dat as a matrix:load myDatmyDat.datdat% Matrix name now in workspace is myDat6
Importing data from a spreadsheet (xls)[ar, txt, raw] xlsread(filename) Options include specifying the rangerange, sheetFilename does not need to include extension .xlsWhich versions of Excel spreadsheets? If your machine has Excel for windows—all versionssupported by that version of Excel, e.g., xls, xlsx, If your machine does not have Excel for windows—basic functionality only (no range, no sheet, i.e., Excel97-2003)7
Importing data from a spreadsheet (xls)[ar, txt, raw] xlsread(filename) ar – a numeric array storing only the numericvalues;lnon-numerici ddatat isi storedt d as NaNN Ntxt – a cell array storing only the text (nonnumeric data); non-text is stored as the emptystring, ’’raw – a cell array storing all the data; each cell ispg on the datanumeric or text depending8
Single quotes enclose strings in MatlabAnything enclosed in single quotes is a string (eveniff it looksl k likel k somethingh else)l ) ‘100’is a character array (string) of length 3100 is a numeric value‘pi’ is a character array of length 2piis the built-in constant 3.1416 ‘x’ is a character (vector of length 1)xmay be a variable name in your program9
Strings are vectors VectorsAssignment v [7 0 5]; s ‘hello’;Indexing x v(3); % x is 5v(1) 1; % v is [1 0 5]w v(2:3);(2 3) % w iis [0 5] : notationv 2:5; % v is [2 3 4 5]Appendingv [v [4 6]];% v is [7 0 5 2 4 6]: notations ‘a’:‘g’; % s is ‘abcdefg’ ConcatenationIndexingc s(2); % c is ‘e’s(1) ‘J’; % s is ‘Jello’t s(2:4);t (2 4) % t iis ‘ell’‘ ll’v [7 0 5];v(4) ( ) 2;;% v is [[7 0 5 2]] StringsgAssignmentAppendings ‘duck’;s(5) ( ) ‘s’;; % s is ‘ducks’ Concatenations [s ‘ quack’];% s is ‘ducksducks quack’quack10
Some useful string functionsstr ‘CsCs ower(str)upper(str)%%%%%7[1 1 0 0 0 0 0][0 0 1 0 0 0 0]‘cs 1112’‘CS 1112’ischar(str)% Is str a char array? True (1)strcmp(str(1:2),‘cs’)t( t (1 2) ‘ ’)% Compare strings str(1:2) & ‘cs’. False (0)strcmp(str(1:3),‘CS’)strcmp(str(1:3),CS )% False (0)11
Characters arrays We have used strings already: n input(‘Next number: ’) sprintf(‘Answer is %d’, ans)A stringg is made upp of individual characters,, so a stringg isa 1-d array of characters‘UNAM iim2012!’ is a character array of length 13; ithas 7 letters, 4 digits, 1 space, and 1 symbol.‘U’‘N’‘A’‘M’‘ ��‘!’ Can have 2-d array of characters as ’‘2’2 4 matrix
Matrix vs. Cell ArrayVectors and matrices storeyp invalues of the same typeall componentsA cell array is a special arraywhose individual componentsmay contain different types ofdata-43.12-19111.15x1matrix‘c’‘o’ ‘m’ ‘ ’‘s’‘1’ ‘1’ ‘1’ ‘2’‘ ’‘M’ ‘a’‘t’‘ ’‘ ’‘ ’‘L’‘A’ ‘B’‘ ’4x5matrix-15‘.’‘ ’‘c’‘o’ ‘m’‘ ’7.91‘M’.4-173 2 cell array13
Cell Arrays of StringsC { ‘Alabama’,’New York’,’Utah’}C‘Alabama’‘New York’‘Utah’C { ‘Alabama’;’New York’;’Utah’}C ‘Alabama’‘New York’1-d celly ofarraystrings‘Utah’Contrast withCi h2-d array of charactersM [‘Alabama ’; .‘New York’; .‘Utah’]M‘A’ ‘l’ ‘a’ ‘b’ ‘a’ ‘m’ ‘a’ ‘ ‘‘N’ ‘e’ ‘w’ ‘ ‘ ‘Y’ ‘o’ ‘r’ ‘k’‘U’ ‘t’ ‘a’ ‘h’ ‘ ‘ ‘ ‘ ‘ ‘ ‘ ‘
Use braces { } for creating and addressing cell arraysMatrix CreateCell Array m [ 5, 4 ; 1 2; 1,0, 8 ] Addressingm(2 1) pim(2,1)CreateC { ones(2,2), 4; ‘ b ’ , ones(3,1)‘abc’(3 1) ; 9, ‘a cell’} AddressingC{2,1}C{21} ‘ABC’ABCC{3,2} pidisp(C{3,2})15
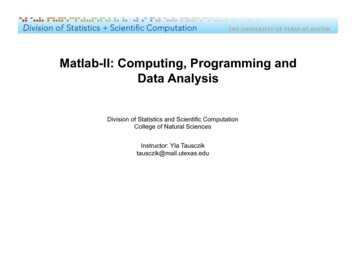
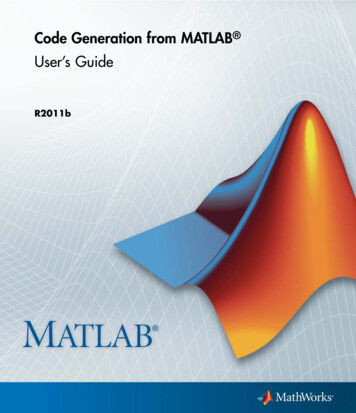
A picture as a matrix1458-by-20841501511531541 541561571591 91601521531551561581 815915515615815916116216
Images can be encoded in different ways Common formats include JJPEG:JointJPhotographicg p ExpertspGrouppGIF: Graphics Interchange FormatData are compressedpWe will work with jpeg files: imread: read a .jpg file and convert it to a “normalnormalnumeric” array that we can work withimwrite: write an array into a .jpg file (compresseddata)17
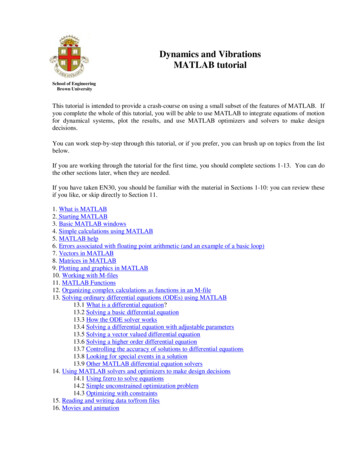
Grayness: a value in [0.255]0 black255 whiteThese are integer valuesType: uint81501511531541 541561571591 91601521531551561581 815915515615815916116218
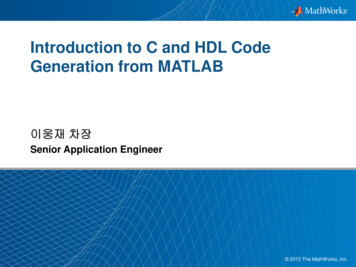
Reading a jpeg file and displaying the image% Read jpg image and convert to% an array PP imread(‘bwduck.jpg');jpg% Show the data in 3-d array P as% an imageimshow(P)19
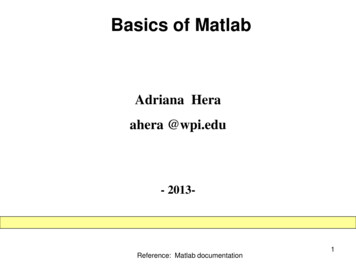
A color picture is made up of RGB matrices 3-d arrayE.g., color image data isstored in a 3-d array 2102132142150 A(i,j,1) 2550 A(i,j,2) 2550 A(i,j,3) 25520
A color picture is made up of RGB matrices 3-d arrayColor image3-d Array0 A(i,j,1) 2550 A(i,j,2) 2550 A(i,j,3)( ,j, ) 255OOperationstion iimages amountt tto operationstionmatrices!21
Problem: produce a negative22
Problem: produce a negative “Negative” is what we say, but all color values areppositive numbers!Think in terms of the extremes, 0 and 255. Thengjustj means the oppositeppside.the “negative”So 0 is the opposite of 255;1 254;5 250;30 225;x 255-x23
function newIm toNegative(im)% newIm is the negative of image im% im, newIm are 3-d arrays; each component is uint8[nr,nc,np] size(im);newIm zeros(nr,nc,np,’uint8’);% dimensions of im% initialize newImfor r 1:nrfor c 1:ncfor p 1:npnewIm(r,c,p) ;endendend24
function newIm toNegative(im)% newIm is the negative of image im% im, newIm are 3-d arrays; each component is uint8[nr,nc,np] size(im);newIm zeros(nr,nc,np,’uint8’);% dimensions of im% initialize newImfor r 1:nrfor c 1:ncfor p 1:npnewIm(r,c,p) 2552- im(r,c,p);endendfunction newIm toNegative(im)end% newIm is the negative of image im% im, newIm are 3-d uint8 arraysnewIm 255 – im;% vectorized code!25
Finding Edges26
What is an edge?Near an edge, grayness 010010010010020010010010010010027
General plan for showing the edges in in image Identify the “edge pixels”Highlight the edge pixels make edge pixels white; make everything else 010010010010028
General plan for showing the edges in in image Identify the “edge pixels”Highlight the edge pixels make edge pixels white; make everything else 200100100100100100BLACK29
Finding Edges30
The Rate-of-Change-ArraySuppose A is an image array with integer valuesbetween 0 and 255.j be the maximum difference betweenLet B(i,j)and its eight neighbors.So B(i,j) is the maximum value inA(A(max(1,i-1):min(m,i 1),.(1 i 1) i ( i 1)max(1,j-1):min(n,j 1))- A(i,j)Neighborhood of A(i,j)31
Rate-of-change example908165626059565758Rate-of-change atmiddleiddl pixeli l iis 30Be careful! In “uint8 arithmetic”57 – 60 is 032
The Pixel (i,j) NeighborhoodiMin i-riMax i rjMin j-rjMax j rC A(iMin:iMax,jMin:jMax)(,jj)mAnr 1r 233
The Pixel (i,j) NeighborhoodiMin max(1,i-r)iMax min(m,i r)min(m i r)jMin max(1,j-r)jMax min(n,j r)C A(iMin:iMax,jMin:jMax)(,jj)mAnr 1r 234
Edge finding: Rate-of-change matrixA: grayness valuesB: rate-of-change valuesiAijBijjLet N be the set of subscripts (p,q) that is the neighborhood of (i,j) Bij max Apq Aij ( p , q ) Ν
Edge finding: Rate-of-change matrixA: grayness valuesB: rate-of-change valuesE: edge valuesiAijBijjLet N be the set of subscripts (p,q) that is the neighborhood of (i,j) Bij max Apq Aij ( p , q ) Ν Highg rate of changeg Abruptp changeg in ggraynessy An edgeg white ifEij black ifBij Bij Eij
function Edges(jpgIn,jpgOut,tau)% jpgjpgOut is the “edgeg diagram”gof imageg jpgIn.jpg% At each pixel, ifrate-of-change tau% then the pixel is considered to be on an edge.A iimread(jpgIn);d(j I )fifigure; iimshow(A)h (A)A rgb2gray(A);Built-in function to[m,n][, ] size(A);( );convert to grayscalegrayscale.B zeros(m,n,’uint8’);Returns 2-d array.for i 1:mfor j 1:nB(i j) B(i,j)?endend38
Recipe for rate-of-change B(i,j)% The 3-by-3 subarray that includes A(i,j)% and its 8 neighbors (for an interior pixel)Neighbors A(i-1:i 1,j-1:j 1);% Subtract A(i,j) from each entryDiff abs( double(Neighbors) – double(A(i,j)) );% Compute largest value in each columncolMaxcoa max(Diff);a ();% Compute the max of the column max’sB(i,j) max(colMax);39
function Edges(jpgIn,jpgOut,tau)% jpgOut is the “edge diagram” of image jpgIn.% At each pixel, ifrate-of-changerate of change tau% then the pixel is considered to be on an edge.A imread(jpgIn); figure; imshow(A)A rgb2gray(A);[m,n] size(A);B zeros(m,n,’uint8’);for i 1:mfor j 1:nNeighbors A(max(1,i-1):min(i 1,m), .max(1,j-1):min(j 1,n));endend41
function Edges(jpgIn,jpgOut,tau)% jpgOut is the “edge diagram” of image jpgIn.% At each pixel, ifrate-of-changerate of change tau% then the pixel is considered to be on an edge.A imread(jpgIn); figure; imshow(A)A rgb2gray(A);[m,n] size(A);B zeros(m,n,’uint8’);for i 1:mfor j 1:nNeighbors A(max(1,i-1):min(i 1,m), .max(1,j-1):min(j 1,n));B(i j)B(i,j) max(max(abs(double(Neighbors)–(( b (d bl (N i hb) .double(A(i,j)))));endend42
“Edge pixels” are now identified; display them with maximum brightness 0909008900000890000thresholdif B(iB(i,j)j) tauB(i,j) 255;endB(i j)B(i,j)0000000008989890089890008989000000000000 255 255 25500 255 255000 255 2550000 25500000 255000043
function Edges(jpgIn,jpgOut,tau)% jpgOut is the “edge diagram” of image jpgIn.% At each pixelpixel, ifraterate-of-changeof change tau% then the pixel is considered to be on an edge.A imread(jpgIn); figure; imshow(A)A rgb2gray(A);[m,n] size(A);B zeros(m,n,’uint8’);for i 1:mfor j 1:nNeighbors A(max(1,i-1):min(i 1,m), .max(1 j 1):min(j 1 n));max(1,j-1):min(j 1,n));B(i,j) max(max(abs(double(Neighbors)– .double(A(i,j)))));if B(iB(i,j)j) ttauB(i,j) 255;endendend44
function Edges(jpgIn,jpgOut,tau)% jpgOut is the “edge diagram” of image jpgIn.% At each pixelpixel, ifraterate-of-changeof change tau% then the pixel is considered to be on an edge.A imread(jpgIn); figure; imshow(A)A rgb2gray(A);[m,n] size(A);B zeros(m,n,’uint8’);for i 1:mfor j 1:nNeighbors A(max(1,i-1):min(i 1,m), .max(1 j 1):min(j 1 n));max(1,j-1):min(j 1,n));B(i,j) max(max(abs(double(Neighbors)– .double(A(i,j)))));if B(iB(i,j)j) ttauB(i,j) 255;endendendimwrite(B,jpgOut,’jpg’)45
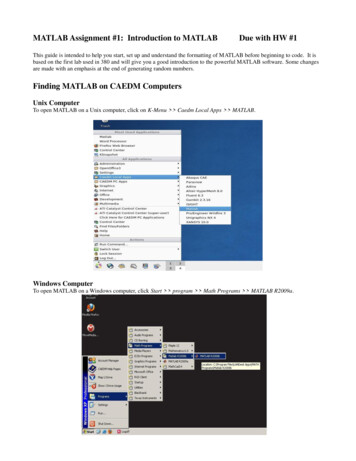
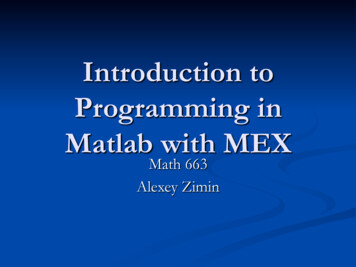
tau 3046
Edge finding: Effect of edge threshold,
tau 20
By the end of this lecture, you will be able to Save Workspace variable values to MATLAB’s .mat formatted file; import formatted file; import .mat.mat data to data to Workspace Save Workspace matrices to ASCII files; import ASCII files as matrices I d f h dImport data from a spreadsheet Import an