Transcription
19III. QUALITY OF LIFE OECD 2011Compendium of OECD Well-Being Indicators
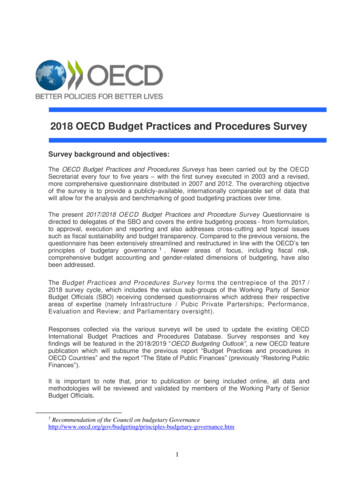
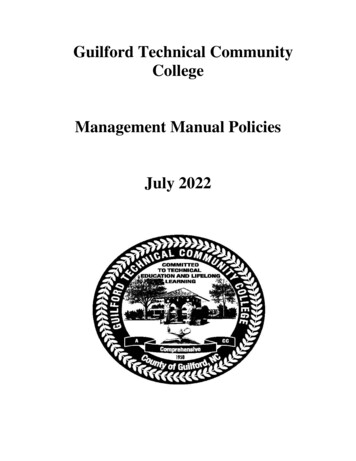
20WHY DOES IT MATTER FOR WELL-BEING?People‟s health is one of the most valued aspects of people‟s life. Surveys in many countries consistently foundthat people put health status, together with jobs, at the top of what affects their living conditions. People‟s healthstatus matter in itself, but also for achieving other dimensions of well-being, such as having good jobs andadequate income, being able to participate as full citizens to community life, to socialise with others, to attendschool and adult education.INDICATORSThe indicators of people‟s health status presented here are life expectancy at birth and people‟s self-reportedsatisfaction with their health status. Life-expectancy is the standard measure of the length of people‟s life. Life-expectancy measures howlong on average people could expect to live based on the age specific mortality rates currentlyprevailing. Life-expectancy can be computed at birth and at various ages. The indicator of self-reported satisfaction with health status is based on questions of the type: “How isyour health in general?”. Data are based on general household surveys or on more detailed HealthInterviews undertaken by statistical offices in various countries.Life-expectancy at birth is based on mortality records that, at least in OECD countries, are among the mostreliable statistics. The length of life is however not necessarily informative of the quality of health conditions, andthus well-being of individuals. Indicators of perceived health status provide an imperfect proxy of the underlyingconcept of morbidity, as it may be affected by cultural influences and country-specific contexts. Measuringmorbidity is challenging as morbidity encompasses a variety of conditions (physical and mental) of varyingseverity (e.g. disability, chronic conditions) for which internationally comparable instruments are not currentlyavailable.MEASURING AVERAGE OUTCOMES AND TRENDSAmong OECD countries, life-expectancy at birth in 2008 ranged between more than 82 years in Japan andSwitzerland, and around 74 years in a number of central and eastern European countries. Life-expectancy inChina, Brazil, Indonesia and in the Russian Federation is lower than the OECD average and it is much lower inIndia and South Africa. Poorer countries have converged rapidly towards the levels of life-expectancy prevailingin richer ones, but there have also been important set- backs – as in the case of the Russian Federation duringthe transition to a market economy, and of South Africa, due to the devastating HIV/AIDS epidemic.The percentage of adults reporting good or very good health was 85% or more in Switzerland and countries inNorth America and Oceania but only half as high in Korea, Japan, Portugal and the Slovak Republic. Selfreported health has recorded declines since 1995 in Japan, Austria and Slovak Republic. It has increasedsignificantly in Portugal, Poland, Hungary, Czech Republic and Turkey. No information is available for emergingcountries.WHAT DO WE KNOW ABOUT INEQUALITIES IN HEALTH STATUS?Women have longer life-expectancy than men but also report lower satisfaction with their health status.Satisfaction with health also declines with people‟s age. Regardless of countries‟ political structures or healthsystems, people with lower income or education experience higher mortality and morbity (OECD, 2010a), due toa combination of more difficult life- and work-circumstances, less healthy life-styles (e.g. higher incidence ofsmoking and obesity) and lower access to appropriate health care.There is a positive relationship across countries between average measures of lifeexpectancy and measures ofthe dispersion in the ages of death, suggesting that countries where the influence of socio-economic backgroundon life expectancy is lower tend to be those where citizens live the longest. OECD 2011Compendium of OECD Well-Being Indicators
21Life expectancy at birthNumber of yearsNote: The first available year is 1961 for Canada, Italy and New Zealand; 1970 for the Russian Federation. The latestavailable year is 2007 for Belgium, Canada, Italy and the United Kingdom.Source: OECD Health Data, OECD (2009), Health at a Glance 2009: OECD Indicators, OECD, ParisSelf-reported healthPercentage of people reporting good/very good healthNote: The first available year is 1996 for Luxembourg and Poland; 1997 for Australia, Belgium, New Zealand, Spainand Switzerland; 1998 for Sweden; 1999 for Austria, the Czech Republic, Italy and Portugal; 2000 for Chile,Denmark, Hungary and Mexico; 2002 for France and Israel; 2003 for Turkey; 2004 for Estonia; 2006 Greece, and2007 Slovenia. The latest available year is 2006 for Chile and Mexico; 2007 for Australia, Japan, New Zealand andTurkey; and 2009 for Spain and Switzerland. Results for countries marked with a "1" are not directly comparable withthose for other countries, due to differences in reporting scales, which may lead to an upward bias in the reportedestimates.Source: EU-SILC; OECD Health Data, OECD (2010), Health at a glance: Europe 2010, OECD, Paris.For further reading OECD (2010a), Health Data – Statistics and Indicators, OECD, Paris OECD (2010b), Heath Care Systems: Efficiency and Policy Settings, OECD, Paris OECD (2010c), Obesity and the Economics of Prevention – Fit Not Fat, OECD, Paris United Nations (2011), Washington Group on Disability group/Washington.htm WHO (2011), World Health Organisation Global Infobase, https://apps.who.int/infobase/ OECD 2011Compendium of OECD Well-Being Indicators
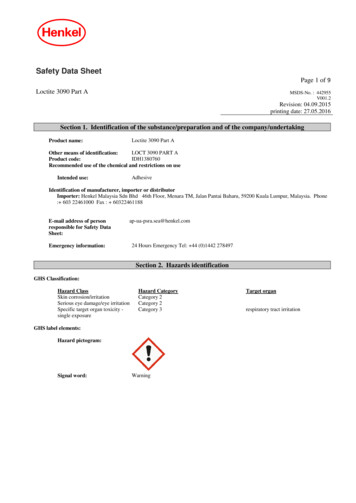
22WHY DOES IT MATTER FOR WELL-BEING?Striking the right balance between the commitments of work and those of private life is central to people‟s wellbeing. Too little work can prevent people from earning enough to attain desired standards of living. But too muchwork can also have a negative impact on well-being if people‟s health or personal lives suffer as a consequence,or if they cannot perform other important activities, such as looking after their children and other relatives, havingtime for themselves, etc. (OECD, 2011a). The way people allocate their time is determined by both necessity andpersonal circumstances, which in turn are shaped by individuals‟ preferences and by the cultural, social andpolicy contexts in which people live.INDICATORSThree indicators of work and life balance are presented here: The first indicator shows the proportion of employees who usually work for pay for more than 50 hoursper week. The data exclude self-employed workers who are likely to choose deliberately to work longhours. The second indicator presents data from national time use surveys on the hours devoted to leisure andpersonal care in a typical day for the population aged 25-64 who is more likely to face work-life conflicts.Leisure includes activities such as sports, participating/attending events, visiting or entertaining friends,hobbies, etc. Personal care includes sleeping, eating and drinking, and personal or household medicalservices and travel related to personal care. The third indicator shows the employment rate of mothers with children aged 6-14 years. Theemployment rate for all women of roughly the same age group is also shown to provide contextualinformation on labour market access for women overall (OECD, 2010).The first two indicators provide an indirect and direct measure of available time to spend on non-work activitiescontributing to individual and family well-being. While informative of a balanced time allocation, they do not shedany light on the quality of the time spent outside work and thus of their possible enjoyment. The third indicatorprovides information on the ability of mothers to meet the challenge of combining paid work and familyresponsibilities (OECD, 2007); it is however not illustrative of the possible time crunch, stress or frustration thatthose mothers may feel. .MEASURING AVERAGE OUTCOMES AND TRENDS8On average, 8% of OECD employees work more than 50 hours per week. This proportion is highest in Turkey,where it is close to 50%, followed by Mexico and Israel. In the Netherlands, Sweden and Denmark, long workinghours are rare with only around 1 to 2% of employees working over 50 hours per week on a regular basis. Asimilar pattern is also visible for the Russian Federation, the only emerging country with available information.On average, people in OECD countries spend over 15 hours per day on personal care and leisure, with less thanone-third of this amount devoted to leisure. In Mexico and Japan, personal care and leisure takes up around 14hours, compared to around 16.5 in Denmark and Belgium. Time allocation in South Africa is roughly similar to thelattercountries.On average, across the OECD, 66% of mothers with children of compulsory school age are working in somecapacity, compared to an average employment rate for all women aged 25 to 49 of 72%. The maternalemployment rate varies from a high of around 87% in Iceland, to a low of 24% in Turkey. The gap betweenmaternal employment rate and women employment rate is higher in countries where women‟s participation in thelabour market is lower. Cultural factors and inflexible working arrangements and family policies in support ofworking women may explain this pattern.WHAT DO WE KNOW ABOUT INEQUALITIES IN WORK-LIFE BALANCE?Gender is a key determinant of inequalities in work and life (OECD, 2011b). Although men spend longer hours inpaid work than women, women have less leisure time than men due to the longer hours that women devote tounpaid work such as housework and caring for children and elderly relatives. Age is also a factor shaping worklife-balance, with the young and elderly having more leisure time than the working-age population.8 Unfortunately, employee-only data on usual working hours are not available for Japan and Korea – two countries with very highannual and weekly working hours. OECD 2011Compendium of OECD Well-Being Indicators
23Employees working very long hoursPercentage of employees working more than 50 hours a weekNote: Usual hours worked in the main job for Austria, Canada, the Czech Republic, Finland, Hungary, Mexico, Poland, the Slovak Republic,Sweden, Turkey and the United States, and in all jobs for other countries. The first available year is 1996 for Chile; 1998 for Hungary; 2001 forAustria; 2002 for Estonia, Norway, Poland, Slovenia and Sweden; and 2004 for the Czech Republic and Finland. The latest available year is 2007 forIsrael and the Netherlands; and 2008 for Chile and the Russian Federation.Source: OECD (2007), Babies and Bosses - Reconciling Work and Family life: A Synthesis of findings for OECD countries, OECD, Paris; SwissFederal Statistical Office (FSO)Time devoted to leisure and personal careHours per day for the population aged 25-64, latest available yearNote: Data refer to 1998-99 for France and New Zealand; 1999 for Portugal and India; 1999-2000 for Estonia, Finland and Hungary; 2000 for SouthAfrica; 2000-01 for Norway, Slovenia, Sweden and the United Kingdom; 2001 for Denmark; 2001-02 for Germany; 2002-03 for Italy and Spain; 200304 for Poland; 2005 for Belgium, Canada and Ireland; 2005-06 for the Netherlands; 2006 for Australia, Japan and Turkey; 2008 for United States andChina; 2008-09 for Austria and 2009 for Korea and Mexico. The indicator refers to people aged 20-59 for Hungary and 30-59 for Korea. Data havebeen normalized to 1440 minutes per day.Source: OECD Time-use survey database; OECD (2007), Babies and Bosses - Reconciling Work and Family life: A Synthesis of findings for OECDcountries, OECD, Paris; OECD (2009), Society at a Glance 2009: OECD Social Indicators, OECD, Paris;Employment rate of women with children of compulsory school age2008 or latest available yearNote: Maternal employment rates refer to mothers with a child aged between 6 and 14 for Australia, Canada, Denmark, Iceland, Japan, NewZealand, Sweden, Switzerland and the United States. Data refer to 1999 for Denmark; 2001 for Canada; 2002 for Iceland; 2005 for Australia, Japan,New Zealand and the United States; 2007 for Sweden; and 2009 for Switzerland.Source: OECD Family database; OECD (2007), Babies and Bosses - Reconciling Work and Family life: A Synthesis of findings for OECD countries,OECD, Paris; OECD (2006), Society at a Glance 2006: OECD Social Indicators, OECD, Paris; www.oecd.org/els/social/family/database; and SwissLabour Force Statistics (LFS).For further reading OECD (2011a), Doing Better for Families, OECD, Paris. www.oecd.org/social/family/doingbetter OECD (2011b), “Cooking, caring, building and repairing: Unpaid Work around the World”, Society at a Glance 2011, OECD,Paris. www.oecd.org/els/social/indicators/SAG OECD (2010), OECD Employment Outlook, Moving beyond the Jobs Crisis, OECD, Paris. OECD (2007), Babies and Bosses - Reconciling Work and Family Life: A Synthesis of Findings for OECD Countries, OECD,Paris. OECD 2011Compendium of OECD Well-Being Indicators
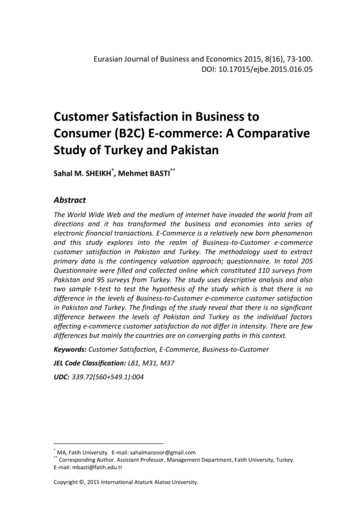
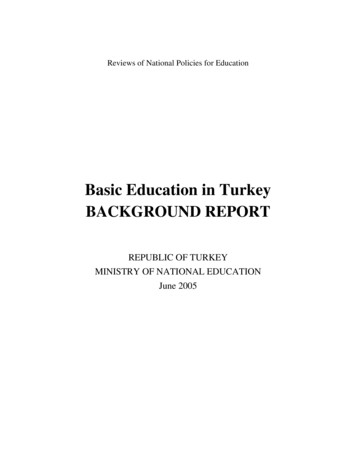
24WHY DO THEY MATTER FOR WELL-BEING?Education is a basic need and an important aspiration of people. It has a strong influence on their well-being.Better educated individuals earn higher wages and have a higher probability to have a job. They live longer lives,report a better health status and a lower occurrence of chronic diseases and disabilities. Better educatedindividuals also participate more actively in politics and in the community where they live, they commit fewercrimes and rely less on social assistance. At the level of the society as a whole, better education leads to higherGDP growth, higher tax revenues and lower social expenditures.INDICATORSThe indicators of education outcomes presented here refer to the educational attainment of the adult populationand the literacy of 15-years old students. The first indicator profiles the education of the adult population as captured through formal educationalqualifications. Educational attainment is measured as the percentage of the adult population (15 to 64years of age) holding at least an upper secondary degree, as defined by the OECD-ISCED classification. The second indicator measures the capacity of 15 years-old students (those near the end of compulsoryeducation) to understand, use, reflect on and engage with written texts in order to achieve their owngoals, to develop their knowledge and potential. This indicator comes from the 2009 edition of OECD‟sProgramme for International Student Assessment (PISA), which focused on reading.The two indicators presented here are good measures of competencies which help individuals undertake a broadrange of tasks necessary to live in modern societies. While competencies of youths aged 15 are a key driver ofachievements in later stages of people‟s life, it is also important to consider the skills of the adult population.Such information will be available through the OECD Programme for the International Assessment of AdultCompetencies (PIAAC), whose first results are expected in 2013. In the future it will be also important to extendthe measurement of competencies to include social and emotional skills as well as civic competencies which arekey to the well-being of individuals and the society (OECD, 2010e).MEASURING AVERAGE OUTCOMES AND TRENDSThe large majority of the adult population in OECD countries holds at least an upper secondary educationdegree. This proportion is above 90% in Czech Republic, but is below 35% in Portugal, Turkey and Mexico. Theshare of the adult population who has reached at least upper-secondary education has increased by around 9percentage points in the OECD as a whole over the past ten years, with larger increases in Ireland, Spain,Hungary and Korea and small declines in Denmark. In Brazil, the only emerging country with comparableinformation, educational attainment level is similar to that of the OECD countries with the least educatedpopulation, and has not recorded significant changes in the recent period.Average reading scores of 15 years-old pupils vary strongly across countries. They are much lower than theOECD average in Mexico and Chile, as well as in major emerging countries, and much higher in Finland andKorea. When looking at changes over the period 2000 to 2009, Chile, Israel, Portugal and Poland recordedsubstantial improvements, while substantial declines occurred in Ireland and Sweden. These trends have led to asmall decline in cross-country differences (OECD, 2010a). In emerging countries, reading scores are generallylower than in OECD countries, but have risen significantly in some of them, as for instance in Brazil andIndonesia.WHAT DO WE KNOW ABOUT INEQUALITIES IN EDUCATION AND SKILLS?Educational outcomes vary signficantly within each country. Educational attainment is higher for youngergenerations (OECD, 2010b). In OECD countries women are generally more educated than men, while a differentgender pattern in educational attainment is visible in some emerging countries. Girls have higher readingcompetencies but, often, lower mathematics skills. Children of immigrant origins display lower competencies thanchildren of native born (OECD, 2010c). In addition, cognitive skills are strongly influenced by the socio-economicbackground of the family where students live (OECD, 2010d), particularly in Hungary, Belgium, Turkey, Chile,Luxembourg and Germany.There is a positive relationship between average achievements and equity of achievements (OECD, 2010d).Countries where 15-years old display higher cognitive skills tend to be characterised by a more equitabledistribution of outcomes, suggesting that the trade-off between equity and efficiency is either limited or nonexistent. This is in line with research showing that policies which are beneficial for efficiency have no adverseeffect on equity (Schütz et al., 2007). OECD 2011Compendium of OECD Well-Being Indicators
25Educational attainmentPercentage of adults with at least upper secondary education200819971009080706050403020100Note: The 2008 figure for Japan refers to an OECD estimate. The first available year is 1998 for Denmark, Italy, theNetherlands and Portugal; 1999 for Luxembourg; 2002 for Estonia, Israel and Slovenia; 2007 for Chile and Brazil.For Norway and Switzerland data for 1997 and 2008 are not strictly comparable due to changes in the educationalclassification.Source: OECD (2010), Education at a glance 2010: OECD Indicators, OECD, ParisLiteracyPISA scores in reading20092000550500450400350Note: PISA scores are measured on a scale which is normalised to be 500 for the OECD average of the countriesin which PISA survey has been conducted.Source: OECD (2010), PISA 2009 at a glance, OECD, Paris.For further reading OECD (2010a), PISA 2009 Results: Learning Trends. Changes in Student Performance since 2000, Volume V, OECD,Paris. OECD (2010b), Education at a Glance, OECD, Paris OECD (2010c), PISA 2009 Results: What Students Know and Can Do, Volume I, OECD, Paris. OECD (2010d), PISA 2009 Results: Overcoming Social Background, Equity in Learning Opportunities and Outcomes,Volume II, OECD, Paris. OECD (2010e), Improving Health and Social Cohesion through Education, OECD, Paris. Schütz, G., M. R. West and L. Wöbmann (2007), “School Accountability, Autonomy, Choice, and the Equity of StudentAchievement: International Evidence from PISA 2003”, OECD Education Working Papers, No. 14, OECD, Paris. OECD 2011Compendium of OECD Well-Being Indicators
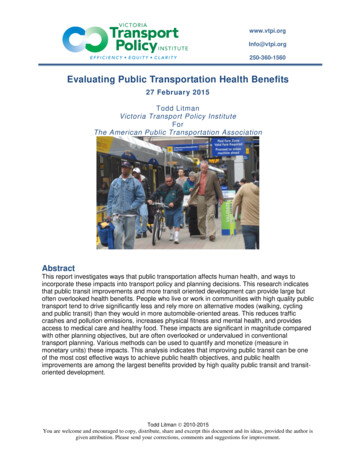
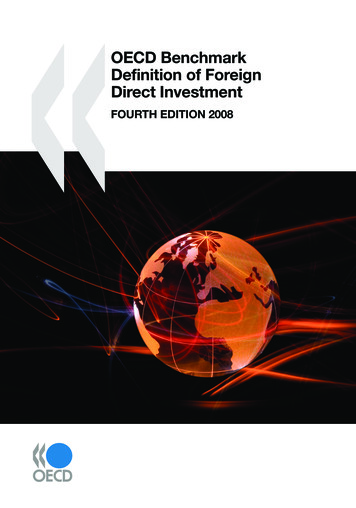
26WHY DO THEY MATTER FOR WELL-BEING?Humans are social creatures. The frequency of their contacts with others and the quality of their personalrelationships are crucial determinants of well-being. People get pleasure from spending time with others, be ittheir family, friends or colleagues. Activities are more satisfying when shared with others. Furthermore, socialnetworks can provide material and emotional support in times of need, as well as providing access to jobs andother opportunities. The nature of social interactions also has wider implications beyond the immediate socialcircle, impacting levels of trust within their community, which is an important driver of other outcomes includingdemocratic participation, crime and health (OECD, 2001).INDICATORSThe indicators of social connections presented here refer to the frequency of contact with others and the supportoffered by social networks. The first indicator, available only for selected European countries, shows the proportion of people whoreport socialising with friends and relatives at different frequencies (i.e. once a month, once a week, andevery day). The data shown here present the proportion of respondents declaring that they socialise witheither relatives or friends at least once a week. They are taken from the special module of the EuropeanSurvey on Income and Living Conditions (EU-SILC) on social participation. Data for non-EU countriesare not comparable and therefore not included in this Compendium. The second indicator shows the share of people in OECD and selected non-OECD countries who saythat, in times of need, they can count on someone to help. Data are taken from the Gallup World Poll.The first indicator provides a good proxy of the frequency of human contacts but not necessarily of the strengthsof these bonds, nor of the quality of time spent with others and of the pleasure derived from it. The secondindicator remedies some of these limitations, by measuring the perceived strength of social networks. The OECDis undertaking work to improve the collection of comparable data on important aspects of social capital, includingindicators on social contact and social network support (OECD and UK Office of National Statistics 2002).MEASURING AVERAGE OUTCOMES AND TRENDSOver half of the European population socialises with friends at least once a week, and for a significant proportionof people (around 1 in 5) socialising with friends is a daily occurrence. However, there are large differencesbetween countries. For example, in Poland only around 40% of people see friends and relatives once a week,whereas this share is around 80% in Greece. Only in France, Hungary, the Slovak Republic, the Czech Republic,Belgium and Iceland is it more common to socialise with relatives than with friends. In France and Hungary thereis also a relatively low share of the population socialising with friends on a weekly basis.Across OECD countries, around 90% of people say that they have at least one person they can count on in timesof need. The countries with weakest support networks are Greece, Korea, Chile and Mexico, and those with thestrongest support networks are Iceland, the United Kingdom and Ireland. The share of respondents declaringthat they have no one to turn to in case of need is more than four times higher in Greece and Korea than in theUnited Kingdom and Iceland. Perceived social network support is generally lower in emerging countries than inOECD countries, in particular in India and China.WHAT DO WE KNOW ABOUT INEQUALITIES IN SOCIAL CONNECTIONS?Men are more likely to have contacts with friends at least once a week, while women are more likely to havecontact with relatives. Age and income also affect the frequency of social contacts. Poor people are roughly twiceas likely to have no contact with friends or relatives. The elderly are three times more likely to report no contactswith friends than the general population.Education and economic status also influence social network support. Over 90% of people with secondary ortertiary education can count on someone for help in an emergency, compared with only 72% of people with onlyprimary education. Similar differences apply between upper and lower income quintiles, with 92% of top earnerssaying they can count on someone, compared with 73% of people at the bottom of the income ladder. OECD 2011Compendium of OECD Well-Being Indicators
27Contact with othersPercentage of people socialising with friends or relatives at least once a week during a usual year, 2006Note: The indicator refers to the percentage of friends/relatives the respondent gets together with in his/her sparetime (i.e. after working hours, at weekends, or for holidays) and with whom the respondent shares private mattersmore than once a week during a usual year. Only friends/relatives who do not live in the same household as therespondent are considered. Relatives include father/mother/children, siblings, grandparents, aunts, uncles, cousins,nephews, nieces and families-in-law. Data for Ireland, the Netherlands and Norway are uncertain, while the value forthe United Kingdom is provisional.Source: European Union Statistics on Income and Living Conditions (EU-SILC), 2006Social network supportPercentage of people who have relatives or friends they can count on, 2010Note: Data refer to 2008 for Iceland and Norway; and to 2009 for Estonia, Israel, Switzerland and South Africa.Source: Gallup World Poll; OECD (2010), OECD Factbook 2009: Economic, Environmental and Social Statistics,OECD, Paris.For further reading OECD (2011), Society at a Glance 2011: OECD Social Indicators, OECD, Paris. OECD (2001), The Well-being of Nations: the Role of Human and Social Capital, OECD, Paris. OECD and UK Office of National Statistics (2002), “Social capital: The challenge of international measurement”, ConferenceProceedings, www.oecd.org/document/24/0,3343,en 2649 39263294 2380248 1 1 1 1,00.html OECD 2011Compendium of OECD Well-Being Indicators
28WHY DO THEY MATTER FOR WELL-BEING?Participating in society, through for instance the expression of political voice, is essential to individual well-being.Political voice is not only part of basic freedoms and rights that are worthwhile to all humans, but it also enhancesthe accountability and the effectiveness of public policy. This has in turn a strong impact on well-being as publicpolicy has a strong bearing on individual lives, for instance through the public services provided, the regulationand framing of various institutions and markets, the justice system, etc. In addition to these benefits, participatinginto community life allows individuals to develop a sense of belonging and trust in others.KEY INDICATORSThe key indicators of civic engagement and governance presented here refer to voter turnout and the existenceof formal and open consultation processes on rule making.The The first indicator measures the extent of electoral participation in major national elections. Two9definitions of voter turnout are considered here : the first refer to the number of votes casted over thevoting-age population; the second to the number of votes casted over the population registered to vote.The voting-age population is generally defined as the population aged 18 or more, while the registeredpopulation refers to the population listed on the voters' register. The number of votes casted aregathered from national statistics offices and national electoral management bodies. The second indicator describes the extent to which formal consultation processes are built-in at keystages of the design of regulatory proposals, and whether mechanisms exist for the outcome of thatconsultation to influence the preparation of draft primary laws and subordinate regulations. This indicatoris a composite index aggregating various sources of information on the openness and transparency ofthe consultation process used when designing rules.Voter participation is a proxy for civic and political engagement and of how this can effectively shape thesociety where people live. Information on electoral participation should be complemented by measures ofother types of participation in society and institutional trust. The indicator of open consultation processes refersto the existence of institutional practices, but does neither gauge whether these procedures are effective norwhether they are used by citizens. Comparability of this index can also be limited by cultural, institutional andhistorical contexts. Ideally indicators of the quality of governance should measure whether public policy iseffective and transparent in achieving its goals. Broader measures of civic engagement and governance,sometimes based on specific survey modules, are available for only a few OECD countries.MEASURING AVERAGE OUTCOMES AND TRENDSPartly because of differences in electoral systems, participation varies substantially across OECD countries. Ingeneral, voter turnout is high in Nordic countries and low in Eastern European countries. Despite thesedifferences in levels, many OECD countries experienced declining levels of participation over the past threedecades, after a long increase in previous decades (OECD, 2006; López Pintor, R. and M. Gratschev, 2002).The pattern of political participation is mixed in emerging countries: Brazil and Indonesia display very high voterturn-out; conversely, India and the Russian Federation record relatively low levels of electoral participation.Most OECD countries experienced important progress in enhancing the transparency of their primary andsubordinate regulations, but large disparities across countries remain. The openness of consultation hassignificantly increased in Australia, the Czech Republic and Mexico between 2005 and 2008, while it has slightlydecreased in Finland, the Netherlands, the Slovak Republic and Switzerland. In South Africa, the only emergingcountry with available information, consultation procedures on rule-making are not widespread.WHAT DO WE KNOW ABOUT INEQUALITIES IN CIVIC ENGAGEMENT?People in the bottom quintile of the income distribution report lower rates of voting than those in the top. Votingincreases with income but this effect tappers off at the very top of the distribution. Education is also a major driverof political participation. Electoral participation increases with age, with youth voter turnout being, on average, 20percentage points lower than that of inv
Satisfaction with health also declines with people‟s age. Regardless of countries‟ political structures or health systems, people with lower income or education experience higher mortality and morbity (OECD, 2010a), due to a combination of more difficult life- and work-circumstances, le