Transcription
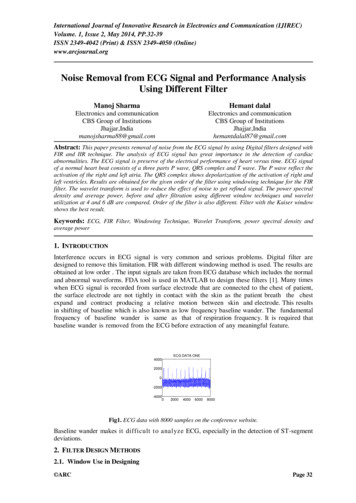
Health at a Glance 2011: OECD IndicatorsWHY IS HEALTH SPENDING IN THE UNITED STATES SO HIGH?1.Health spending in the United States is much higher than in other OECD countriesThe United States spends two-and-a-half times more than the OECD average health expenditure per person(Chart 1). It even spends twice as much as France, for example, a country which is generally accepted ashaving very good health services. At 17.4% of GDP in 2009, US health spending is half as much again asany other country, and nearly twice the average.Chart 1: Health expenditure per capita, public and private, 2009 (or nearest year)013299862United StatesNorwaySwitzerlandNetherlands ¹Luxembourg ²CanadaDenmarkAustriaGermanyFranceBelgium ³IrelandSwedenIcelandUnited KingdomAustraliaOECDFinlandItalySpainNew ZealandJapanGreeceSloveniaPortugalIsraelCzech RepublicSlovak RepublicKoreaHungaryPolandEstoniaChileRussian Fed.BrazilMexicoTurkeySouth 394187921082084250829832724216515112000Private expenditure on 39784348428948085144491443633781400053526000Public expenditure on health25797960USD PPP80001. In the Netherlands, it is not possible to clearly distinguish the public and private share related to investments.2. Health expenditure is for the insured population rather than the resident population.3. Total expenditure excluding investments.Note: Information on data for Israel: http://dx.doi.org/10.1787/888932315602.Source: OECD Health Data 2011.1
Health at a Glance 2011: OECD IndicatorsChart 2: Total health expenditure as a share of GDP, 2009 (or nearest year)% of 15.44.64.2162.440United StatesNetherlands ium ²New ZealandPortugalSwedenUnited veniaFinlandSlovak Rep.BrazilAustraliaJapanSouth AfricaChileCzech Rep.IsraelLuxembourg ³HungaryPolandEstoniaKoreaMexicoTurkeyRussian Fed.ChinaIndiaIndonesia21. In the Netherlands, it is not possible to clearly distinguish the public and private share related to investments. 2. Totalexpenditure excluding investments. 3. Health expenditure is for the insured population rather than the resident population.Note: Information on data for Israel: http://dx.doi.org/10.1787/888932315602.Source: OECD Health Data 2011.Rich countries spend more than poor countries. Chart 3 shows that for nearly every country, if you knowhow rich they are, you can predict their health spending per person per year to within a few hundreddollars. The United States is an exception – Americans spend nearly 3000 per person per year more thanSwiss people, even though Swiss people have about the same level of income.Chart 3: Total health expenditure per capita and GDP per capita, 2009 (or nearest year)Health spending per capita (USD PPP)8000USAR² 0.7170006000NORCHE5000NLDLUXDNK CANAUTDEUFRABELIRLSWE4000GBRAUSITAISLNZL ESPFINGRCJPNPRTSVNCZESVKISR30002000HUNCHL POLBRA1000KORESTRUSTURZAF MEXCHNINDIDN00150003000045000600007500090000GDP per capita (USD PPP)Source: OECD Health Data 2011.2
Health at a Glance 2011: OECD Indicators2.Where does the money go?Health expenditure can be broken down into different categories of spending by type of care, that is, inpatient care, out-patient care, pharmaceuticals, public health and administration, etc. Chart 4 shows howthe US compares to other OECD countries that spend a lot on health, including countries with a lot ofprivate insurance (Switzerland, France and Germany).Chart 4: Health spending per capita by category of care, US and selected OECD countries, 2009USD PPP 8,000 7,000Other 7,598(189%)Public health & administration 803Pharmaceuticals and medical goods(274%)Ambulatory (Physicians, specialists, dentists, etc.)Hospitals/Nursing homes 1,070 6,000(152%) 5,144 5,000 339 463 4,000 2,803 4,139 4,072(238%) 434 271 298 860 887 842 1,171 1,254 1,062 1,626 3,000 2,000 2,832 121 466 787 2,922 1,000 3,872(163%) 2,716 1,643 1,518 1,639 1,458CanadaGermanyFranceJapan (2008) UNITED STATESSwitzerlandNote: Health spending excludes investments. The percentages in the US bar indicate how much more the US spends per category compared withthe average of the five other OECD countries.Source: OECD Health Data 2011. Hospital spending is higher than in the five other OECD countries, by over 60%.Spending on Ambulatory care providers – that is, physicians and specialists as well as dentists, is muchhigher than in the other OECD countries – almost two-and-a-half times the average of the other fivecountries. One of the explanations for this is the growth of same-day surgery in the US. Such servicesare an important innovation in health care delivery, often being preferred, when possible, by patients tostaying overnight in a hospital. Estimates of spending on same-day surgery performed by independentphysicians for 2003 and 2006 suggest that this has been the fastest growing area of health care overthis period (Mckinsey Global Institute, 2008).Spending on Pharmaceuticals and medical goods is higher in the US than in any other country, butoverall accounts for a smaller share of total health spending than in the other countries.Spending on Public Health and Administration is particularly high – more than two-and-a-half timesthe average. Administration of the US health system alone accounts for about 7% share of totalspending. This is on a par with other systems such as France and Germany which also have multipayersystems (even if in some of them there is no or little competition across payers). In comparison,Canada and Japan devote around 4% of health spending on administration.3
Health at a Glance 2011: OECD IndicatorsLeaving aside spending on administration, the high level of spending in the United States may be due to: The cost (or price) of health care being higher in the United States than elsewhereThe United States providing more health care – more doctors’ appointments, more surgery, moredrugs, more diagnostic tests, longer stays in hospital – than in other countriesSome combination of the two.Evidence suggests that prices are high (see next section) and some (but not all) quantities of servicesprovided are high.3.Are US health prices high?A 2010 OECD study (Koechlin et al., 2010) found the US price level of hospital services to be over 60%higher than the average of 12 other OECD countries in 2007.1Looking at specific interventions, Table 1 shows that the price of a normal delivery in the United Stateswas estimated to be more than 50% higher than in France or Canada, while the price of a caesarean sectionwas 30% higher than in France and more than 50% higher than in Canada. The price of a kneereplacement was about 20% higher in the United States than in France and 50% higher than in Canada,while a hip replacement costed 45% more in the United States than in these two countries.Table 1: Average unit quasi-prices of certain hospital procedures, in US dollars, US and selectedOECD countries, 2007ProceduresAppendectomyNormal deliveryCaesarean sectionPercutaneaous transluminalcoronary angioplasty (PTCA)Coronary artery bypass graftHip replacementKnee replacementSource: Koechlin et al. (2010).AUS5 0442 9847 092CAN5 0042 8004 820DEU2 9431 7893 732FIN3 7391 5214 808FRA4 5582 8945 820SWE4 9612 5916 375USA7 9624 4517 4497 1319 2773 3475 5747 0279 29614 37821 69815 91814 60822 69411 9839 91014 0678 89910 01123 46810 8349 93123 12611 16212 42421 21811 56810 34834 35817 40614 946Pharmaceutical prices are also higher in the United States than in other OECD countries. A recent study ofthe 50 top-selling prescription drugs found that US pharmaceutical prices were at least 60% higher thanthose in five large European countries in 2007.2Overall, the evidence suggests that prices for health services and goods are substantially higher in theUnited States than elsewhere. This is an important cause of higher health spending in the United States.1Koechlin, F., L. Lorenzoni and P. Schreyer (2010), Comparing Price Levels of Hospital Services across Countries:Results of a Pilot Study, OECD Health Working Paper, No. 53, OECD Publishing, Paris.2Kanavos, P. and S. Vandoros (2011), Drugs US: are prices too high?, Significance, The Royal Statistical Society,March 2011, pp.15-18.4
Health at a Glance 2011: OECD Indicators4.Does the US provide too much health care?More health care is not always better health care – sometimes treatments are provided which areunnecessary, or even undesirable. There are enormous differences in how much health care differenthealth systems supply. However, it is very difficult to say whether a country does too much, or too little.But what can be done is to indicate whether the United States does more or less than other countries.Table 2 shows where it does less. It does not have many physicians relative to its population; it does nothave a lot of doctor consultations; it does not have a lot of hospital beds, or hospitals stays, when comparedwith other countries, and when people go to hospital, they do not stay for long. All these data on healthcare activities suggest that US health spending should be low compared with other countries.Table 2. Where the United States health system does LESS than other countriesUnited StatesRank compared withOECD countries26th29th29th26th29thPractising physicians2.4 per 1 000 populationDoctor consultations3.9 per capitaHospital beds3.1 per 1 000 populationHospital discharges130.9 per 1 000 populationAverage length of stay in 4.9 dayshospitalsSource: OECD Health Data 2011.OECD average3.1 per 1 000 population6.5 per capita4.9 per 1 000 population158.1 per 1 000 population7.2 daysOn the other hand, the US health system does do a lot of interventions. Table 3 shows that it has a lot ofexpensive diagnostic equipment, which it uses a lot. And it does a lot of elective surgery – the sort ofactivities where it is not always clearcut about whether a particular intervention is necessary or not.Table 3. Where the United States health system does MORE than other countriesUnited StatesMRI units25.9 per million populationMRI exams91.2 per 1 000 populationCT scanners34.3 per million populationCT exams227.9 per 1 000 populationTonsillectomy254.4 per 100 000 populationCoronary angioplasty377.2 per 100 000 populationKnee replacements212.5 per 100 000 populationCaesarean sections32.3 per 100 live birthsSource: OECD Health Data 2011.Rank compared withOECD countries2nd2nd5th2nd2nd3rd1st8thOECD average12.2 per million population46.6 per 1 000 population22.8 per million population131.8 per 1 000 population133.8 per 100 000 population187.6 per 100 000 population118.4 per 100 000 population25.8 per 100 live birthsHence overall the picture about whether the US spends more than other countries because its system doesmore than other countries is mixed. It does more of some activities, but less of others. Overall, it seemsthat high prices are probably a more important cause of high spending than high provision of services.5
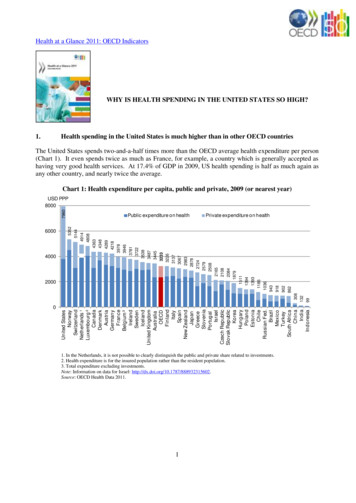
Health at a Glance 2011: OECD IndicatorsBox: Is the quality of US health care better than in other countries?Life expectancy in the United States is below the OECD average (78.2; average is 79.5), despite the high level of health spending.The United States is also below average on other measures, including infant mortality and potential years of life lost. However,these ‘aggregate’ measures are not good measures of the effects of health spending on outcomes, as many other factors beyondhealth care affect mortality.Health at a Glance 2011 presents a set of indicators related more specifically to the quality of health care. The United Statesperforms well in some subsystems such as cancer care and treating acute conditions in hospitals, but does not perform well inprimary care and in preventing costly hospital admissions for chronic conditions. Cancer care system is generally performing very well. This is particularly true for breast cancer with highscreening coverage and survival, and also for colorectal cancer (Charts 5 and 6). On the other hand, cervical cancersurvival is still low compared with many other OECD countries, despite the high screening coverage. The quality of acute care in hospitals is generally good in the United States, compared with other OECDcountries. In-hospital case fatality for AMI and ischemic stroke is lower than the OECD average. However, the primary care sector is still underdeveloped, adding financial burden to the health system. Costlyhospital admissions have been high particularly for asthma and chronic obstructive pulmonary disease (COPD),even though such admissions could potentially be avoided if appropriate care is provided in primary care settings(Charts 7 and 8). The shortage of family doctors contributes to the poor primary care performance.Chart 5: Breast cancer, five-year relative survival rateUnited States (2003-08)Chart 6: Colorectal cancer, five-year relative survival rateJapan (2000-05)89.3Japan (2000-05)United States (2003-08)87.3Canada (2002-07)68.086.664.5Canada (2002-07)63.4OECD (16 countries)83.5Germany (2003-08)60.4Germany (2003-08)83.3OECD (16 countries)59.9France (1997-2002)82.8France (1997-2002)United Kingdom (2004-09)81.36057.0United Kingdom (2004-09)708090100Age-standardised rates (%)53.34050607080Age-standardised rates (%)Chart 7: Asthma hospital admission rates,population aged 15 and overChart 8: COPD hospital admission rates,population aged 15 and overCanada (2009)France (2007)15.7Italy (2009)19.2Italy (2009)Germany (2009)20.8Canada (2009)France (2007)OECD (28 countries)United Kingdom (2009)United States (2008)43.451.873.7183198Germany (2009)201United States (2008)050100150Age-sex standardised rates per 100 000 population126OECD (28 countries)United Kingdom (2009)120.6792132300100200300Age-sex standardised rates per 100 000 populationNote: 95% confidence intervals are represented by H.Source: OECD Health Data 2011.6
Source: OECD Health Data 2011. Hospital spending is higher than in the five other OECD countries, by over 60%. Spending on Ambulatory care providers - that is, physicians and specialists as well as dentists, is much higher than in the other OECD countries - almost two-and-a-half times the average of the other five countries.