Transcription
www.vtpi.orgInfo@vtpi.org250-360-1560Evaluating Public Transportation Health Benefits27 February 2015Todd LitmanVictoria Transport Policy InstituteForThe American Public Transportation AssociationAbstractThis report investigates ways that public transportation affects human health, and ways toincorporate these impacts into transport policy and planning decisions. This research indicatesthat public transit improvements and more transit oriented development can provide large butoften overlooked health benefits. People who live or work in communities with high quality publictransport tend to drive significantly less and rely more on alternative modes (walking, cyclingand public transit) than they would in more automobile-oriented areas. This reduces trafficcrashes and pollution emissions, increases physical fitness and mental health, and providesaccess to medical care and healthy food. These impacts are significant in magnitude comparedwith other planning objectives, but are often overlooked or undervalued in conventionaltransport planning. Various methods can be used to quantify and monetize (measure inmonetary units) these impacts. This analysis indicates that improving public transit can be oneof the most cost effective ways to achieve public health objectives, and public healthimprovements are among the largest benefits provided by high quality public transit and transitoriented development.Todd Litman 2010-2015You are welcome and encouraged to copy, distribute, share and excerpt this document and its ideas, provided the author isgiven attribution. Please send your corrections, comments and suggestions for improvement.
Evaluating Public Transportation Health BenefitsVictoria Transport Policy InstituteSummary of Findings High quality public transportation (convenient, comfortable, fast rail and bus transport) andtransit oriented development (walkable, mixed-use communities located around transit stations)tend to affect travel activity in ways that provide large health benefits, including reduced trafficcrashes and pollution emissions, increased physical fitness, improved mental health, improvedbasic access to medical care and healthy food and increased affordability which reducesfinancial stress to lower-income households. Traffic casualty rates tend to decline as public transit travel increases in an area. Residents oftransit-oriented communities have only about a quarter the per capita traffic fatality rate asresidents of sprawled, automobile-dependent communities. Public transit reduces pollution emissions per passenger-mile, and transit-oriented developmentprovides additional emission reductions by reducing per capita vehicle travel. U.S. Center for Disease Control recommends that adults average at least 22 daily minutes ofmoderate physical activity, such as brisk walking, to stay fit and healthy. Although less than halfof American adults achieve this target, most public transportation passengers do exercise therecommended amount while walking to and from transit stations and stops. Neighborhood design features that support transit, such as walkability and mixed land use, alsosupport public health. Of people with safe places to walk within ten minutes of home, 43%achieve physical activity targets, compared with just 27% of less walkable area residents. The United States has relatively poor health outcomes and high healthcare costs compared withpeers, due in part to high per capita traffic fatality rates and diseases resulting from sedentaryliving. Public transit improvements can improve health outcomes and reduce healthcare costs. Inadequate physical activity contributes to numerous health problems, causing an estimated200,000 annual deaths in the U.S., and significantly increasing medical costs. Among physicallyable adults, average annual medical expenditures are 32% lower for those who achieve physicalactivity targets ( 1,019 per year) than for those who are sedentary ( 1,349 per year). Many physically and economically disadvantaged people depend on public transportation toaccess to medical services and obtain healthy, affordable food. Current demographic and economic trends (aging population, rising fuel prices, increasinghealth and environmental concerns, and rising medical care costs) are increasing the value ofpublic transportation health benefits. A growing portion of households would prefer to drive less and rely more on walking, cyclingand public transit, provided these alternatives are convenient, comfortable, safe and affordable. Conventional planning tends to overlook and undervalue many transportation-related healthimpacts. More comprehensive evaluation can better integrate transportation and public healthplanning objectives. When all impacts are considered, improving public transit can be one of the most cost effectiveways to achieve public health objectives, and public health improvements are among the largestbenefits provided by high quality public transit and transit-oriented development.1
Evaluating Public Transportation Health BenefitsVictoria Transport Policy InstituteIntroduction – “Live Long and Prosper”Current health trends offer both good and bad news. The good news is that many simple,affordable, and often enjoyable lifestyle habits can lead to healthier and happier lives: breathfresh air, avoid dangerous driving, maintain healthy weight, be physically active, eat fresh fruitsand vegetables, maintain friendships, and avoid excessive stress. Even chocolate is consideredhealthy if consumed in moderation!But there is also bad news. Many people find it difficult to maintain healthy habits. As a result,the U.S. has relatively poor health outcomes compared with peer countries, and according tosome projections average U.S. lifespans may actually decline in the future due to growing butavoidable health risks.Major Avoidable Health Risks Unhealthy eatingOverweight and obesitySedentary livingPollution exposure Tobacco consumptionExcessive alcohol consumptionDrug abuseTraffic crashes Social isolationStress and depressionSuicideHomicideTransportation and land use planning decisions affect many of these health risks. A growingbody of research indicates that the quality of public transportation (also called public transit,urban transport and rapid transit) in a community affects public health in many ways, includingsome impacts that are often overlooked or undervalued. This report investigates these impactsand ways to better incorporate them into transportation planning. This analysis can help transportand health professionals better coordinate their efforts to create communities where people canlive long and prosper (CDC 2010).2
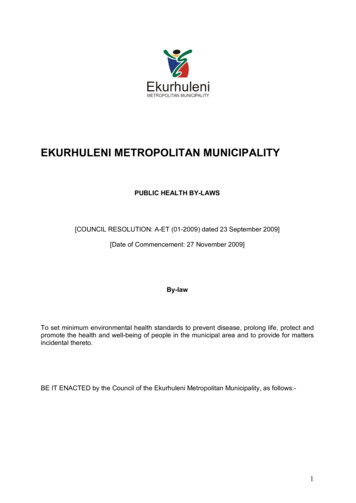
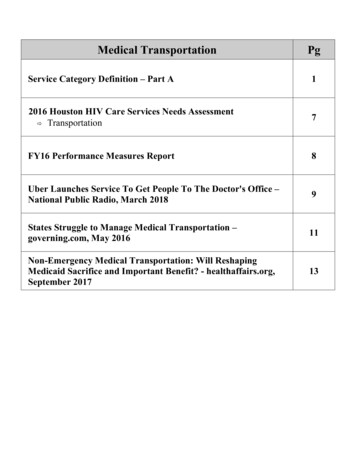
Evaluating Public Transportation Health BenefitsVictoria Transport Policy InstituteTravel ImpactsThe quality of public transit, and the degree it is integrated into a community, significantlyaffects travel activity. As service quality improves and communities become more transitoriented, residents tend to own fewer vehicles, drive less and rely more on alternative modes(walking, cycling and public transit) than they otherwise would (ICF 2008; Litman 2007).Table 1Impacts on Vehicle Ownership and Travel (Ohland and Poticha 2006)Land Use TypeGood transit/Mixed useGood transit onlyRemainder of regionAuto OwnershipDaily VMTPer HouseholdPer CapitaAutoTransitMode 5%1.1%4.0%Residents of transit-oriented neighborhoods tend to own significantly fewer motor vehicles, drive significantlyless, and rely more on walking and public transit than residents of other neighborhoods.Table 1 and Figure 1 illustrate this pattern in Portland, Oregon, although similar effects occur inother cities. Residents of communities with high-quality, well integrated public transit (calledtransit-oriented development or TOD), own half as many vehicles, drive half as many annualmiles, walk and bicycle four times more, and use public transit ten times more than residents ofmore automobile-dependent communities. These differences partly reflect self selection, thetendency of people who by necessity or preference rely on alternative modes to locate in transitoriented areas, but that is generally a minor effect (Cervero 2007). A typical household that shiftsfrom an automobile-dependent to a transit-oriented community drives significantly less andrelies much more on alternative modes. Even residents who commute by automobile tend toreduce their annual vehicle mileage by shifting mode and reducing the distances of other trips(errands, recreation, children’s travel to school, etc.) due to more accessible land use.Figure 1TOD Impacts On Mode Split in Portland, Oregon (Ohland and Poticha 2006)People who live in transit-oriented communities tend to own fewer vehicles, drive less and rely more onalternative modes. “Daily VMT” indicates average daily vehicle miles traveled per capita.3
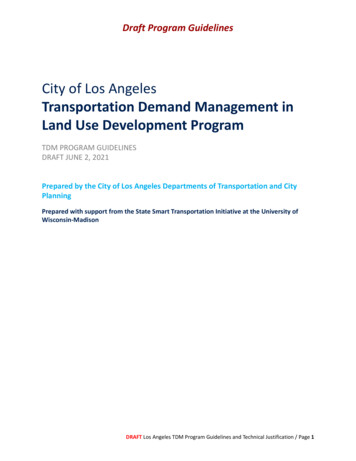
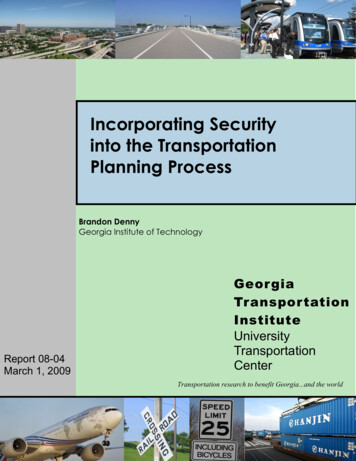
Evaluating Public Transportation Health BenefitsVictoria Transport Policy InstituteA New York City Department of Health study evaluated the health benefits of activetransportation. The results, summarized in Figure 2, indicate that people who commute bywalking, cycling or public transit achieve about twice the total (transportation and recreational)exercise as automobile commuters, and so are much more likely to achieve public health targetsof thirty or more daily minutes of moderate physical activity. This study can be a model for usein other communities interested in tracking physical fitness and health.Figure 2Recreation And Transportation Exercise By Commute Mode (NYCDH 2011)Average Daily Minutes9080RecreationActive Transport706050403020100Walk/BikePublic TransportPersonal Car/TaxiAlthough the amount of time people spend in recreational physical activity (sports and health clubexercise) is similar for all commute groups, those who commute by walking, cycling and public transithave much more active transportation and so are much more likely to achieve the public health target ofat least thirty daily minutes of physical activity. Although this study was performed in New York, theresults are similar to those found in other cities.4
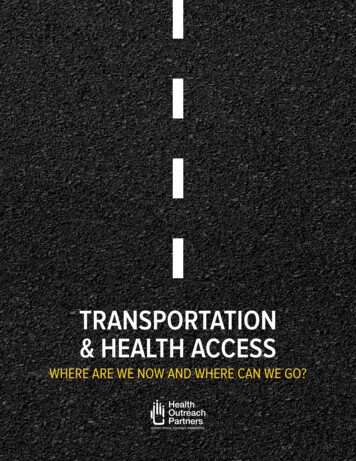
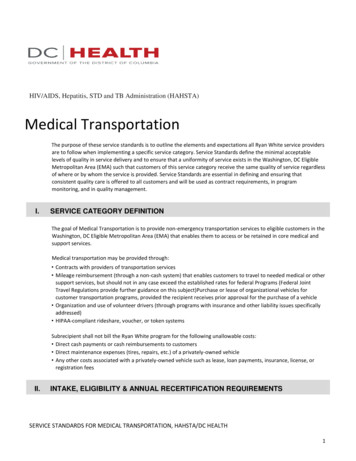
Evaluating Public Transportation Health BenefitsVictoria Transport Policy InstituteTransportation Health ImpactsThis section evaluates the degree to which transportation affects public health risks.Travel activity affects public health in several ways. Figure 3 indicates ways that travel activityaffects the ten leading causes of Potential Years of Life Lost (PYLL, which takes into account ageof death and therefore reflects the greater costs to society of risks to younger people). Forexample, pollution contributes to cancer and congenital anomalies (birth defects), and sedentaryliving (inadequate physical activity) contributes to heart disease and strokes. Transport activityaffects five of these health risks, including the three largest, which cause more than 60% of totalpotential years of life lost.Figure 3Ten Leading Causes of Potential Years of Life Lost (NCIPC 2009)CancerHeart DiseaseOther AccidentsMotor Vehicle CrashesPerinatal PeriodSuicideHomicideNot Transport RelatedCrashesPollution ExposureSedentary LivingCongenital AnomaliesHIVStrokesLiver Disease0500,0001,000,0001,500,000Potentia l Years of Life Lost2,000,000Transportation affects many major health risks. Potential Years of Life Lost (PYLL) takes into accountthe age at which people die and so gives greater weight to risks to younger people.Of course, these relationships are complex. There are often several steps between a planningdecision and its ultimate health impacts. Transportation activities are only a minor contributor tosome of these risks. For example, motor vehicles are only one source of pollution, and pollutionis only one contributor to cancer and congenital anomalies, while sedentary living increasessome forms of cancer, which are not reflected in this figure.Compared with its peers the United States has higher healthcare costs and poor health outcomes.In 2007 the U.S. had a 78.1 year life expectancy, almost one year below the OECD average of79.0 years, and spent 7,290 per capita on healthcare, almost two-and-a-half times greater thanthe OECD average (OECD 2009). Transportation-related health risks are major contributors tothese poor health outcomes and high healthcare costs, and public transportation health benefitscan help reduce these discrepancies as described in the next section.5
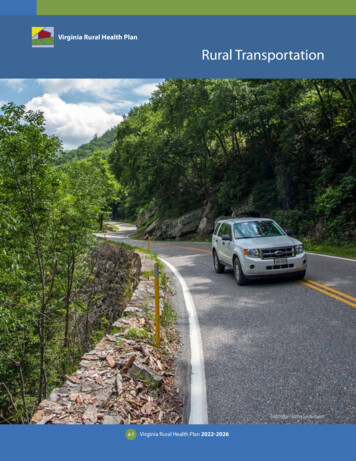
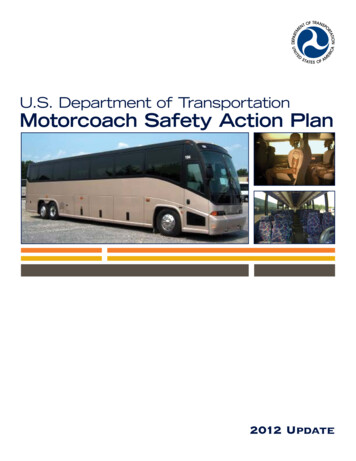
Evaluating Public Transportation Health BenefitsVictoria Transport Policy InstitutePublic Transportation Health BenefitsThis section discusses the relationships between public transportation and specific health risks.Traffic CrashesTraffic crashes kill about 40,000 people annually on U.S. roads, and cause many more injuriesand disabilities (BTS 2008). Crash casualties have lower average ages than victims of othermajor health risks, such as cancers and cardiovascular diseases, and so cause a relatively largenumbers of years of life lost. According to the National Center for Injury Prevention andControl, traffic crashes caused an estimated 1,186,070 years of life lost in the U.S. in 2006,which reduces average lifespans approximately 0.4 years or about 5% (NCIPC 2009).Crashes can be measured in different ways which result in different conclusions about the risk ofdifferent modes and activities (Litman and Fitzroy 2006). Distance-based units, such as fatalitiesper 100 million vehicle-miles, ignore the additional risk that results from increased vehiclemileage and the safety benefits of travel reductions. Figure 4 shows U.S. traffic fatality ratesmeasured per 100 million vehicle-miles and per 10,000 residents between 1960 and 2005. Themileage-based fatality rate declined by more than two thirds during this period, which impliesthat existing safety programs were effective. However, this was offset by increased mileage.When measured per capita, as with other health risks, there was little improvement despitesignificant increases in use of safety devices (seatbelts, helmets, airbags, etc.), reductions inintoxicated driving, improved road and vehicle design, faster emergency response, and improvedmedical care. Taking these factors into account, much greater casualty reductions should haveoccurred. For example, seatbelt use grew from virtually zero in 1960 to about 75% in 2000,which alone should have reduced traffic fatalities 33% (seat belt use reduces crash fatality ratesabout 45%), yet, per capita traffic deaths declined just 25% during this period.Figure 4U.S. Traffic Fatalities (BTS 2008)6 .0Fatalities Per 100 Million VehicleMilesFatalities Per 10,000 Population5 .04 .03 .02 .01 .00 .01960 19651970 1975 198 0 1985 1990 199 5 2000 2003 2 005When measured per vehicle-mile, traffic fatalities declined significantly, but when measured per capitathey show relatively little decline due to increased per capita vehicle mileage.6
Evaluating Public Transportation Health BenefitsVictoria Transport Policy InstituteFigure 5International Traffic Fatalities (Wikipedia 2009; based on WHO and OECD data)USANew ZealandIrelandCanadaFranceAustralia100,000 Pop.FinlandBillion Vehicle-KmsGermanyIsraelJapanGreat BritainDenmarkNorw aySw itzerlandSw edenNetherlands0246810121416Traffic FatalitiesThe US has the highest per capita traffic fatality rate among peer countries.Traffic crashes continue to be one of the largest causes of deaths and disabilities for people aged1-44 years (CDC 2003). The U.S. has the highest per capita traffic fatality rates among peercountries, as illustrated in Figure 5, despite high quality highways and vehicles, and wellestablished safety programs. This can be explained by high per capita vehicle mileage, asillustrated in Figure 6. From this perspective, traffic crashes continue to be a major health riskand new strategies may be justified to achieve safety targets.Figure 6Traffic Fatalities Versus Annual Vehicle Mileage (OECD ndsNorwaySwedenSwitzerlandUnited KingdomUnited StatesTraffic Fatalities Per 100,000 Pop.161412108642R2 0.6405005,00010,00015,00020,00025,000Annual Vehicle Kilometers Per CapitaPer capita traffic fatality rates tend to increase with per capita annual vehicle mileage.7
Evaluating Public Transportation Health BenefitsVictoria Transport Policy InstitutePublic transit is a relatively safe mode, with only about one-twentieth the passenger fatality rateas automobile travel (Beck, Dellinger and O'Neil 2007). Even considering risks to other roadusers, transit travel tends to have a lower fatality rate per passenger-mile than automobile travelunder the same conditions.Transit-oriented development tends to provide particularly large safety benefits. People who liveor work in transit oriented communities tend to drive fewer annual miles, drive at lower speeds,and have better travel options that allow them to avoid high risk driving, such as after drinkingalcohol or when ill. Although crash rates tend to increase with urban densities due to morefrequent interactions among vehicles, crash severity and casualty rates (injuries and deaths) arehigher in lower density areas due to higher speeds and slower emergency response. In otherwords, urban residents tend to have many minor crashes, while suburban and rural residents havefewer but more severe crashes, resulting in higher per capita disability and fatality rates. Sincetransit ridership tends to increase with urban density, transit is associated with higher crash rates(mostly minor collision that damage property but cause no injuries) but lower casualty rates(serious injuries and deaths). As a result, total per capita traffic fatalities (including transit andautomobile occupants, and pedestrians) decline significantly as transit ridership increases in acommunity, as indicated in Figure 7.Figure 7Traffic Fatalities Versus Transit Travel in U.S. Urban Regions (Litman andFitzroy 2006)Traffic Fatalities Per 100,000Population252015105R2 0.325002004006008001,0001,200Annual Per Capita Transit Passenger-MilesPer capita traffic deaths tend to decline as public transportation ridership increases. Each dot representsa U.S. urban region.8
Evaluating Public Transportation Health BenefitsVictoria Transport Policy InstituteInternational data also indicate that per capita traffic fatality rates decline as per capita transitridership increases, as illustrated in Figure 8.Figure 8Traffic Fatalities Versus Transit Travel International Cities (Kenworthy andLaube 2000)Traffic Fatalities Per 100,000Population25Northern EuropeSouthern EuropeUSCanadaAustralia2015105R2 0.3467001,0002,0003,0004,000Annual Per Capita Transit Passenger-MilesInternational data indicate that crash rates decline with increased transit ridership. Each dot representsa major international city.Similarly, smart growth communities, where residents tend to drive less and rely more onalternative modes, have lower traffic fatality rates than more automobile-dependentcommunities. Ewing, Schieber and Zegeer (2003) rated 240 U.S. counties according to a sprawlindex that considered land use density, mix and transport diversity factors. The ten smartestgrowth counties had about a quarter the per capita traffic fatality rate as the ten most sprawledcounties, as illustrated in Figure 9. Overall, urban residents have significantly lower violent deathrates, considering both accident and homicide risks (Lucy 2002).Increased walking, cycling and public transit travel tends to increase overall security and reducecrime rates by providing more monitoring of city streets and transit waiting areas (Hillier andSahbaz 2006). Actual and perceived security risks can be reduced by targeted efforts such ascommunity policing and Neighborhood Watch programs, special police patrols, pedestrianescorts, monitoring of transit vehicles and waiting areas, and other strategies for crimeprevention through environmental design (Zelinka and Brennan 2000).9
Evaluating Public Transportation Health BenefitsVictoria Transport Policy InstituteFigure 9U.S. County Traffic Fatality Rates (Ewing, Schieber and Zegeer 2003)Bronx, NYNew York, NYKings, NYSuffolk, MAQueens, NYRichmond, NYHudson, NJSan Francisco, CABaltimore City, MDPhiladelphia, PAIsanti Co, MNStokes, NCClinton, MIWalton, GAGeauga, OHDavie, NCGoochland, VAFulton, OHYadkin, NCMiami, KSSmart GrowthMost Sprawled0510152025303540Traffic Fatalities Per 100,000 ResidentsThe ten smartest growth counties have about a quarter the traffic fatality rates as the most sprawled.Most transit trips include walking or cycling links so the safety of these modes affects the overallsafety of public transit travel. Walking and cycling have relatively high per mile casualty rates,but shifting travel from driving to nonmotorized modes generally imposes little incremental riskbecause (WHO 2008; Litman 2008):1. Nonmotorized travel imposes minimal risk to other road users.2. Road users tend to be more cautious where they expect to encounter walkers and cyclists. As aresult, per-mile casualty rates tend to decline as walking and cycling activity increases in acommunity, called the “safety in numbers” effect.3. Increased walking and cycling may spur communities to implement nonmotorized safetyimprovements, such as adding sidewalks, crosswalks and speed control programs.4. Nonmotorized trips tend to be shorter than motorized trips. A local walking trip often substitutesfor a longer automobile trip, and residents of transit-oriented development tend to travel less intotal due to improved land use accessibility.5. High walking and cycling casualty rates partly reflect special risk factors by some user groups,such as children and people with disabilities. A responsible adult who takes basic precautionssuch as observing traffic rules and wearing a helmet tends to have less than average risk.6. Increased walking and cycling provides health and fitness benefits that are many times greaterthan incremental crash risks.This indicates that improving public transit and creating more transit-oriented communities canincrease overall safety and security, particularly if implemented with pedestrian and cyclingsafety programs.10
Evaluating Public Transportation Health BenefitsVictoria Transport Policy InstitutePollution EmissionsA second category of transport-related health impacts involve vehicle pollution emissions. Theseinclude tailpipe emissions, plus “upstream emissions” (from fuel production and distribution),hot soak (evaporative emissions that occur after an engine is turned off), and particulates fromroad dust, brake linings and tire wear (“Air Pollution,” Litman 2008).Many factors affect vehicle pollutant human health impacts, including per capita vehiclemileage, vehicle emission rates, and exposure (the number of people located where emissions areconcentrated). Motor vehicle air pollution is estimated to cause a similar number of prematuredeaths as traffic crashes, although air pollution victims tend to be older and so cause smallerreductions in Potential Years of Life Lost than traffic crashes (Murray, et al. 1996).Public transit tends to produce less pollution per passenger-mile, particularly electric-poweredand newer diesel vehicles, and as previously described, transit oriented development tends toreduce per capita vehicle travel and associated emissions (ICF 2008). Older diesel buses tend tohave high emission rates and bus transit tends to concentrate activity close to roadways, so undersome circumstances increased transit use may increase human exposure to some pollutants suchas particulates and carbon monoxide. However, newer and alternative fuel buses produce far lessemissions (Figure 10). Use of less polluting alternative fuels (such as natural gas) increased fromjust 2.0% in 1992 to 30.4% by 2009, and electric modes (electric trolley buses and electric railtransit) increased from 29% to 34% of passenger-miles during the same period.Grams Per Brake-Horsepower-HourFigure 10Federal Transit Bus Emissions Standards (USDOT 2006, Table 1994-1995 1996-1997 1998-20042004-2007 2007-2010Diesel bus emission rates are declining significantly due to newer technologies and standards.11
Evaluating Public Transportation Health BenefitsVictoria Transport Policy InstitutePhysical Activity and FitnessA third category of health impacts concerns the effects transport has on physical activity andfitness (WHO 2003). In recent years, public health officials have become increasingly alarmed atdeclining physical fitness and resulting increases in diseases associated with sedentary lifestyles(Franco, et al. 2005). Inadequate physical activity, and resulting excessive body weight,contribute to heart and vascular diseases, strokes, diabetes, hypertensive diseases, osteoporosis,joint and back problems, colon and breast cancers, and depression. Even modest reductions inthese illnesses can provide large savings and benefits.The U.S. Center for Disease Control recommends at least 150 weekly minutes (about 22 dailyminutes) of moderate aerobic activity (e.g. brisk walking) for adults, as indicated in Table 2.Table 2How Much Physical Activity Do Adults Need? (CDC 2008)Aerobic Activity2 hours and 30 minutes (150 minutes) of moderateintensity aerobic activity (i.e., brisk walking) everyweek.Muscle-StrengtheningMuscle-strengthening activities on 2 or more days a weekthat work all major muscle groups (legs, hips, back,abdomen, chest, shoulders, and arms).Or1 hour and 15 minutes (75 minutes) of vigorousintensity aerobic activity (i.e., jogging or running) everyweek.Muscle-strengthening activities on 2 or more days a weekthat work all major muscle groups (legs, hips, back,abdomen, chest, shoulders, and arms).OrAn equivalent mix of moderate- and vigorous-intensityaerobic activity.Muscle-strengthening activities on 2 or more days a weekthat work all major muscle groups (legs, hips, back,abdomen, chest, shoulders, and arms).10 minutes at a time is fine - 150 weekly minutes may sound like a lot of time, but you needn’t do it all at once. Notonly is it best to spread your activity out during the week, but you can break it up into smaller chunks of time duringthe day, as long as you’re doing your activity at a moderate or vigorous effort for at least 10 minutes at a time.This table summarizes the U.S. Center for Disease Control’s recommendations for adult physical activity.The World Health Organization (WHO 2000) states that regular physical activity can provide: 50% reduction in the risk of developing coronary heart disease (similar to not smoking).50% reduction in the risk of developing adult diabetes.50% reduction in the risk of becoming obese.30% reduction in the risk of developing hypertension.10/8-mmHg decline in blood pressure in people with hypertension (a similar effect to drugs).Reduced osteoporosis and falls in the elderly.Relief of symptoms of depression and anxiety.12
Evaluating Public Transportation Health BenefitsVictoria Transport Policy InstituteCurrently, less than half of American adults achieve recommended physical activity targets, andparticipation declines with age, as illustrated in Figure 11. This indicates the importance offinding practical ways to increase physical activity, particularly for currently sedentary,overweight and older people. Although there are many ways to exercise, some, such as organizedsports and gym exercise, require special time, skill and expense, which discourages participation.Many experts believe that increasing walking and cycling (together called active transportation)is the most practical way to improve public fitness, particularly for vulnerable populations suchas children, seniors and low income people who often have difficulty participating in structuredexercise programs due to financial and time constraints (WHO 2003; Gilbert and O’Brien 2005).Portion of Total PopulationFigure 11U.S. Physical Activity Statistics (CDC 2007)Recommended70%Insufficient60%Recommended: 150 weekly minutesof moderate intensity physical activity.Inactive50%Insufficient: 10 weekly minutes ofmoderate intensity physical activity.40%30%Inactive: less than 10 weekly minutes ofmoderate intensity activity.20%10%0%18–2425–3435–4445–6465 Age RangeLess than half of U.S. adults achieve recommended physicalactivity targets, and rates decline with age.Public transport and transit-oriented development tend to increase physical activity, since mostpublic transit trips involve walking links, transit-oriented development includes walking andcycling improvements, and transit systems often provide amenities such as bikeracks on busesand lockers at stations. Several targeted studies indicate that public transit travel significantlyincreases physical activity. Research also suggests that obesity rates tend to be inversely relatedto use of alternative modes (walking, cycling and public transit), as indicated in Figure 12.Figure 12Mode Split Versus National Obesity Rates (Bassett, et al 2008)Walk60%BikeTransit40%Obesity vialand0%This and other data indicate that obesity rates are inversely related to use of alternative modes.13
Evaluating Public Transportation Health BenefitsVictoria Transport Policy InstituteAlthough overall North Americans only walk about 6 daily minutes on average, public transitusers spend a median of 19 daily minutes walking, which nearly achieves the target of 22 dailyminutes of moderate physical activity (Besser and Dannenberg 2005; Weinstein and Schimek2005). Using pedometers and surveys to track walking activity, Wener and Evans (2007) foundthat train commuters averaged 30% more walking, more frequently reported walking for 10minutes or more, and were 4 times more likely to achieve the 10,000 daily
Compared with its peers the United States has higher healthcare costs and poor health outcomes. In 2007 the U.S. had a 78.1 year life expectancy, almost one year below the OECD average of the OECD average (OECD 2009). Transportation-related health risks are major contributors to