Transcription
THIS REPORT CONTAINS ASSESSMENTS OF COMMODITY AND TRADE ISSUES MADE BYUSDA STAFF AND NOT NECESSARILY STATEMENTS OF OFFICIAL U.S. GOVERNMENTPOLICYRequired Report - public distributionDate: 8/15/2018GAIN Report Number: CA18050CanadaPoultry and Products Annual2018Approved By:Evan Mangino, Agricultural AttachéPrepared By:Mihai Lupescu, Senior Agricultural SpecialistReport Highlights:FAS/Canada projects record high Canadian broiler meat production in 2019, as solid Canadian demandsustains continued expansion in the ‘supply managed’ chicken sector. Forecasted strong 2018production should push the 2019 Canadian import tariff rate quota to an estimated record-high 95,000metric tons, the majority of which should continue to be supplied by the United States.Keywords: Canada, CA18050, Poultry, ChickenCommodities: Meat, Chicken
Note Regarding Reporting Change:This report provides chicken meat estimates and forecasts for 2017-2019. The prior broiler meat serieshas been discontinued and will not be revised or updated in the future.Official USDA data will be available via the PSD database (http://www.fas.usda.gov/psdonline) onOctober 11, 2018. The October data release will include a historical chicken meat series back to 1999.The broiler meat series will terminate with 2016 data.Chicken meat is defined as meat of domestic fowl (Gallus gallus/Gallus domesticus) including allchickens: broiler, layer, hybrid, domestic breeds, spent hens, ex-breeding stock, etc.Executive Summary FAS/Canada forecasts continued sustained growth for 2019, with chicken meat productionestimated to reach 1.33 million metric tons (MMT), or nearly 3 percent above the estimated 2018level. Retail and food service demand for chicken meat remains solid. FAS/Canada estimates 2018 chicken meat production at 1.295 MMT, reflecting stronger thanexpected growth as the industry responded to sustained strong demand from a consumerpopulation that is increasingly diverse, economically strong and seeking comparative costsavings relative to other proteins. 2018 chicken meat sector growth is expected to reach nearly 5percent, a level not seen since the 1990s. Canadian chicken meat imports are regulated under a tariff rate quota (TRQ) that is calculated asa function of Canadian chicken meat production in the preceding calendar year. The importedchicken meat TRQ is projected to reach 90,000 MT in 2018 and 95,000 MT in 2019, both recordhighs. In addition to TRQ imports, Canadian poultry processing and further-processing companies areexpected to import 76,000 MT of chicken meat in 2018 under Canada’s two import for re-exportprograms. Nearly all of the finished products produced under the auspices of these programswill be exported to the United States.
CHICKEN MEATNOTE: "NEW Post" data reflects Post's assessments and are NOT official USDA data.201720182019CANADAMeatCHICKENNEW PostEstimatesNEW PostEstimatesNEW PostEstimatesBeginning Stocks434655Production1,2361,2951,330Total Imports174175180Total Supply1,4531,5161,565Total 65Total Dom. ConsumptionEnding StocksTotal DistributionAll data in 1,000 metric tons, carcass weight equivalentChicken Meat ProductionFAS/Canada forecasts 2019 chicken meat production to rise 3 percent to 1.33 MMT on strong demandfor broiler meat and continued relative price competitiveness across retail and food service sectors.FAS/Canada estimates 2018 chicken meat production reaching 1.295 MMT, growing 5 percent to meetrobust demand domestic demand. In Canada, the chicken meat market is driven by broiler meatproduction, representing roughly 98 percent of the market. The balance is comprised of other chickenmeat, mostly spent fowl (also called stewing hen).Under Canada’s supply management system, poultry farmers are not vertically integrated into theprocessing and further processing industries. A large number of independent chicken farmers, oftenrelatively small family operations, supply live birds to processing companies. Production is tightlycontrolled through a quota system. Representatives of chicken producers, poultry processors, poultryfurther-processors and the food service sector make production decisions jointly, taking into accountcurrent and forecast data on a multitude of indicators, including: imports, stocks, retail and food servicesales, wholesale and retail prices, competing protein prices, world production conditions, feed prices,exchange rates and domestic macroeconomic indicators. Then the Chicken Farmers of Canada (CFC),established under the Farm Products Agencies Act in 1979, allocates the total national quota volume foreach 8-week production cycle to each of the ten producing provinces, where provincial-levelorganizations allocate the production quota to individual producers in the province based on their shareof the total production quota. This system insulates Canadian chicken farmers from fluctuating feedcosts and stabilizes chicken farm income.Though CFC sets a minimum farm gate price, Canadian poultry processors have to price their productsto the demands of the Canadian market, which limits processors’ ability to pass on higher input costs.However, given higher than average chicken cutout values in 2018, FAS/Canada expects thatprocessors’ profit margins will remain positive into 2019.
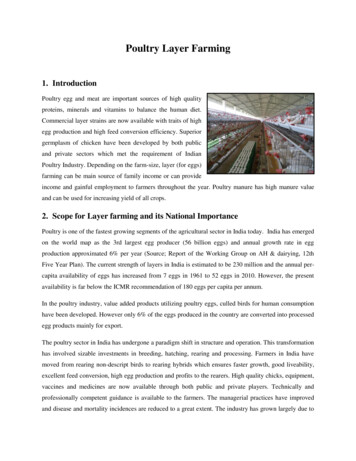
ConsumptionPer capita chicken meat consumption had been relatively stagnant for nearly 15 years before picking upin 2014. FAS/Canada forecasts per capita consumption levels to continue to rise again in 2019, up to36.5 kg from an estimated level of 36.2 kg in 2018. This recent consumption pattern reflects limitedand higher-priced red meat supplies driving consumers towards abundantly available and competitivelypriced chicken.Over the longer term, total domestic chicken consumption in Canada has tripled over the last 35 years,due in part to the country’s steady population growth, which pushed total population up more than 50percent from 24.5 million in 1980 to about 37.2 million in 2018. Over that time, Canadian preferenceshave shifted towards chicken primarily due to an increase in health awareness and the perception thatchicken is leaner, and therefore healthier, than other meats. Increased chicken consumption can also beattributed to the proliferation of chicken-based fast food offerings as well as Canada’s changing ethniccomposition. Nearly 1 in 5 Canadians was born in another country, and Canada’s immigrant populationincreasingly hails from countries with stronger dietary preferences for chicken rather than beef or pork.This increasing ethnic diversity has also expanded the range of food service outlets offering chickenbased dishes.PricesWith the supply management system, chicken producers receive a fixed price for their live birds, whichis based on production costs and determined every 8-week production cycle. Ontario is the largestchicken producing province in Canada, accounting for about one-third of the market, and thereforeOntario live bird prices are the basis for the calculation of prices in other provinces. Due to the supplymanagement system, producer prices have remained remarkably stable over time, and only showed amore substantial increase over the 2008-2013 period, due to substantial increases in feed prices. Since2014, prices have fallen, reflecting cheaper feed costs.Source: Chicken Farmers of Canada / *FAS/Canada estimate
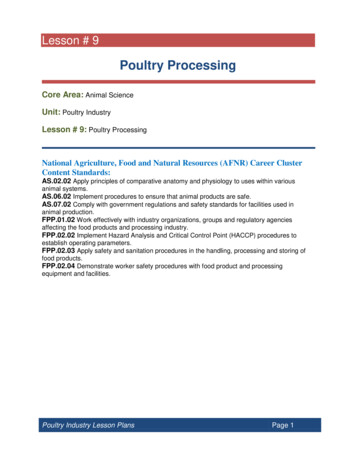
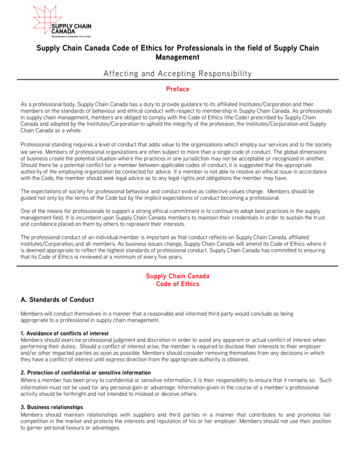
The Canadian supply management system only guarantees prices for producers. Wholesale and retailbroiler meat prices are usually reflective of market conditions in terms of supply and demand. They arealso reflective of consumer preferences for various chicken cuts, and of their quality and degree oftransformation.Similar to consumers in the United States, Canadian consumers tend to prefer white meat (breasts andwings) over dark meat (legs and thighs). The most expensive chicken cut is the fresh boneless skinlessbreast, widely used in restaurants and a preferred barbecue item for Canadians. Wings are particularlypopular during the winter hockey season. Leg quarters have traditionally been the least expensivechicken cuts in groceries. However, leg quarter retail prices have risen steadily in the past several yearsas greater consumption of ‘ethnic cuisine’ and consumer price sensitivity has driven popularity anddemand.Canada: Fresh Broiler Meat Retail Prices national average C /kgWholeBonelessSkinless 08.007.006.005.004.003.002.002008 2009201020112012201320142015201620174-week periods from December 21, 2008 to June 23, 2018Source:Agriculture and Agri-Food Canada
TradeImportsFor 2019, chicken meat imports are projected at 180,000 MT, up 5,000 MT from the estimated level of175,000 MT for 2018. Under the supply management system, broiler meat imports are controlled andsubject to a TRQ (for more information consult the policy section of this report), which is a function ofthe previous year’s production level. Additional imports outside of the TRQ are concentrated under twoimport-to-re-export programs (see the next section). Market conditions in the United Sates also play asignificant role in import decisions, since a large price differential between lower U.S. broiler meatprices and higher Canadian prices creates a strong incentive for importers to source U.S. chicken meat,especially under programs that provide a customs duty exemption (i.e., the import-to-re-exportprograms). Imports of spent fowl are not import controlled.The United States is Canada's largest supplier of chicken meat, with a market share typically above 85percent, followed by Brazil, at about 10 percent. In general, some Canadian importers are discouragedfrom importing Brazilian chicken, despite its lower cost, because it cannot be re-exported to the UnitedStates. As a very recent trend, Hungary has become a supplier of frozen wings to Canada (estimated at5,000 MT for 2018), outcompeting Brazil on price.Product Control for Brazilian PoultrySince USDA does not permit imports of Brazilian chicken meat, the Canadian Food Inspection Agency(CFIA) has strict import procedures to ensure that Brazilian chicken meat in Canada does not enter theUnited States. Under CFIA regulations, chicken meat imported from Brazil may not be exported to theUnited States and may not be used in the manufacture of meat products exported to the United States.Canadian poultry slaughter and processing establishments that import chicken meat from Brazil are noteligible to export poultry meat products to the United States. In addition, chicken meat and meatproducts from non-eligible establishments must not enter Canadian establishments that have full exportstatus for the United States. All Canadian establishments (including storage facilities) must segregatethe meat on their premises by country of origin and destination.ExportsFAS/Canada forecasts 2019 chicken meat exports at 130,000 MT, up 5,000 MT from the level estimatedfor 2018. In general, Canadian chicken exports fall into two broad categories. The majority representthe "re-export" side of Canada’s imports-to-re-export programs, since exports are a requirement of theprograms. The remaining volumes reflect ‘genuine’ exports, largely dark meat cuts to developingcountry markets. While market forces play a certain role in Canada’s export levels, the timeframe forthe re-export requirement under Canada’s import-to-re-export programs also impacts the chicken meatexport volumes in any given year.
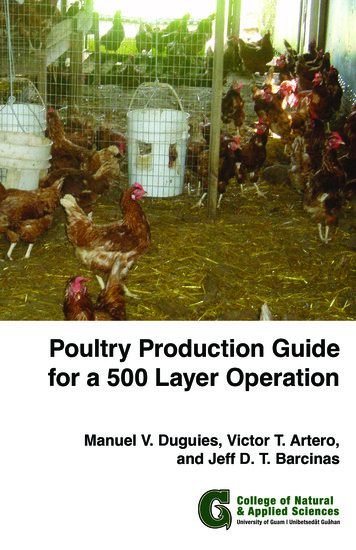
PolicyTariff Rate Quota1Canada controls broiler meat imports under a TRQ. The minimum access level into Canada under itsWorld Trade Organization (WTO) commitments is 39,844 MT, but Canada applies the higher accesslevel negotiated under NAFTA, equal to 7.5 percent of the previous year's domestic broiler productionas reported by Statistics Canada. For 2019, the global permit allowance is forecast to reach 95,000 MTbased upon the estimated 2018 production. For 2018, the global chicken TRQ is 90,100 MT, based onthe 2017 production level. Actual chicken imports under the TRQ may be slightly higher or lower thanthe allocated amounts, based on prevailing market conditions in each year.Under the TRQ, imports are subject to low "within access commitment" duty rates, while imports overthe TRQ limit are subject to prohibitive "over access commitment" rates. Under NAFTA, within TRQimports from the United States benefit from duty free treatment, while over-quota duties can reach 249percent. For instance, within access imports of fresh boneless breasts from the United States enterCanada duty free, while over access imports would be subject to a 249 percent tariff. Comparatively,within access imports of frozen boneless breasts from Brazil are subject to a 5 percent tariff, and overaccess imports face the same 249 percent tariff.Global Affairs Canada (GAC) issues supplementary import permits in the following situations: Resale Due to Domestic Market Shortages – no such permits were issued in 2017 Dark Chicken Meat not Supplied by the Chicken Farmers of Canada’s Domestic SupplyProgram – no such permits were issued in 2017 Import-to-Compete Program – 6,250 MT of import permits were issued by GAC in 2017 Import for Re-Export Program (IREP) – see chart below Test Marketing – no such permits were issued in 2017 Extraordinary or Unusual Circumstances – no such permits were issued in 2017Information on the chicken TRQ, supplementary imports and the process of importing broiler meat intoCanada is located on the GAC website.1The volumes of chicken meat mentioned in this section are expressed on a carcass weight equivalent basis based onCanada’s international trade commitments, under which import permits are issued at a 1:1 ratio for bone-in chicken cuts anda 2:1 ratio for boneless cuts. Therefore, the quantities mentioned in this section are not directly comparable with the volumesmentioned in the rest of this report.
Source: GAC/DFATD, CBSA, Statistics Canada, FAS/Canada calculations / *FAS/Canada estimateImports for Re-Export ProgramTraditionally, the majority of supplementary imports have been comprised of imports under the IREPprogram. The program requires that the resulting processed chicken product be exported, sincediversion of product imported under IREP to the Canadian (domestic) market is prohibited. IREP helpsCanadian poultry processors remain viable by giving them access to lower priced imported chicken, butoffers little to Canadian consumers who pay high retail prices for chicken under the supply managedregime. Canadian proponents of the IREP program argue that it allows Canadian chicken processingplants to achieve economies of scale they could not otherwise achieve if restricted to available suppliesof domestically produced chicken. IREP imports steadily grew over time, to the point where in 2008they exceeded the import volumes under the global TRQ for the first time. IREP imports may besourced from any country and re-exported to any country, but in practice almost the entire volume isimported from the United States, and exported back to the U.S. market.Duties Relief Program2012 marked the emergence of increased utilization of the Duties Relief Program (DRP) operated by theCanada Border Services Agency (CBSA). Details about the program can be found following this link.While in general the DRP is very similar to IREP, there are some differences that make DRP moreappealing to importers. For instance, DRP requires the finished chicken meat products to be re-exportedwithin four years, rather than the three-month limit under IREP. Imports of chicken under DRP peakedin 2015 and have since declined following a series of compliance verification activities in 2016 thatrevealed program non-compliance. FAS/Canada expects use of DRP will further decline into 2019,while some companies will return to the IREP program.Government Consultations on IREP/DRPThe Canadian federal government launched consultations with industry stakeholders on potentialchanges to IREP and DRP in the spring of 2017, following an announcement in November 2016, to
“address the concerns of import predictability and effective border controls for supply-managedcommodities, while ensuring that Canadian processors who use dairy and poultry inputs can remaincompetitive in export markets.” The federal government is still reviewing input received fromstakeholders, and there is no timeframe for a decision on possible changes to the programs.FAS/Canada estimates 2018 imports under IREP and DRP at 76,000 MT, down from the 2015 recordlevel of 113,000 MT.Special Agricultural SafeguardIn 2008, Canada notified volume and price triggers that would be used to operationalize the WTOSpecial Agricultural Safeguard (SSG) for Canada’s supply-managed products, including broiler meat.The SSG allows additional duties to be triggered when import prices fall below a certain price level orexceed a certain volume. Canada published its most recent volumetric trigger levels in 2013; pricetriggers have not yet been published. In the event that import prices fall below trigger prices, the SSGwould not automatically be activated, but the situation would be evaluated on a case-by-case basisrequiring formal WTO notification and an Order in Council (i.e., federal cabinet approval). To date,Canada has never used the SSG mechanism.
Aug 15, 2018 · Beginning Stocks 43 46 55 Production 1,236 1,295 1,330 Total Imports 174 175 180 Total Supply 1,453 1,516 1,565 Total Exports 134 125 130 Total Dom. Consumption 1,273 1,336 1,385 Ending Stocks 46 55 50 Total Distribution 1,453 1,516 1,565 All data in 1,000 metri