Transcription
TRICERATOPSTrading SYSTEM
TriceratopsTrading SystemTRICERATOPSTrading SYSTEMHypothetical or simulatedperformance results havecertain inherent limitations.One of the limitations ofhypothetical performanceUnlike an actual performance record,prepared with the benefit of hindsight. Insimulated results do not represent actualaddition, hypothetical trading does nottrading. Also, since the trades have notinvolve financial risk, and no hypotheticalactually been executed, the results maytrading record can completely account forhave under -or over-compensated for thethe impact of financial risk in actual trading.impact, if any, of certain market factors,For example, the ability to withstand lossessuch as lack of liquidity. Simulated tradingor adhere to a particular trading programprograms in general are also subject to theinspite of trading losses are materialfact that they are designed with the benefitpoints which can also adversely affectof hindsight. No representation is beingactual trading results. There are numerousmade that any account will or is likely toother factors related to the markets inachieve profits or losses. There have beengeneral or to the implementation of anyno promises, guarantees or warrantiesspecific trading program which cannot besuggesting that any trading will result in afully accounted for in the preparation ofprofit or will not result in a loss.hypothetical performance results and all ofHypothetical performanceresults have many inherentresults is that they are generallywhich can adversely affect actual tradingresults.limitations, some of which aredescribed below. No representation isTRENDFOLLOWING.COMbeing made that any account will or islikely to achieve profits or losses similar tothose shown. In fact, there are frequentlysharp differences between hypotheticalperformance results and the actual resultssubsequently achieved by any particulartrading program.Triceratops Trading System TrendFollowing.com
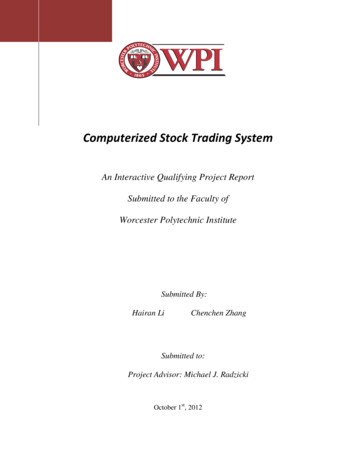
TriceratopsTrend FollowingTrading System(“TriTop”)and how to scale positions up or down basedAll traders have different riskThe TriTop Trend Following Tradingon your equity. The TriTop system maximizestolerances. Your risk tolerance might beSystem is a weekly breakout basedrisk dollars on all positions.different than your friends and family. Forsystem designed for the ETF andEquity markets. The core logic is simple,straightforward and easy to understand. Thethis reason you can easily change TriTop forThe TriTop system comes in two forms: TradeStation code and without code. your unique situation. You can easily edityour maximum risk level, markets to tradesystem is long only, it does not issue sellYou will receive TradeStation code and aand whether to use money management orSince 1996 Michael Covel hasprovided top of the line trendtrading systems and education toshort signals. It always adapts to currentwritten trading manual. The code can benot. Note: Volatile moves can hinder themarket conditions in a very creative way.rewritten into another programming languageability to prevent certain losses.Additionally, TriTop has two very uniqueor imported into other charting services suchthousands in 70 countries.differences worth considering. as MetaStock or Esignal .My research firm Trend Following is pleasedFirst, there is an accelerated profitto announce two additional trend followingtaking mechanism. Trend followers, it cansystems. These are stand-alone trend followingbe argued, often leave profits on the table, ortrading systems that each tackle great trenddon’t take profits quick enough. The exit logicfollowing trading from a different vantagefor TriTop is designed to aggressively protectpoint. My firm has spent thousands of hours inopen trade profits during parabolic moves.intensive computational research developingThe goal is to capture more open trade“”each system. That research, combined with myunique access to the great trend traders alivetoday, is the basis for these systems. No stonehas been left unturned in finding new ways toprofit. To say there has been a great deal ofdigging to find moneymaking trend followingangles would be an understatement. These areequity than other trend following systems andmethods.Second, money management is core.Many trend-trading systems offer only veryTriTop Trend Following Trading System: Dynamic contract allocationset at 10% allocation per trade. This illustration shows shares allocated for eachtrading signal by calculating the number of shares to trade by using 10% of the account anddividing by the share price. It is showing compounded gains as allocations change with equityfluctuations.TriTop Trend Following Trading System: 250 Shares per signal. Thisillustration shows a constant 250 shares taken for each trading signal.TriTop Trend Following Trading System: 5,000 allocation for shares.This illustration shows a constant 5,000 worth of shares taken for each trading signal.basic money management. They often solvethe issue of when to exit, but that is notenough. Simply setting a stop loss is not true100% REBATE OFFER!the exact types of systems used by some of themoney management. You need to know howTradeStation will rebate 100% of the purchase price of any Trend Following great professional trend followers trading today.much of your account to risk on each tradeproduct. Email info@trendfollowing.com for all of the details.Triceratops Trading System TrendFollowing.comTriceratops Trading System TrendFollowing.com
FAQs:Do I need a TradeStation accountto trade the TriTop system? No, thesystem is open source and does not requirea subscription to TradeStation . It is possibleto trade the system by using paper andpencil, but TradeStation users will have thebenefit of pre-programmed code.Do I need a particular starting accountsize? Many great traders start with a smallaccount. Starting with larger amounts doesnot guarantee success. Equity markets arealso very scalable. You can start with a fewor many shares as you dictate.Do you recommend a specific portfolioof markets? No, market selection canvary and is up to each trader. Our Flagshipsystem/training covers portfolio selection andis recommended.What program was used to generatethese reports? TradeStation’s PortfolioMaestro was used for testing. It producedthe output in this brochure.Were commissions & slippage ratesused in testing? Yes, a commission/slippage rate of 10.99 per trade/side wasused. These charges are shown at thebottom of the summary sheet.What time frame was used? Using dailyTriTopTrading Systemdata results were generated from October 1,1999 until January 15, 2013.Does the system sell short? No thesystem is long only. No short signals aregenerated.Can I change the inputs of TriTop? Canthe rules be altered? Yes, the systemrules and code are open source. You canedit rules as you see fit or leave as originallydesigned.What market symbols were used?A complete symbol list is shown with eachillustration.SUMMARY of BENEFITS:TriTop uses an accelerated profit takingmechanism to protect profits during parabolicmoves.Weekly-bar trend following system.Designed for use on ETF and Equity markets.User can customize trade parameters andmarket selection.TriTop Tradestation code allows the user to settheir own risk dollars so that positions are sizedbased on their own risk level.TriTop Tradestation code allows for dynamicposition sizing.TriTop Tradestation code is long only which isuseful for those trading retirement funds.System generates entries, exit, stop loss andIf you have any questions about TriTop pleaseprofit signals.contact us at info@trendfollowing.com.Triceratops Trading System TrendFollowing.comTriceratops Trading System TrendFollowing.com
TriTopTrading System10% Share AllocationSUMMARYBeginning BalanceTotal ReturnTotal Realized ReturnGross ProfitGross LossOpen Trade P/L 6)51,531.14Number of TradesNumber of Winning TradesNumber of Losing Trades% ProfitableNumber of Markets TradedAverage Trade Duration48018829239.17%2983.4 daysAverage TradeStandard Deviation Trade 640.193,830.07Largest Winning TradeLargest Losing Trade 19,753.02(7,984.48)Average Win / Average LossAnnulaized Sharpe Ratio (rf 2%)2.610.6071Compounded Annual ReturnCompounded Monthly Return12.13%0.95%Percent Days ProfitablePercent Months ProfitablePercent Years ProfitableTotal CommissionsTriceratops Trading System TrendFollowing.com 51.08%49.69%66.67%10,704.26Win/Loss AnalysisWinning Trades Number of Winning TradesAverage Win Maximum Consecutive WinsLargest Winning Trade Average Winning Trade Length760,697.761884,046.26719,753.02146.52 daysLosing Trades Number of Losing TradesAverage Loss Maximum Consecutive LossesLargest Losing Trade Average Losing Trade Length(453,405.16)292(1,552.76)14(7,984.48)42.77 daysReturn AnalysisAnnual ReturnsAverageStandard DeviationMonthly ReturnsAverageStandard DeviationDaily ReturnsAverageStandard DeviationBest 12-month periodWorst 12-month ng 3/7/2003-13.74%starting 3/3/2000Equity AnalysisEquity DrawdownMaximumMaximum Drawdown DateAverageStandard Deviation30.33%2/14/20037.16%6.77%Triceratops Trading System TrendFollowing.com
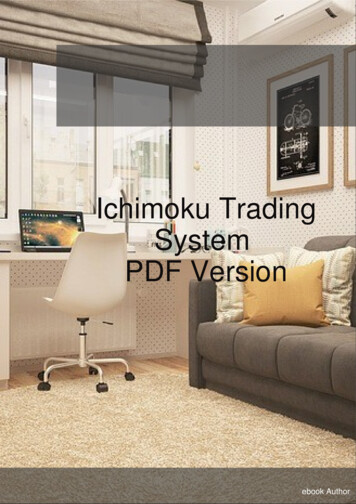
PROGRAM SETTINGSCreated usingPortfolio Maestro 3.0.43.0Base CurrencyUSDInitial Capital 100,000.00CommissionsStock - 10.99 per TradeStart Date10/1/1999 12:00:00 AMEnd Date1/15/2013 11:59:59 PMStrategy GroupTriTopTrading SymbolsAGO (Assured Guaranty),AKR (Acadia Realty Trust), AZPN (Aspen Technology), CCI(Crown Castle Intl), COST (Costco), CSCO (Cisco Systems),CVH (Coventry Health Care), DDR (DDR Corp), ECH (ISharesMSCI Chile), EQU (Equal Energy Ltd), EWN (ISharesMSCI Netherlands), EWS (IShares MSCI Singapore),FXA (CurrencyShares Australian ), GLD (SPDR Gold Trust),HNZ (HJ Heinz), ILF (IShares S&P Latin Am 40), IMO(Imperial Oil), IOO (IShares S&P Global 100), IYE(IShares DJ US Energy Sec), MAT (Mattel), PLL (Pall Corp),QGEN (Qiagen), SGOL (ETFS Gold Trust), SLF(Sun Life Financial Svcs), SKT (Tanger Factory Outlet),SPY (S&P 500 Tracker), THD (IShares MSCI Thailand),VAL (Valspar), VSS (Vanguard FTSE ETF)Max Bars Study References50Money ManagementFixed Fractional by Market ValueInputsMaximum Contracts 25000Percent Risk 0.1Growth of 100,000December 1999 - December 2012(10% share allocation per trade) 500,000 400,000 300,000S&P 500Tri Top 200,000250 shares per tradeSummaryBeginning BalanceTotal ReturnTotal Realized ReturnGross ProfitGross LossOpen Trade P/L 13,213.64Number of TradesNumber of Winning TradesNumber of Losing Trades% ProfitableNumber of Markets TradedAverage Trade Duration48018629438.75%2983.4 daysAverage TradeStandard Deviation Trade 147.071,125.18Largest Winning TradeLargest Losing Trade 6,685.52(3,181.98)Average Win / Average Loss2.42Annualized Sharpe Ratio0.4903Comparison of TriTop versus buy and hold S&P 500 600,000TriTopTrading SystemCompounded Annual ReturnCompounded Monthly Return4.68%0.38%Percent Days ProfitablePercent Months ProfitablePercent Years Profitable48.78%49.07%60.00%Total Commissions 10,704.26 100,000Triceratops Trading System Sep-99 -Triceratops Trading System TrendFollowing.com
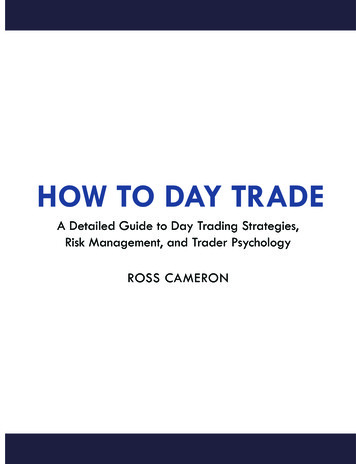
Win/Loss AnalysisWinning Trades Number of Winning TradesAverage Win Percent of Winning TradesMaximum Consecutive WinsLargest Winning Trade Average Winning Trade Length203,706.721861,095.2038.75%76,685.52147.23 daysLosing Trades Number of Losing TradesAverage Loss Percent of Losing TradesMaximum Consecutive LossesLargest Losing Trade Average Losing Trade 02 daysTotal Commissions 10,704.26Return AnalysisAnnual ReturnsAverageStandard DeviationMonthly ReturnsAverageStandard DeviationDaily ReturnsAverageStandard DeviationBest 12-month periodstarting 9/3/2010Worst 12-month periodstarting 3/3/20004.53%9.47%0.42%2.83%Created usingPortfolio Maestro 3.0.43.0Base CurrencyUSDInitial Capital 100,000.00CommissionsStock - 10.99 per TradeStart Date10/1/1999 12:00:00 AMEnd Date1/15/2013 11:59:59 PMStrategy GroupTriTopTrading SymbolsAGO (Assured Guaranty),AKR (Acadia Realty Trust), AZPN(Aspen Technology),CCI (Crown Castle Intl), COST(Costco), CSCO(Cisco Systems), CVH (Coventry Health Care), DDR(DDR Corp), ECH (IShares MSCI Chile), EQU (EqualEnergy Ltd), EWN (IShares MSCI Netherlands),EWS (IShares MSCI Singapore), FXA (CurrencySharesAustralian ), GLD (SPDR Gold Trust), HNZ (HJ Heinz),ILF (IShares S&P Latin Am 40), IMO (Imperial Oil), IOO(IShares S&P Global 100), IYE (IShares DJ US Energy Sec),MAT (Mattel), PLL (Pall Corp), QGEN (Qiagen),SGOL (ETFS Gold Trust), SLF (Sun Life Financial Svcs),SKT (Tanger Factory Outlet), SPY (S&P 500 Tracker),THD (IShares MSCI Thailand), VAL (Valspar),VSS (Vanguard FTSE ETF)Max Bars Study References50Money ManagementFixed QuantityInputsFixed Shares 250Comparison of TriTop versus buy and hold S&P 500Growth of 100,0000.10%1.46%27.14%-13.00%December 1999 - December 2012(250 shares allocated on each TriTop signal) 200,000.00 180,000.00 160,000.00 140,000.00 120,000.00Equity Analysis24.27%2/14/20035.91%5.84% 100,000.00S&P 500 80,000.00Tri Top 60,000.00 40,000.00 20,000.00 10Jan-11Sep-11May-12Equity DrawdownMaximumMaximum Drawdown DateAverageStandard DeviationProgram SettingsTriceratops Trading System TrendFollowing.comTriceratops Trading System TrendFollowing.com
Strategy AnalysisTriTop Trading Signal 5,000 allocation per SignalSummaryBeginning BalanceTotal ReturnTotal Realized ReturnGross ProfitGross LossOpen Trade P/L ,258.14Number of TradesNumber of Winning TradesNumber of Losing Trades% ProfitableNumber of Markets TradedAverage Trade Duration45517028537.36%2983.4 daysAverage TradeStandard Deviation Trade 147.67880.36Largest Winning TradeLargest Losing Trade 8,566.02(1,208.98)Average Win / Average LossAnnualized Sharpe Ratio (fr 2%)3.120.5481Compounded Annual ReturnCompounded Monthly Return4.13%0.33%Total Commissions 10,154.76Win/Loss AnalysisWinning Trades Number of Winning TradesAverage Win Percent of Winning TradesMaximum Consecutive WinsLargest Winning Trade Average Winning Trade Length145,479.90170855.7637.36%78,566.02148.4 daysLosing Trades Number of Losing TradesAverage Loss Percent of Losing TradesMaximum Consecutive LossesLargest Losing Trade Average Losing Trade 5 daysTotal Commissions10,154.76 Return AnalysisAnnual ReturnsAverageStandard DeviationAnnualized Sharpe RatioMonthly ReturnsAverageStandard DeviationDaily ReturnsAverageStandard DeviationBest 12-month periodWorst 12-month period0.35%1.80%0.08%0.90%25.88%starting 4/4/2003-7.20%starting 3/3/2000Equity AnalysisEquity DrawdownMaximumMaximum Drawdown DateAverageStandard DeviationTriceratops Trading System 16%Triceratops Trading System TrendFollowing.com
Program SettingsCreated usingPortfolio Maestro 3.0.43.0Base CurrencyUSDInitial Capital 100,000.00CommissionsStock - 10.99 per TradeStart Date10/1/1999 12:00:00 AMEnd Date1/15/2013 11:59:59 PMStrategy GroupTriTopTrading SymbolsAGO (Assured Guaranty), AKR (AcadiaRealty Trust), AZPN (Aspen Technology), CCI (CrownCastle Intl), COST (Costco), CSCO (Cisco Systems), CVH(Coventry Health Care), DDR (DDR Corp), ECH (ISharesMSCI Chile), EQU (Equal Energy Ltd), EWN (ISharesMSCI Netherlands), EWS (IShares MSCI Singapore),FXA (CurrencyShares Australian ), GLD (SPDR GoldTrust), HNZ (HJ Heinz), ILF (IShares S&P Latin Am 40),IMO (Imperial Oil), IOO (IShares S&P Global 100),IYE (IShares DJ US Energy Sec), MAT (Mattel), PLL(Pall Corp), QGEN (Qiagen), SGOL (ETFS Gold Trust),SLF (Sun Life Financial Svcs), SKT (Tanger FactoryOutlet), SPY (S&P 500 Tracker), THD (ISharesMSCI Thailand), VAL (Valspar),VSS (Vanguard FTSE ETF)Max Bars Study References50Inputsmmgment Trueriskdollars 5000TRICERATOPSTrading SYSTEMComparison of TriTop versus buy and hold S&P 500Growth of 100,000December 1999 - December 2012( 5,000 allocated on each TriTop signal) 200,000 180,000 160,000 140,000 120,000 100,000S&P 500 80,000Tri Top 60,000 40,000 20,000Triceratops Trading System 03Sep-03May-02Jan-01Sep-01Sep-99May-00 -TRENDFOLLOWING.COM
Since 1996 Michael Covel has provided top of the line trend trading systems and education to thousands in 70 countries.” My research firm Trend Following is pleased to announce two additional trend following systems. These are stand-alone trend following trading systems that each tackle great