Transcription
ProportionalRelationships?3MODULELESSON 3.1ESSENTIAL QUESTIONRepresentingProportionalRelationshipsHow can you useproportional relationshipsto solve real-worldproblems?COMMONCORE8.EE.6, 8.F.4LESSON 3.2Rate of Changeand SlopeCOMMONCORE8.F.4LESSON 3.3Interpreting the UnitRate as Slope Houghton Mifflin Harcourt Publishing Company Image Credits: AngeloGiampiccolo/ShutterstockCOMMONCORE8.EE.5, 8.F.2, 8.F.4Real-World VideoSpeedboats can travel at fast rates while sailboatstravel more slowly. If you graphed distance versustime for both types of boats, you could tell by themy.hrw.com steepness of the graph which boat was faster.my.hrw.commy.hrw.comMath On the SpotAnimated MathPersonal Math TrainerGo digital with yourwrite-in studentedition, accessible onany device.Scan with your smartphone to jump directlyto the online edition,video tutor, and more.Interactively explorekey concepts to seehow math works.Get immediatefeedback and help asyou work throughpractice sets.67
Are YOU Ready?PersonalMath TrainerComplete these exercises to review skills you will needfor this module.Write Fractions as DecimalsEXAMPLE1.7 ?2.5my.hrw.comOnlineAssessment andInterventionMultiply the numerator and thedenominator by a power of 10 so that thedenominator is a whole number.1.7 1017 2.5 1025Write the fraction as a division problem.Write a decimal point and zeros in thedividend.Place a decimal point in the quotient.Divide as with whole numbers.0.68 25 17.00-15 02 00-2 000Write each fraction as a decimal.1. 380.32.0.40.133.0.20.394.0.755. 450.16.23.57.1478.140.39.10Solve Proportions5x 7145 2x 7 2147 2 14, so multiply the numerator anddenominator by 2.10x 14145 2 10x 10Solve each proportion for x.68Unit 2201010. x18x3011. 1272412. 4x 161113213.x 1203614. 4x482115. 9x 272416. 2x163017. 6x151818. 3x 36 Houghton Mifflin Harcourt Publishing CompanyEXAMPLE
Reading Start-UpVisualize VocabularyVocabularyReview Wordsconstant (constante) equivalent ratios (razonesequivalentes)proportion (proporción)rate (tasa) ratios (razón) unit rates (tasas unitarias)Use the words to complete the diagram.Reviewing ProportionsPreview Words12 inches,1 foot2:6, 3 to 4535, 25,10 50 70 1.25per ounceconstant of proportionality(constante deproporcionalidad)proportional relationship(relación proporcional)rate of change (tasa decambio)slope (pendiente)Understand Vocabulary Houghton Mifflin Harcourt Publishing CompanyMatch the term on the left to the definition on the right.1. unit rateA. A constant ratio of twovariables related proportionally.2. constant ofproportionalityB. A rate in which the second quantityin the comparison is one unit.3. proportionalrelationshipC. A relationship between twoquantities in which the ratio ofone quantity to the other quantityis constant.Active ReadingKey-Term Fold Before beginning the module,create a key-term fold to help you learn thevocabulary in this module. Write the highlightedvocabulary words on one side of the flap. Writethe definition for each word on the other sideof the flap. Use the key-term fold to quiz yourselfon the definitions used in this module.Module 369
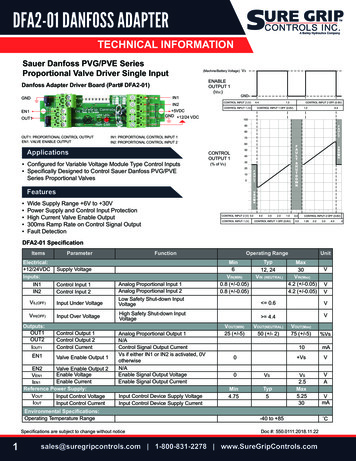
MODULE 3Unpacking the StandardsUnderstanding the standards and the vocabulary termsin the standards will help you know exactly what youare expected to learn in this module.Graph proportionalrelationships, interpreting theunit rate as the slope of thegraph. Compare two differentproportional relationshipsrepresented in different ways.Key Vocabularyproportional relationship(relación proporcional)A relationship between twoquantities in which the ratioof one quantity to the otherquantity is constant.slope (pendiente)A measure of the steepnessof a line on a graph; the risedivided by the run.unit rate (tasa unitaria)A rate in which the secondquantity in the comparison isone unit.What It Means to YouYou will use data from a table and agraph to apply your understandingof rates to analyzing real-worldsituations.UNPACKING EXAMPLE8.EE.5The table shows the volume of waterreleased by Hoover Dam over acertain period of time. Use the datato make a graph. Find the slope ofthe line and explain what it shows.Water Releasedfrom Hoover DamVolume ofTime (s)water (ft3)575,00010150,00015225,00020300,000Water Released fromHoover 0O5 10 15 20Time (s)The slope of the line is 15,000. This means that for every secondthat passed, 15,000 ft3 of water was released from Hoover Dam.Suppose another dam releases water over the same period of timeat a rate of 180,000 ft3 per minute. How do the two rates compare?180,000 ft3 per minute is equal to 3,000 ft3 per second. This rate isone fifth the rate released by the Hoover Dam over the same timeperiod.Visit my.hrw.comto see all theCommon CoreStandardsunpacked.my.hrw.com70Unit 2 Houghton Mifflin Harcourt Publishing Company Image Credits: Getty Images8.EE.5Volume of water (ft3)COMMONCORE
ENTIAL QUESTIONCOMMONCORE8.EE.6 derive the equationy mx for a line throughthe origin Also 8.F.4How can you use tables, graphs, and equations to representproportional situations?COMMONCOREEXPLORE ACTIVITYPrep for 8.EE.6Representing ProportionalRelationships with TablesIn 1870, the French writer Jules Verne published 20,000 Leagues Under the Sea,one of the most popular science fiction novels ever written. One definition ofa league is a unit of measure equaling 3 miles.A Complete the table.Distance(leagues)Distance(miles)126320,00036 Houghton Mifflin Harcourt Publishing CompanyB What relationships do you see among the numbers in the table?C For each column of the table, find the ratio of the distance in miles tothe distance in leagues. Write each ratio in simplest form.3 1 2 636 20,000D What do you notice about the ratios?Reflect1.If you know the distance between two points in leagues, how can youfind the distance in miles?2.If you know the distance between two points in miles, how can you findthe distance in leagues?Lesson 3.171
Representing ProportionalRelationships with EquationsMath On the Spotmy.hrw.comThe ratio of the distance in miles to the distance in leagues is constant. Thisrelationship is said to be proportional. A proportional relationship is arelationship between two quantities in which the ratio of one quantity to theother quantity is constant.A proportional relationship can be described by an equation of the formy kx, where k is a number called the constant of proportionality.ySometimes it is useful to use another form of the equation, k x .EXAMPLE 1COMMONCORE8.EE.6Meghan earns 12 an hour at her part-time job. Show that the relationshipbetween the amount she earned and the number of hours she worked is aproportional relationship. Then write an equation for the relationship.STEP 2Make a table relating amountearned to number of hours.Number of hours1248Amount earned ( )12244896For each number of hours, write the relationship of the amountearned and the number of hours as a ratio in simplest form.amount earnednumber of hours12 121124 1212Math TalkSTEP 3Describe two real-worldquantities with a proportionalrelationship that can bedescribed by theequation y 25x.Write an equation.Use the ratio as the constant of proportionality in the equation y kx.YOUR TURNmy.hrw.com72Unit 2First tell what thevariables represent.Let x represent the number of hours.Let y represent the amount earned.12The equation is y 1 x or y 12x.Online Assessmentand Intervention96 121812Since the ratios for the two quantities are all equal to, the1relationship is proportional.Mathematical PracticesPersonalMath Trainer48 12413. Fifteen bicycles are produced each hour at theSpeedy Bike Works. Show that the relationshipbetween the number of bikes produced and thenumber of hours is a proportional relationship.Then write an equation for the relationship. Houghton Mifflin Harcourt Publishing CompanySTEP 1For every hour Meghanworks, she earns 12. So,for 8 hours of work, sheearns 8 12 96.
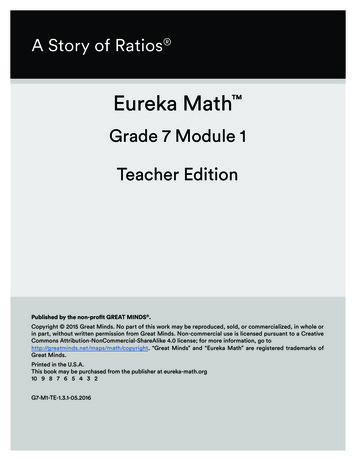
Representing ProportionalRelationships with GraphsYou can represent a proportional relationshipwith a graph. The graph will be a line that passesthrough the origin (0, 0). The graph shows therelationship between distance measured in milesto distance measured in leagues.10Math On the PL 2EXAMPLECOMMONCORESTEP 1Use the points on the graph to makea table.108642OEarth weight (lb)6121830Moon weight (lb)12356 12 18 24 30Earth weight (lb)Find the constant of proportionality.Moon weightEarth weight1 1662 16123 16185 1630The constant of proportionality is 6 1 .STEP 3Write an equation.Let x represent weight on Earth.Let y represent weight on the Moon.The equation is y 6 1 x.1Replace k within y kx.6YOUR TURNThe graph shows the relationship betweenthe amount of time that a backpackerhikes and the distance traveled.4. What does the point (5, 6) represent?5. What is the equation of the relationship?20Distance (mi) Houghton Mifflin Harcourt Publishing Company Image Credits: David Epperson/PhotoDisc/Getty ImagesSTEP 2Moon weight (lb)The graph shows the relationshipbetween the weight of an object on theMoon and its weight on Earth. Write anequation for this relationship.8.EE.616128PersonalMath Trainer4O5 10 15 20 25Time (h)Online Assessmentand Interventionmy.hrw.comLesson 3.173
Guided Practice1. Vocabulary A proportional relationship is a relationship betweentwo quantities in which the ratio of one quantity to the other quantityis / is notconstant.2. Vocabulary When writing an equation of a proportional relationship in theform y kx, k represents the.3. Write an equation that describes the proportional relationship betweenthe number of days and the number of weeks in a given length of time.(Explore Activity and Example 1)a. Complete the table.Time (weeks)1Time (days)7241056b. Let x represent.Let y represent.The equation that describes the relationship is.Each table or graph represents a proportional relationship. Write anequation that describes the relationship. (Example 1 and Example 2)24512034Map of Iowa10080604020O1234Distance (in.)?ESSENTIAL QUESTION CHECK-IN6. If you know the equation of a proportional relationship, how can youdraw the graph of the equation?74Unit 25 Houghton Mifflin Harcourt Publishing CompanyOxygenatomsHydrogenatoms5.Actual distance (mi)4. Physical Science The relationshipbetween the numbers of oxygen atoms andhydrogen atoms in water
NameClassDate3.1 Independent PracticeCOMMONCOREPersonalMath Trainer8.EE.6, 8.F.4my.hrw.comOnlineAssessment andInterventionThe table shows the relationship between temperatures measured on theCelsius and Fahrenheit scales.Celsius temperature01020304050Fahrenheit temperature325068861041227. Is the relationship between the temperature scales proportional?Why or why not?8. Describe the graph of the Celsius-Fahrenheit relationship.9. Analyze Relationships Ralph opened a savings account with a depositof 100. Every month after that, he deposited 20 more.a. Why is the relationship described not proportional? Houghton Mifflin Harcourt Publishing Companyb. How could the situation be changed to make the situationproportional?10. Represent Real-World Problems Describe a real-world situation that1can be modeled by the equation y 20 x. Be sure to describe what eachvariable represents.Look for a Pattern The variables x and y are related proportionally.11. When x 8, y 20. Find y when x 42.12. When x 12, y 8. Find x when y 12.Lesson 3.175
13. The graph shows the relationship between the distance that a snailcrawls and the time that it crawls.10Time (min)a. Use the points on the graph to make a table.Snail CrawlingDistance (in.)Time (min)b. Write the equation for the relationship and tell what eachvariable represents.8642O10 20 30 40 50Distance (in.)c. How long does it take the snail to crawl 85 inches?Work AreaFOCUS ON HIGHER ORDER THINKING14. Communicate Mathematical Ideas Explain why all of the graphs in thislesson show the first quadrant but omit the other three quadrants.15. Analyze Relationships Complete the table.Length of side of square12345Perimeter of squarea. Are the length of a side of a square and the perimeter of the squarerelated proportionally? Why or why not?b. Are the length of a side of a square and the area of the square relatedproportionally? Why or why not?16. Make a Conjecture A table shows a proportional relationship where k isthe constant of proportionality. The rows are then switched. How doesthe new constant of proportionality relate to the original one?76Unit 2 Houghton Mifflin Harcourt Publishing CompanyArea of square
LESSON3.2?Rate of Changeand SlopeCOMMONCORE8.F.4 Determine the rate ofchange of the functionfrom two (x, y) values,including reading these froma table or from a graph .ESSENTIAL QUESTIONHow do you find a rate of change or a slope?Investigating Rates of ChangeA rate of change is a ratio of the amount of change in the dependent variable,or output, to the amount of change in the independent variable, or input.EXAMPL 1EXAMPLECOMMONCORE8.F.4Math On the Spotmy.hrw.comEve keeps a record of the number of lawns she has mowed and the moneyshe has earned. Tell whether the rates of change are constant or variable.Day 1Day 2Day 3Day 4Number of lawns1368Amount earned ( )154590120STEP 1Identify the input and output variables.Input variable: number of lawnsSTEP 2Output variable: amount earnedFind the rates of change.change in - 1530 45 15Day 1 to Day 2:3-12change in lawnsMath TalkMathematical Practices Houghton Mifflin Harcourt Publishing Companychange in - 4545Day 2 to Day 3: 90 156-33change in lawnsWould you expect the ratesof change of a car’s speedduring a drive through acity to be constant orvariable? Explain.change in - 9030Day 3 to Day 4: 120 158-62change in lawnsThe rates of change are constant: 15 per lawn.YOUR TURN1.The table shows the approximate height of afootball after it is kicked. Tell whether therates of change are constant or variable.Find the rates of change:The rates of change are constant / variable.Time (s)Height (ft)000.5181.531226PersonalMath TrainerOnline Assessmentand Interventionmy.hrw.comLesson 3.277
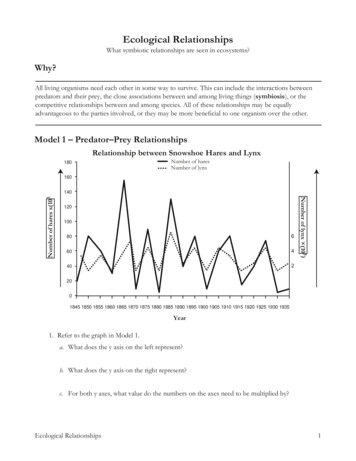
EXPLORE ACTIVITYCOMMONCORE8.F.4Using Graphs to Find Rates of ChangeYou can also use a graph to find rates of change.The graph shows the distance Nathan bicycled over time.What is Nathan’s rate of change?change in distance 30 change in time12-1miles per hour(4,60)50(3,45)4030(2,30)2010OB Find the rate of change from 1 hour to 4 hours.change in distance 60 change in time4-Distance (mi)A Find the rate of change from 1 hour to 2 hours.60(1,15)246Time (h)miles per hourC Find the rate of change from 2 hours to 4 hours.change in distance 60 change in time4-miles per hourReflect2.Make a Conjecture Does a proportional relationship have a constantrate of change?3.Does it matter what interval you use when you find the rate of changeof a proportional relationship? Explain.78Unit 2 Houghton Mifflin Harcourt Publishing CompanyD Recall that the graph of a proportional relationship is a line throughthe origin. Explain whether the relationship between Nathan’s time anddistance is a proportional relationship.
Calculating Slope myWhen the rate of change of a relationship is constant,any segment of its graph has the same steepness.The constant rate of change is called the slope of the line.Run 3Rise 2xOMath On the Spotmy.hrw.comSlope FormulaThe slope of a line is the ratio of the change in y-values (rise) for asegment of the graph to the corresponding change in x-values (run).y2 - y 1m x -x21EXAMPL 2EXAMPLECOMMONCORE8.F.4My NotesFind m the slope of the line.STEP 1Choose two points on the line.P1(x1, y1)P2(x2, y2)STEP 2Find the change in y-values (rise y2 - y1)and the change in x-values (run x2 - x1)as you move from one point to the other.run x2 - x1 -6 - (-3) -3rise y2 - y1 4-2 2Rise 2P1 (-3, 2)Oy -yrise12m run x - x122 -3 - 23YOUR TURN4. The graph shows the rate at which wateris leaking from a tank. The slope of theline gives the leaking rate in gallons perminute. Find the slope of the line.Rise Slope Run yAmount (gal) Houghton Mifflin Harcourt Publishing CompanySTEP 3P2 (-6, 4)If you move up or right,the change is positive.If you move down or left,the change is negative.5Run -3Leaking tank642Ox2468 10Time (min)PersonalMath TrainerOnline Assessmentand Interventionmy.hrw.comLesson 3.279
Guided PracticeTell whether the rates of change are constant or variable. (Example 1)1. building measurements2. computers soldFeet3122775Week24920Yards14925Number Sold61225603. distance an object falls4. cost of sweatersDistance (ft)1664144256Number2479Time (s)1234Cost ( )3876133171Erica walks to her friend Philip’s house. The graph shows Erica’s distancefrom home over time. (Explore Activity)Distance (ft)10005. Find the rate of change from 1 minute to 2 minutes.400 changein distance change in time2-ft per min800600400200O246Time (min)6. Find the rate of change from 1 minute to 4 minutes.Find the slope of each line. (Example 2)8.yy5-5O5xx5-5-5slope ?O-5slope ESSENTIAL QUESTION CHECK-IN9. If you know two points on a line, how can you find the rate of change ofthe variables being graphed?80Unit 25 Houghton Mifflin Harcourt Publishing Company7.
NameClassDate3.2 Independent PracticeCOMMONCOREPersonalMath Trainer8.F.4my.hrw.comOnlineAssessment andIntervention10. Rectangle EFGH is graphed on a coordinate plane with vertices atE(-3, 5), F(6, 2), G(4, -4), and H(-5, -1).a. Find the slopes of each side.b. What do you notice about the slopes of opposite sides?c. What do you notice about the slopes of adjacent sides?11. A bicyclist started riding at 8:00 A.M. The diagram below shows thedistance the bicyclist had traveled at different times. What wasthe bicyclist’s average rate of speed in miles per hour?8:00 A.M.4.5 miles8:18 A.M.7.5 miles8:48 A.M. Houghton Mifflin Harcourt Publishing Company12. Multistep A line passes through (6, 3), (8, 4), and (n, -2). Find the value of n.13. A large container holds 5 gallons of water. It begins leaking at a constantrate. After 10 minutes, the container has 3 gallons of water left.a. At what rate is the water leaking?b. After how many minutes will the container be empty?14. Critique Reasoning Billy found the slope of the line through the2 - (-2)points (2, 5) and (-2, -5) using the equation 25. What mistake5 - (-5)did he make?Lesson 3.281
15. Multiple Representations Graph parallelogramABCD on a coordinate plane with vertices at A(3, 4),B(6, 1), C(0, -2), and D(-3, 1).10y6a. Find the slope of each side.2-6b. What do you notice about the slopes?-2 O-226x10-6c. Draw another parallelogram on the coordinateplane. Do the slopes have the same characteristics?-10FOCUS ON HIGHER ORDER THINKINGWork Area16. Communicate Mathematical Ideas Ben and Phoebe are finding theslope of a line. Ben chose two points on the line and used them to findthe slope. Phoebe used two different points to find the slope. Did theyget the same answer? Explain.18. Reason Abstractly What is the slope of the x-axis? Explain.82Unit 2 Houghton Mifflin Harcourt Publishing Company17. Analyze Relationships Two lines pass through the origin. The lines haveslopes that are opposites. Compare and contrast the lines.
LESSON3.3?Interpreting the UnitRate as SlopeCOMMONCORE8.EE.5Graph proportionalrelationships, interpreting theunit rate as the slope of thegraph. Compare two differentproportional relationshipsrepresented in different ways.Also 8.F.2, 8.F.4ESSENTIAL QUESTIONHow do you interpret the unit rate as slope?EXPLORE ACTIVITYCOMMONCORE8.EE.5, 8.F.4Relating the Unit Rate to SlopeA rate is a comparison of two quantities that have different units, such asmiles and hours. A unit rate is a rate in which the second quantity in thecomparison is one unit.A Find the slope of the graph using thepoints (1, 2) and (5, 10). Remember thatthe slope is the constant rate of change.Misty Mountain StormSnowfall (in.)A storm is raging on Misty Mountain. The graphshows the constant rate of change of the snowlevel on the mountain.105 Houghton Mifflin Harcourt Publishing Company Image Credits: Cavan Images/Getty ImagesO510Time (h)B Find the unit rate of snowfall in inches per hour. Explain your method.C Compare the slope of the graph and the unit rate of change in thesnow level. What do you notice?D Which unique point on this graph can represent the slope of the graph andthe unit rate of change in the snow level? Explain how you found the point.Lesson 3.383
Graphing Proportional RelationshipsMath On the SpotYou can use a table and a graph to find the unit rate and slope that describea real-world proportional relationship. The constant of proportionality for aproportional relationship is the same as the slope.my.hrw.comEXAMPLE 1COMMONCORE8.EE.5Every 3 seconds, 4 cubic feet of water pass over a dam. Draw a graphof the situation. Find the unit rate of this proportional relationship.Make a table.Time (s)3Volume (ft )AnimatedMathSTEP 2my.hrw.comSTEP 3Math TalkIn a proportional relationship,how are the constant ofproportionality, the unit rate,and the slope of the graphof the relationshiprelated?69121548121620Water Over the DamDraw a graph.Find the slope.8riseslope run 6Mathematical Practices3 43Amount (cu ft)STEP 1208106O1020Time (sec)The unit rate of water passing over the dam and the slope of thegraph of the relationship are equal, 43 cubic feet per second.ReflectWhat If? Without referring to the graph, how do you know that thepoint ( 1, 43 ) is on the graph?YOUR TURNPersonalMath TrainerOnline Assessmentand Interventionmy.hrw.com84Unit 2Tomas rides his bike at a steady rate of2 miles every 10 minutes. Graph the situation.Find the unit rate of this proportionalrelationship.Tomas’s Ride10Distance (mi)2.5O5Time (min)10 Houghton Mifflin Harcourt Publishing Company1.
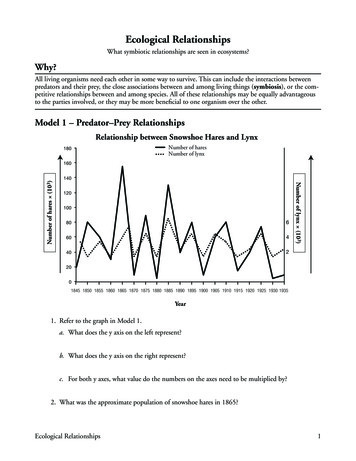
Using Slopes to Compare Unit RatesYou can compare proportional relationships presented in different ways.EXAMPL 2EXAMPLECOMMONCOREQuantity (barrels)STEP 2Amount (barrels)Well B Pumping RateUse the equation y 2.75x to makea table for Well A’s pumping rate, inbarrels per hour.Time (h)Math On the Spotmy.hrw.comThe equation y 2.75x represents the rate, inbarrels per hour, that oil is pumped from Well A.The graph represents the rate that oil is pumpedfrom Well B. Which well pumped oil at a faster rate?STEP 18.EE.5, 8.F.212342.755.58.25112010O1020Time (h)Use the table to find the slope of the graph of Well A.- 2.75 2.75 2.75 barrels/hourslope unit rate 5.512-1STEP 3Use the graph to find the slope of the graph of Well B.rise10slope unit rate run 4 2.5 barrels/hour Houghton Mifflin Harcourt Publishing Company Image Credits: Tom McHugh/Photo Researchers, Inc.STEP 4Compare the unit rates.2.75 2.5, so Well A’s rate, 2.75 barrels/hour, is faster.Reflect3.Describe the relationships among the slope of the graph of Well A’s rate,the equation representing Well A’s rate, and the constant of proportionality.YOUR TURN4.The equation y 375x represents the relationship between x, the timethat a plane flies in hours, and y, the distance the plane flies in miles forPlane A. The table represents the relationship for Plane B. Find the slopeof the graph for each plane and the plane’s rate of speed. Determinewhich plane is flying at a faster rate of speed.Time (h)Distance (mi)123442585012751700PersonalMath TrainerOnline Assessmentand Interventionmy.hrw.comLesson 3.385
Guided PracticeGive the slope of the graph and the unit rate. (Explore Activity and Example 1)1. Jorge: 5 miles every 6 hours2. AkikoJorge481216Distance (mi)5101520Akiko10O10Distance (mi)Distance (mi)20Time (h)20Time (h)2010O1020Time (h)3. The equation y 0.5x represents the distance Henry hikes, in miles,over time, in hours. The graph represents the rate that Clark hikes.Determine which hiker is faster. Explain. (Example 2)ClarkDistance (mi)2010O?Time (x)1246Distance (y)153060905.Time (x)16324864Distance (y)6121824ESSENTIAL QUESTION CHECK-IN6. Describe methods you can use to show a proportional relationshipbetween two variables, x and y. For each method, explain how you canfind the unit rate and the slope.86Unit 220 Houghton Mifflin Harcourt Publishing CompanyWrite an equation relating the variables in each table. (Example 2)4.10Time (h)
NameClassDate3.3 Independent PracticeCOMMONCOREPersonalMath Trainer8.EE.5, 8.F.2, 8.F.4my.hrw.comOnlineAssessment andIntervention7. A Canadian goose migrated at a steady rate of 3 miles every 4 minutes.a. Fill in the table to describe the relationship.Time (min)4820Distance (mi)912b. Graph the relationship.c. Find the slope of the graph and describewhat it means in the context of thisproblem.Migration FlightDistance (mi)2010O1020Time (min)8. Vocabulary A unit rate is a rate in which thefirst quantity / second quantityin the comparison is one unit.9. The table and the graph represent the rate at which two machines arebottling milk in gallons per second.Machine 2Machine 1Time (s)Amount (gal)12340.61.21.82.4Amount (gal) Houghton Mifflin Harcourt Publishing Company2010O1020Time (sec)a. Determine the slope and unit rate of each machine.b. Determine which machine is working at a faster rate.Lesson 3.387
10. Cycling The equation y 19 x represents the distance y, in kilometers, thatPatrick traveled in x minutes while training for the cycling portion of atriathlon. The table shows the distance y Jennifer traveled in x minutes inher training. Who has the faster training rate?Time (min)40648096Distance (km)581012Work AreaFOCUS ON HIGHER ORDER THINKING11. Analyze Relationships There is a proportional relationship betweenminutes and dollars per minute, shown on a graph of printing expenses.The graph passes through the point (1, 4.75). What is the slope of thegraph? What is the unit rate? Explain.13. Critical Thinking The table showsthe rate at which water is beingpumped into a swimming pool.Time (min)25Amount (gal)36907126 216Use the unit rate and the amount of water pumped after 12 minutesto find how much water will have been pumped into the pool after13 12 minutes. Explain your reasoning.88Unit 212 Houghton Mifflin Harcourt Publishing Company12. Draw Conclusions Two cars start at the same time and travel at differentconstant rates. A graph for Car A passes through the point (0.5, 27.5), anda graph for Car B passes through (4, 240). Both graphs show distance inmiles and time in hours. Which car is traveling faster? Explain.
MODULE QUIZReadyPersonalMath Trainer3.1 Representing Proportional Relationships1. Find the constant of proportionalityfor the table of values.Online Assessmentand Interventionmy.hrw.comx2345y34.567.52. Phil is riding his bike. He rides 25 miles in 2 hours,37.5 miles in 3 hours, and 50 miles in 4 hours.Find the constant of proportionality and write anequation to describe the situation.3.2 Rate of Change and SlopeFind the slope of each line.3.y4.y4422xx-4-2O24-4-2O-2-2-4-424 Houghton Mifflin Harcourt Publishing Company3.3 Interpreting the Unit Rate as Slope5. The distance Train A travels is represented byTime (hours) Distance (km)d 70t, where d is the distance in kilometers and2150t is the time in hours. The distance Train B travels4300at various times is shown in the table. What is the5375unit rate of each train? Which train is going faster?ESSENTIAL QUESTION6. What is the relationship among proportional relationships, lines, rates ofchange, and slope?Module 389
MODULE 3 MIXED REVIEWPersonalMath TrainerAssessmentReadinessmy.hrw.com5. What is the slope of the line below?Selected Responsey1. Which of the following is equivalent to 5–1?C2D -5x2. Prasert earns 9 an hour. Which tablerepresents this proportional relationship?AHoursEarnings ( )436654872BHoursEarnings ( )436645854CHoursEarnings ( )29318427DHoursEarnings ( )2183274543. A factory produces widgets at a constantrate. After 4 hours, 3,120 widgets havebeen produced. At what rate are thewidgets being produced?A 630 widgets per hourB 708 widgets per hourC4- 15780 widgets per hourD 1,365 widgets per hour4. A full lake begins dropping at a constantrate. After 4 weeks it has dropped 3 feet.What is the unit rate of change in the lake’slevel compared to its full level?A 0.75 feet per week-4-2D 1.33 feet per week12C1B -2D 26. Jim earns 41.25 in 5 hours. Susan earns 30.00 in 4 hours. Pierre’s hourly rate is lessthan Jim’s, but more than Susan’s. What ishis hourly rate?A 6.50CB 7.75D 8.25 7.35Mini-Task7. Joelle can read 3 pages in 4 minutes,4.5 pages in 6 minutes, and 6 pages in8 minutes.a. Make a table of the data.MinutesPagesb. Use the values in the table to find theunit rate.c. Graph the relationship betweenminutes and pages read.y642Ox246Minutes90Unit 24A -2Pages 0.75 feet per week2-2B 1.33 feet per weekCO Houghton Mifflin Harcourt Publishing CompanyA 41B5OnlineAssessment andIntervention
my.hrw.com Math On the Spot 3 Get immediate feedback and help as you work through practice sets. Personal Math Trainer Interactively explore key concepts to see how math works. Animated Math Go digital with your write-in student edition, accessible on any device. Scan with your smart phon