Transcription
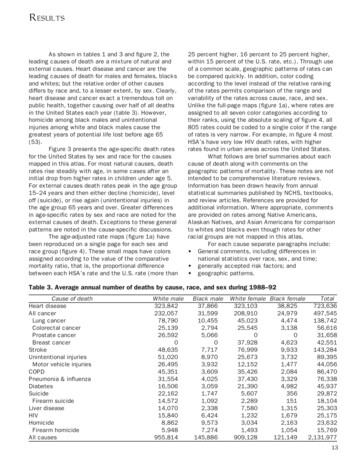
As shown in tables 1 and 3 and figure 2, theleading causes of death are a mixture of natural andexternal causes. Heart disease and cancer are theleading causes of death for males and females, blacksand whites; but the relative order of other causesdiffers by race and, to a lesser extent, by sex. Clearly,heart disease and cancer exact a tremendous toll onpublic health, together causing over half of all deathsin the United States each year (table 3). However,homicide among black males and unintentionalinjuries among white and black males cause thegreatest years of potential life lost before age 65(53).Figure 3 presents the age-specific death ratesfor the United States by sex and race for the causesmapped in this atlas. For most natural causes, deathrates rise steadily with age, in some cases after aninitial drop from higher rates in children under age 5.For external causes death rates peak in the age group15–24 years and then either decline (homicide), leveloff (suicide), or rise again (unintentional injuries) inthe age group 65 years and over. Greater differencesin age-specific rates by sex and race are noted for theexternal causes of death. Exceptions to these generalpatterns are noted in the cause-specific discussions.The age-adjusted rate maps (figure 1a) havebeen reproduced on a single page for each sex andrace group (figure 4). These small maps have colorsassigned according to the value of the comparativemortality ratio, that is, the proportional differencebetween each HSA’s rate and the U.S. rate (more than25 percent higher, 16 percent to 25 percent higher,within 15 percent of the U.S. rate, etc.). Through useof a common scale, geographic patterns of rates canbe compared quickly. In addition, color codingaccording to the level instead of the relative rankingof the rates permits comparison of the range andvariability of the rates across cause, race, and sex.Unlike the full-page maps (figure 1a), where rates areassigned to all seven color categories according totheir ranks, using the absolute scaling of figure 4, all805 rates could be coded to a single color if the rangeof rates is very narrow. For example, in figure 4 mostHSA’s have very low HIV death rates, with higherrates found in urban areas across the United States.What follows are brief summaries about eachcause of death along with comments on thegeographic patterns of mortality. These notes are notintended to be comprehensive literature reviews.Information has been drawn heavily from annualstatistical summaries published by NCHS, textbooks,and review articles. References are provided foradditional information. Where appropriate, commentsare provided on rates among Native Americans,Alaskan Natives, and Asian Americans for comparisonto whites and blacks even though rates for otherracial groups are not mapped in this atlas.For each cause separate paragraphs include: General comments, including differences innational statistics over race, sex, and time; generally accepted risk factors; and geographic patterns.Table 3. Average annual number of deaths by cause, race, and sex during 1988–92Cause of deathHeart diseaseAll cancerLung cancerColorectal cancerProstate cancerBreast cancerStrokeUnintentional injuriesMotor vehicle injuriesCOPDPneumonia & influenzaDiabetesSuicideFirearm suicideLiver diseaseHIVHomicideFirearm homicideAll causesWhite 625,948955,814Black White female Black 15,769909,128121,1492,131,97713
Cause of deathHeart diseaseAll cancerLung cancerColorectal cancerWhite maleProstate cancerBlack maleWhite femaleBreast cancerBlack femaleStrokeUnintentional injuriesMotor vehicle injuriesCOPDPneumonia & influenzaDiabetesSuicideFirearm suicideLiver diseaseHIVHomicideFirearm homicide050100150200Rate per 100,000 populationSOURCE: CDC/NCHS14250300
Heart diseaseRate10,0001,000101000.1100.010.10Colorectal cancerRate10,0002040Age6080Prostate cancer1,000100Rate1,0002040Age6080Breast 00101Rate1,000Lung cancerRate1,0001001,000White maleBlack maleWhite femaleBlack femaleAll cancerRate10,0002040Age6080Motor 6080Pneumonia& te1000.110Rate1002040Age6080Firearm Firearm 2040Age60806080Liver disease2040Age6080100.10.140AgeAll causesRate100,0001000.102002040Age6080NOTE: For plotting purposes, rates equal to 0 are shown as 0.001 per 100,000 population.SOURCE: CDC/NCHS02040Age608015
Heart diseaseAll cancerLung cancerColorectal cancerProstate cancerStrokeUnintentional injuriesMotor vehicle injuriesCOPDPneumonia & influenzaDiabetesSuicideFirearm suicideLiver diseaseHIVHomicideFirearm homicideComparative mortalityratio (HSA to U.S.) 1.251.16 – 1.250.85 – 1.150.75 – 0.84 0.7516SOURCE: CDC/NCHS
Heart diseaseAll cancerLung cancerColorectal cancerProstate cancerStrokeUnintentional injuriesMotor vehicle injuriesCOPDPneumonia & influenzaDiabetesSuicideFirearm suicideLiver diseaseHIVHomicideFirearm homicideComparative mortalityratio (HSA to U.S.) 1.251.16 – 1.250.85 – 1.150.75 – 0.84 0.75SOURCE: CDC/NCHS17
Heart diseaseAll cancerLung cancerColorectal cancerBreast cancerStrokeUnintentional injuriesMotor vehicle injuriesCOPDPneumonia & influenzaDiabetesSuicideFirearm suicideLiver diseaseHIVHomicideFirearm homicideComparative mortalityratio (HSA to U.S.) 1.251.16 – 1.250.85 – 1.150.75 – 0.84 0.7518SOURCE: CDC/NCHS
Heart diseaseAll cancerLung cancerColorectal cancerBreast cancerStrokeUnintentional injuriesMotor vehicle injuriesCOPDPneumonia & influenzaDiabetesSuicideFirearm suicideLiver diseaseHIVHomicideFirearm homicideComparative mortalityratio (HSA to U.S.) 1.251.16 – 1.250.85 – 1.150.75 – 0.84 0.75SOURCE: CDC/NCHS19
Although death rates have declined for over 30years (54), heart disease remains the leading causeof death in the United States (53). Two-thirds of alldeaths coded to this cause of death are specified asischemic (or coronary) heart disease. Death ratesfrom all diseases of the heart have been consistentlyhigher for blacks than for whites for at least 40 years,with greater differences in recent years due to a morerapid drop in rates among whites (55). Hispanics,American Indians/Alaskan Natives, and Asians havelower rates than blacks or whites (53). Rates forwomen are 40 percent to 50 percent lower than thecorresponding male rates in each racial or ethnicgroup. For men and women, regardless of race, deathrates rise steadily with age, with lessening male/female and black/white differences in the older agegroups.Along with age, sex, and race, other strongpredictors of heart disease risk are cigarette smoking,high blood pressure, elevated serum cholesterol,physical inactivity, family history of heart disease,obesity, and diabetes (54, 56–59). Areas of currentepidemiologic research include the effects of diet (60)and exercise (61) and the possible protective effect ofestrogen therapy for postmenopausal women (62).The importance of these risk factors varies by age andsex and by the particular type of heart disease (63).Reductions in hospital discharges and hospitalizedcase fatality rates for heart disease patients point toimprovements in population risk factor levels andmedical care, for example, improved treatment ofheart attack patients and wide availability of coronaryartery bypass surgery, as partly responsible forcontinued reductions in death rates (64). However,over half of ischemic heart disease deaths amongwhite males during a recent period occurred out ofhospital or in emergency rooms; variation of thisproportion by urbanization level and State suggeststhat a lack of quick access to effective emergencymedical services is also a risk factor for death out ofhospital (65).In 1970 the highest heart disease death rateswere in the Middle Atlantic region, whereas all Stateswest of the Mississippi River had low rates (7). In thenortheastern regions, rates were highest inmetropolitan areas, but in the southeastern regions,nonmetropolitan areas had higher rates (66). Since1970 rates first declined more rapidly in thenortheastern United States than elsewhere,particularly in metropolitan areas, thus lesseningregional differences (65, 67, 68). Later, rates declined20in nonmetropolitan areas and in southeastern States(66, 67). This geographic difference in mortality timetrends resulted in a shift in the areas of highest ratesfrom northeastern to southeastern States, althoughrates are still declining in all regions. Thissoutheastern cluster of relatively high rates nowincludes areas west of the Mississippi River, whererates had been low in the past. A recent nationwidestudy showed a higher prevalence of self-reportedcurrent smoking in central cities across the UnitedStates for blacks and whites, with high rates amongwhites also noted in nonmetropolitan States in theSouth and West. The prevalence of high bloodpressure and low education was also high in thenonmetropolitan South (64).Age-adjusted death rates for all cancer sitescombined have changed little in the United Statessince the 1970’s (53), while incidence rates haveincreased approximately 1.3 percent per year (69).However, these summary rates mask increases forspecific types of cancer and decreases amongyounger persons that are attributed to improveddiagnostic and therapeutic procedures (70). Over thepast 20 years, overall incidence has increased atleast 2 percent per year for cancer of the liver andkidney, as well as for melanoma of the skin and nonHodgkin’s lymphoma, prostate and testicular canceramong men, and lung cancer among women (69).Death rates for these cancer sites have also risenover this time, except for a 6-percent per year declinein testicular cancer (69). Reductions in incidencerates of over 2 percent per year during this periodwere seen for cancers of the uterus and cervix and indeath rates for cancers of the stomach and uterinecervix and for Hodgkin’s disease (69). Female lungcancer death rates have risen so rapidly that this isnow the leading site of cancer mortality amongwomen. (However, breast cancer incidence rates aremore than double those of lung cancer (69), becauseof the high fatality rate among lung cancer patients.)Death rates from all cancers combined; cancers of theesophagus, uterine cervix, larynx, prostate, stomachand liver; and multiple myeloma are significantlyhigher in blacks (71); whereas whites experiencehigher rates of lymphomas; leukemias; and cancers ofthe ovary, brain, testis, and skin (69).The most prominent risk factor for cancerdevelopment is cigarette smoking, which has beenlinked not only to lung cancer, but also to cancers ofthe mouth, pharynx, larynx, esophagus, pancreas,
uterine cervix, kidney, and bladder (71). Alcoholconsumption in combination with smoking has beenimplicated in the development of cancers of the oralcavity, esophagus, and larynx (72). Studies of theinfluence of diet on cancer development have beeninconclusive, though a diet high in fat and low in fiber,fruits, or vegetables has been associated with anincreased risk for a number of cancers, includingbreast and colorectal cancer. Certain occupationalexposures have been linked to leukemia, nonHodgkin’s lymphoma, lung cancer, bladder cancer,and liver cancer, and exposures to high levels ofionizing radiation are associated with cancers of thebone marrow, breast, and thyroid (72). The role ofviruses, such as HIV and papilloma viruses, in thedevelopment of certain cancers is a topic of currentresearch (72). Recent research has identified specificgenetic abnormalities that may be responsible for apredisposition to breast and colorectal tumors (73, 74).The geographic patterns for all cancermortality reflect the patterns of death for leadingcancer sites, particularly lung cancer. The four sitesincluded in this atlas accounted for 54 percent of allcancer deaths during 1988–92.Lung cancer has been the leading cause ofcancer death in men since the 1950’s (71). In 1987lung cancer became the leading cause of cancerdeath in women, surpassing breast cancer (69).Between 1950 and 1990, death rates increased 3.5times among men and nearly 7 times among women(53), thus narrowing the gender gap in mortality forthis tumor. During 1988–92, lung cancer death ratesremained highest in black males, whose rates are 50percent higher than white males; rates for black andwhite women are nearly equal.The primary risk factor for lung cancer iscigarette smoking, an association demonstratedrepeatedly in epidemiological studies (75). Risk hasbeen shown to increase with the number of cigarettessmoked, the duration of smoking, an earlier age atonset of smoking, degree of inhalation, the tar andnicotine content, and the use of unfiltered cigarettes(75). Exposure to second-hand smoke; radon; andoccupational exposures to asbestos,bis(chloromethyl) ether, polycyclic aromatichydrocarbons, chromium, nickel, and inorganic arseniccompounds have also been shown to increase lungcancer risk (71, 75).In the 1950’s the highest lung cancer rates forwhite males were in northeastern urban areas andport cities along the Atlantic and Gulf coasts (8).During the following 20 years, increasingly clusteredareas of high rates appeared in the East South Centraland South Atlantic-South regions, particularly alongthe Mississippi River (8). Case-control studiesidentified differences in smoking patterns andexposure to asbestos through shipyard employment aspotential explanations for these geographicdifferences (8). From 1950 to 1970, patterns of lungcancer rates for white females were similar to earlierwhite male patterns, but a cluster of high ratesappeared in Pacific States during the 1970’s (8).During this time high rates for blacks were limited tourban centers in the Middle Atlantic and East NorthCentral regions (9). The new maps for 1988–92 showpatterns of even stronger geographic concentrationamong whites, with high male rates now extendingalong the Ohio River into the South Atlantic-North andEast North Central regions. Rates for black males arehighest in the South Atlantic and East South Centralregions. The western cluster of high rates amongwhite females now encompasses the entire Pacificregion and portions of the Mountain regions; thiswestern excess is most pronounced for the olderages, whereas higher rates in the East South Central,South Atlantic-South and New England regions aremore notable for the younger age group.From 1973 to 1992, incidence and mortalityrates for colorectal cancer have increased byapproximately 1 percent per year among blacks, whilerates among whites have declined slightly (69).Improved survival rates are attributed to earlierdetection due to improvements in diagnostic tests(76). From 1980 to 1992, black males experiencedthe highest death rates from colorectal cancer (53),though the incidence rates for white and black malesare similar (76). Women are at a slightly lower risk ofdeveloping colorectal cancer (76).In addition to age, race and sex, family orpersonal history of cancer or colorectal polyps, andinflammatory bowel disease are risk factors forcolorectal cancer (71). Recent advances in identifyingcancer susceptibility genes suggest that 10 percentof colorectal cancer cases are due to an inheritedpredisposition (73, 74). A number of studies havedemonstrated that a high-fat, low-fiber diet can lead tothe development of colorectal cancer, which couldexplain the 20- to 50-percent lower risk amongMormons and Seventh-Day Adventists, groups whichobserve certain dietary restrictions and refrain from21
using alcohol and tobacco products (77). Withincreasing availability of methods of screening forcolorectal cancer in asymptomatic patients (71),access to and utilization of these medical proceduresmay play a role in mortality patterns in the future.Since the 1950’s colorectal cancer deathrates have been highest for blacks and whites in themore densely populated areas of the northeasternStates, although regional differences have diminishedover time (8, 9). For 1988–92 age-adjusted ratesremain higher in the northeast (New England, MiddleAtlantic, East North Central, and South Atlantic-Northregions) but the age-specific maps show relativelyhigher rates among younger whites in South Centraland South Atlantic States, although rates in this agegroup vary little across the United States.Prostate cancer death rates have increasedslowly from 14.4 deaths per 100,000 population in1980 to 16.6 deaths per 100,000 population during1992 (53). Incidence rates have increased morerapidly, rising 50 percent over this period (71). Thisrapid rise in incidence is attributed to improveddiagnostic techniques that may be identifying tumorsthat will never become life threatening (71). BlackAmerican men have the highest prostate cancerincidence, and possibly mortality, in the world (71).Their death rates are twice those of white Americanmen (78). Prostate cancer is primarily a disease ofolder men, with over 80 percent of all diagnosesoccurring over age 65 (71). Autopsy studies haveestimated that 30 percent of men over age 50 havelatent carcinoma of the prostate (79).Very little is known about the etiology ofprostate cancer, although age and race arerecognized as major risk factors (71, 79). Otherproposed risk factors include high circulatingandrogen levels (80), genetic predisposition to thedisease (78), and dietary factors such as vitamin Ddeficiency (80) and high fat and vitamin A intake(79). Increased risk may be associated with exposureto cadmium and employment in agricultural, nitratefertilizer, or ferrochromium industries (79). Otherstudies have suggested that a history of venerealdisease or multiple sex partners also increases therisk of prostate cancer (78).Scattered areas of high rates for white maleshave been noted previously in rural sections of thenorthern States (8). In the 1970’s an apparentclustering of high black male death rates emerged inthe Carolinas and central Florida (9). The 1988–9222maps for the older ages confirm these patterns forwhite and black men. Higher rates among youngermen are seen along the Atlantic coast, but rates forthis age group are extremely low.In the United States, death rates for breastcancer have been stable for the past 50 years, evenas incidence rates have increased (71). Before 1980white women had slightly higher age-adjusted deathrates than black women, but since then death ratesfor black women have increased 16 percent,surpassing rates for white women, which decreased 5percent over the same period (53). Breast cancerincidence and death rates increase with age, but therate of increase slows after menopause (81). Amongpremenopausal women, breast cancer incidence ishigher in blacks (81).Two well-established risk factors for breastcancer are personal history of breast, endometrial, orovarian cancer and family history of breast cancer(82). The recent identification of genetic mutationslinked to early onset breast cancer may explain atleast part of this familial aggregation (73). Older age,higher socioeconomic status, and never having beenmarried have been associated with increased risk ofbreast cancer (82). Other established risk factorsinclude exposure to high doses of ionizing radiation;certain breast tissue abnormalities; and factorsrelated to reproductive history such as early onset offirst menarche, late onset of menopause, late age offirst full-term pregnancy or nulliparity (83). The effectsof alcohol consumption, oral contraceptive use,postmenopausal estrogen therapy, diet, and pesticideexposure are still being considered (82–84). As manyas 70 percent of women diagnosed with breast cancermay not have any identifiable risk factor (83).Between 1950 and 1980, the highest breastcancer death rates for white and black women werefound in the urban areas of the New England andMiddle Atlantic regions, although the north-southdifferences diminished over this period (8, 9). Highrates for postmenopausal white females wereconcentrated in the urban areas of these northeasternStates, but much of this excess can be explained byregional differences of recognized risk factors (85);premenopausal rates varied little by region (8). Acomparison of the age-specific and age-adjusted mapsfor 1988–92 shows that the higher age-adjusted ratesin the northeast are still predominantly due togeographic differences among older white women. Themap for younger ages shows an east-to-west decline
in rates, but the range of rates is very narrow. Highrates among black females appear to be scatteredacross the southern States for both age groups.In the United States, the death rate forcerebrovascular diseases (stroke) has steadilydeclined since about 1900 (86). Even so, strokeremains a leading cause of death, ranking third behindheart disease and all cancer for white and blackwomen, fourth for white men, and fifth for black men.About 75 percent of strokes are ischemic (a blockageof cerebral blood vessels) rather than hemorrhagic (aruptured blood vessel) (54). Sharp declines inischemic stroke death rates are responsible for thedownward trend in overall rates (56), although overhalf of the stroke deaths during 1988–92 were notcoded to a specific type. Death rates for men havebeen higher than those for women since the 1950’s,though the gender gap narrowed in the 1980’s (86).During 1988–92 the age-adjusted death rate forstroke among blacks was twice that among whites formales and females, with the greatest racial disparitiesseen in the younger age groups (87). Rates amongnon-Hispanic whites and Asians were nearly equalduring 1988–92, with rates among Hispanics andAmerican Indians/Alaskan Natives somewhat lower(53). Hospitalization rates for stroke have remainedstable over the period of declining mortality, althoughregional differences in these rates reflect those ofmortality (87), suggesting that improvements indiagnosis and in prevention and treatment ofassociated medical conditions may have contributedto the reduction in mortality.Risk factors for stroke vary somewhataccording to the type of stroke in question (88), butone-third of all strokes may be attributed to a medicalhistory of hypertension, diabetes, elevated hemoglobinlevels, or prior heart disease (56). Other importantrisk factors for ischemic stroke include age, sex, race,genetic predisposition, cigarette smoking, obesity,elevated blood cholesterol and lipids, excess alcoholconsumption, use of oral contraceptives, a history oftransient ischemic attacks, and physical inactivity(54, 89, 90). At one time characteristics of soil anddrinking water were suspected as risk factors forstroke, but the changing geographic patterns ofstroke mortality are inconsistent with thesehypotheses (91). Geographic and temporal differencesin stroke mortality are now thought to be real, not anartifact of certification differences (92), and due tomultiple individual, rather than community, factors (91).Over 40 years ago, a cluster of areas with highstroke mortality was identified in the South AtlanticSouth region, which became known as the “StrokeBelt” (91). Over time rates have declined faster in thisregion than others, lessening regional differences(92). Although rates remain high along the southAtlantic coast, the “Stroke Belt” appears to bedispersing as a consequence of regional differences intime trends, with clusters of relatively high rate areasseen more to the north and west of the originalcluster (7, 91, 93). For example, the maps for 1988–92 show that age-adjusted rates in the East SouthCentral and West South Central regions are relativelyhigh for whites and blacks. If the geographicdifferences noted in the smoothed maps by age grouprepresent a cohort effect, high rates will continue tomove westward. Little information is available aboutgeographic patterns of risk factors for stroke, but arecent nationwide study showed self-reportedhypertension and smoking to be high in thenonmetropolitan south (South Atlantic and SouthCentral regions) (64). It is interesting to note somelocal exceptions to these regional trends, notably inretirement destinations. A study of stroke mortality byState of birth and death suggests that persons whoretire to other regions retain the stroke risk of theirStates of origin; hence white retirees from the MiddleAtlantic region may lower the total stroke death ratein Florida, compared to higher rates seen among whiteand black native Floridians (94).Death rates due to unintentional injuries havebeen decreasing among both sexes and all racessince 1970 (53). Death rates from all unintentionalinjuries peak at ages 15–24 years, then rise againafter age 60; in fact, unintentional injury was theleading cause of death for each age group from 1–4years to 25–44 years in 1992 (53). For 1988–92nearly half of these deaths were motor vehicle-related,but falls were the leading cause of unintentional injurydeath among older persons. Death rates among maleswere nearly three times those of females. NativeAmericans have the highest overall death rates due tounintentional injuries, and rates among blacks aresomewhat higher than those among whites (53).Age is the predominant risk factor for deathdue to unintentional injury. The very young,particularly males, are prone to unintentional injuriesbecause their lack of knowledge and experience leadsthem to engage in high-risk behavior (95). The risk ofsustaining a fatal injury increases with exposure to23
potentially fatal materials, such as poisonoussubstances, or events, such as a dangerous workenvironment. The use of alcohol is a risk factor formany types of unintentional injuries such asdrownings and motor vehicle crashes (96). Elevateddeath rates among older persons are attributed totheir diminishing physical capacity, which leads to ahigher frequency of accidents, a higher likelihood ofsustaining an injury in the accident, and greaterdifficulty recovering from the injury (95).The highest unintentional injury death rates areseen in the East South Central region for whites andthe South Atlantic-South region for blacks, withscattered high-rate areas in the western States. Ratesare higher in rural than in urban areas (12, 95). Seecautionary note in “Amended data” section under“Causes of death.”Rates of death due to motor vehicle injurieshave declined to 42 percent of the 1970 U.S. rate(53). This improvement has been attributed tosuccessful public awareness and educationcampaigns, legal interventions, improved vehicle andequipment designs, roadways, and emergency medicaland trauma care (97). Despite these improvements,motor vehicle injury remains one of the leading causesof death among young adults. Motor vehicle deathrates are nearly three times higher among males thanamong females (53). Native Americans have deathrates about twice those for whites or blacks (97).Factors that have been associated with motorvehicle fatalities include alcohol and drug use, riskdenial and aggressive behavior, young or old age,and characteristics of the vehicle and roadways(95).Motor vehicle-related death rates have beenhigher in the southeastern States and in scatteredwestern areas (12, 95, 97). Motor vehicle death ratesare higher in nonmetropolitan than metropolitan areas.The age-specific maps for 1988–92 showconsistently high rates in the East South Central andSouth Atlantic-South regions, especially amongyoung adults, but the location of high-rate areas inthe west vary by race and sex. See cautionary note in“Amended data” section under “Causes of death.”U.S. age-adjusted death rates for chronicobstructive pulmonary diseases (COPD) increased24from 1950 until 1988, after which rates remainedrelatively stable (53). Between 1980 and 1992, deathrates increased among older age groups, while amongthe younger age cohorts death rates remained stableor declined (53). Since 1980 the largest increases indeath rates for COPD have been among females ( 76percent) and among black men ( 19 percent), but thehighest rates are still seen among white males (53).Overall, male death rates are about twice those offemales (53). This broad cause of death includesemphysema, asthma, and bronchitis, but less than 30percent of deaths attributed to COPD during 1988–92were coded to these specific causes.Cigarette smoking and coal dust exposure areestablished risk factors for COPD (98). Otheroccupational dust and fume exposures, childhood lungdisease, passive cigarette smoke exposure, prenatalcigarette smoke exposure (99), and lowsocioeconomic status as related to poor housing (98)are suggested risk factors. Familial aggregation ofCOPD has been noted, but it is not clear whether thisis due to genetic predisposition or to sharedenvironmental factors, such as dust or passivesmoking (99).Age-adjusted death rates are highest in theMountain regions for whites and the South Atlanticregions for blacks. Rates are also high in other areasdepending on race, sex, and age; for example, ratesamong older white males are high in the East SouthCentral region, similar to patterns for lung cancerdeath rates. Patterns on these maps resemble thoseseen on earlier maps of emphysema (7), although caremust be taken
25 percent higher, 16 percent to 25 percent higher, within 15 percent of the U.S. rate, etc.). Through use of a common scale, geographic patterns of rates can be compared quickly. In addition, color coding according to the level instead of the relative