Transcription
IRENA woRkINgg ppAApERIRENAInternational Renewable Energy AgencyRENEWABLE ENERGY TECHNOLOGIES: COST ANALYSIS SERIESVolume 1: Power SectorIssue 5/5Wind PowerJune 2012
Copyright (c) IRENA 2012Unless otherwise indicated, material in this publication may be used freely, shared or reprinted,but acknowledgement is requested.About IRENAThe International Renewable Energy Agency (IRENA) is an intergovernmental organisation dedicatedto renewable energy.In accordance with its Statute, IRENA's objective is to "promote the widespread and increasedadoption and the sustainable use of all forms of renewable energy". This concerns all forms ofenergy produced from renewable sources in a sustainable manner and includes bioenergy,geothermal energy, hydropower, ocean, solar and wind energy.As of May 2012, the membership of IRENA comprised 158 States and the European Union (EU), outof which 94 States and the EU have ratified the Statute.AcknowledgementThis paper was prepared by the IRENA Secretariat. The paper benefitted from an internal IRENAreview, as well as valuable comments and guidance from Stefan Gsänger (WWEA), Steve Sawyer(GWEC) and Cassia Simons Januario (VESTAS).For further information or to provide feedback, please contact Michael Taylor, IRENA Innovationand Technology Centre, Robert-Schuman-Platz 3, 53175 Bonn, Germany; MTaylor@irena.org.This working paper is available for download from www.irena.org/PublicationsDisclaimerThe designations employed and the presentation of materials herein do not imply the expressionof any opinion whatsoever on the part of the Secretariat of the International Renewable EnergyAgency concerning the legal status of any country, territory, city or area or of its authorities, or concerning the delimitation of its frontiers or boundaries. The term “country” as used in this materialalso refers, as appropriate, to territories or areas.
PrefaceRenewable power generation can help countries meet their sustainable developmentgoals through provision of access to clean, secure, reliable and affordable energy.Renewable energy has gone mainstream, accounting for the majority of capacityadditions in power generation today. Tens of gigawatts of wind, hydropower andsolar photovoltaic capacity are installed worldwide every year in a renewable energymarket that is worth more than a hundred billion USD annually. Other renewable powertechnology markets are also emerging. Recent years have seen dramatic reductions inrenewable energy technologies’ costs as a result of R&D and accelerated deployment.Yet policy-makers are often not aware of the latest cost data.International Renewable Energy Agency (IRENA) Member Countries have asked forbetter, objective cost data for renewable energy technologies. This working paper aimsto serve that need and is part of a set of five reports on wind, biomass, hydropower,concentrating solar power and solar pholtovoltaics that address the current costs ofthese key renewable power technology options. The reports provide valuable insightsinto the current state of deployment, types of technologies available and their costs andperformance. The analysis is based on a range of data sources with the objective ofdeveloping a uniform dataset that supports comparison across technologies of differentcost indicators - equipment, project and levelised cost of electricity – and allows fortechnology and cost trends, as well as their variability to be assessed.The papers are not a detailed financial analysis of project economics. However, they doprovide simple, clear metrics based on up-to-date and reliable information which can beused to evaluate the costs and performance of different renewable power generationtechnologies. These reports help to inform the current debate about renewable powergeneration and assist governments and key decision makers to make informeddecisions on policy and investment.The dataset used in these papers will be augmented over time with new project costdata collected from IRENA Member Countries. The combined data will be the basis forforthcoming IRENA publications and toolkits to assist countries with renewable energypolicy development and planning. Therefore, we welcome your feedback on the dataand analysis presented in these papers, and we hope that they help you in your policy,planning and investment decisions.Dolf GielenDirector, Innovation and Technology
ContentsKEY FINDINGSiLIST OF TABLES AND FIGURESii1. INTRODUCTION11.1 Different measures of cost and data limitations1.2 Levelised cost of electricity generation2. WIND POWER TECHNOLOGIES AND RESOURCES42.1 Wind turbine and wind farm designs2.1.1 Onshore wind power technologies2.1.2 Offshore wind power technologies2.1.3 Small wind turbines2.2 The global wind energy resource3. GLOBAL WIND POWER MARKET TRENDS3.1 Total installed capacity3.2 Annual capacity additions3.3 Future projections of capacity growth124. CURRENT COST OF WIND POWER184.1. A breakdown of the installed capital cost for wind4.2 Total installed capital costs of wind power systems, 1980 to 20104.2.1 Wind turbine costs4.2.2 Grid connection costs4.2.3 Civil works and construction costs4.3 Operations and maintenance costs4.4 Total installed cost of wind power systems5. WIND POWER COST REDUCTION POTENTIALS355.1 Cost reduction potential by source5.2 Overall cost reduction potentials6. LEVELISED COST OF ELECTRICITY FROM WIND POWER426.1 Cost structure of large-scale wind farms6.1.1 The capital costs of onshore and offshore wind farms6.1.2 O&M costs of onshore and offshore wind farms6.2 Recent estimates of the LCOE of onshore and offshore wind6.3 LCOE estimates for 2011 to 2015REFERENCES52ACRONYMS55
Key findings1. Installed costs in 2010 for onshore wind farms were as low as USD 1 300 to USD 1 400/kW in Chinaand Denmark, but typically ranged between USD 1 800/kW and USD 2 200/kW in most other majormarkets. Preliminary data for the United States in 2011 suggests that wind turbine costs have peakedand that total costs could have declined to USD 2 000/kW for the full year (i.e. a reduction of USD150/kW compared to 2010). Wind turbines account for 64% to 84% of total installed costs onshore,with grid connection costs, construction costs, and other costs making up the balance. Offshorewind farms are more expensive and cost USD 4 000 to USD 4 500/kW, with the wind turbinesaccounting for 44% to 50% of the total cost.TABLE 1: TYPICAL NEW WIND FARM COSTS AND PERFORMANCE IN 2010Installed cost(2010 USD/kW)Capacity factor(%)Operations andmaintenance (USD/kWh)LCOE* (USD/kWh)OnshoreChina/India1 300 to 1 45020 to 30n.a.0.06 to 0.11Europe1 850 to 2 10025 to 350.013 to 0.0250.08 to 0.14North America2 000 to 2 20030 to 450.005 to 0.0150.07 to 0.114 000 to 4 50040 to 500.027 to 0.0480.14 to 0.19OffshoreEurope* Assumes a 10% cost of capital2. Operations and maintenance costs (O&M) can account for between 11% and 30% of an onshore windprojects levelised cost of electricity (LCOE). O&M costs for onshore wind farms in major wind marketsaverages between USD 0.01/kWh and USD 0.025/kWh. The O&M costs of offshore wind farms arehigher due to the difficulties posed by the offshore environment and can be between USD 0.027 andUSD 0.048/kWh. Cost reduction opportunities towards best practice levels exist for onshore windfarms, while experience offshore should help to reduce costs over time, but they will always be higherthan onshore.3. The levelised cost of electricity from wind varies depending on the wind resource and project costs,but at good wind sites can be very competitive. The LCOE of typical new onshore wind farms in2010 assuming a cost of capital of 10% was between USD 0.06 to USD 0.14/kWh. The higher capitalcosts offshore are somewhat offset by the higher capacity factors achieved, resulting in the LCOE ofan offshore wind farm being between USD 0.13 and USD 0.19/kWh assuming a 10% cost of capital.4. The potential for renewed cost reductions is good, as supply bottlenecks have been removed andincreased competition among suppliers will put downward pressure on prices in the next few years.Assuming that capital costs onshore decline by 7% to 10% by 2015, and O&M costs trend towardsbest practice, the LCOE of onshore wind could decline by 6% to 9%. The short-term cost reductionpotential for wind is more uncertain, but the LCOE of offshore wind could decline by between 8%and 10% by 2015.5. Inthe medium-to long-term, reductions in capital costs in the order of 10% to 30% could beachievable from learning-by-doing, improvements in the supply chain, increased manufacturingeconomies of scale, competition and more investment in R&D.Cost Analysis of Wind Poweri
List of tablesTable 2.1:Impact of turbine sizes, rotor diameters and hub heights on annual productionTable 2.2:offshore wind turbine foundation optionsTable 4.1:Comparison of capital cost breakdown for typical onshore and offshore wind power systems in developed countries, 201119Table 4.2:average wind turbine prices (real) by country, 2006 to 201022Table 4.3:o&M costs for onshore wind projects28Table 4.4:onshore wind power system installed costs for selected countries, 2003 to 201029Table 4.5:Capital cost structure of offshore wind power systems, 201034Table 5.1:Projected capital costs for small-scale wind farms (16 MW) with 2 MW turbines in the united Kingdom, 2011 to 204036Table 5.2:Summary of cost reduction opportunities for offshore wind40Table 5.3:Different estimates of the potential for cost reductions in the installed cost of onshore wind, 2011 to 205040Table 6.1:total installed costs for onshore wind farms in China/India, Europe and North america, 2010, 2011 and 201543Table 6.2:LCoE of wind at different capacity factors and discount rates5058List of figuresFigure 1.1: renewable power generation cost indicators and boundariesFigure 2.1: Growth in the size of wind turbines since 1985ii26Figure 2.2: World wind resource map11Figure 3.1: Global installed wind power capacity, 1996 to 201112Figure 3.2: the top ten countries by installed wind capacity, end-201113Figure 3.3: Global new wind power capacity additions, 1996 to 201114Figure 3.4: top ten countries by new wind power capacity additions in 201115Figure 3.5: Wind power projects partially commissioned, under construction or with financing secured (84.8 GW).16Figure 3.6: Projected growth in global wind power annual capacity additions and cumulative installed capacity, 2010 to 201517Figure 4.1: Capital cost breakdown for a typical onshore wind power system and turbine18Figure 4.2: Wind turbine price index by delivery date, 2004 to 201220Figure 4.3: reported wind turbine transaction prices in the united States, 1997 to 201221Figure 4.4: Wind turbine cost breakdown (5 MW offshore wind turbine)23Figure 4.5: Wind turbine cost in selected countries, 2008 and 201024Figure 4.6: Copper and steel prices, 1990 to 201025Figure 4.7: o&M costs for wind power projects in the united States, 1980 to 200826Figure 4.8: o&M costs in the united States by number of years since start of commercial operation27Figure 4.9: onshore wind power system installed cost for selected countries, 2007 to 201030Figure 4.10: Installed cost of wind power projects in the united States, 1982 to 201131Figure 4.11: average installed cost of wind power projects in the united States by project size, 2009 and 201031Figure 4.12: Installed cost of wind power projects in the united States by turbine size: 2009 and 201032Figure 4.13: the capacity-weighted average capacity factors for projects in the united States, 1999 to 201032Figure 4.14: Estimates of offshore wind power capital costs33Figure 5.1: Historical learning rate for wind turbines, 1984 to 201036Figure 6.1: the economics of wind systems42Figure 6.2: Capital cost breakdowns for typical onshore and offshore wind systems43Figure 6.3: Share of o&M in the total LCoE of wind power in seven countries44Figure 6.4: Wind power prices in the united States by start year, 1998/1999 to 201045Figure 6.5: Wind auction prices in brazil, 2009 to 201146Figure 6.6: Wind power LCoE trends for period from Q2 2009 to Q2 201147Figure 6.7: the LCoE of wind for typical European onshore wind farms, 2011 to 201548Figure 6.8: the LCoE of wind for typical North american onshore wind farms, 2011 to 201549Figure 6.9: the LCoE of wind for typical offshore wind farms, 2011 to 201551Cost Analysis of Wind Power
1. IntroductionRenewable energy technologies can help countries meet their policy goals for secure, reliable and affordableenergy to expand electricity access and promote development. This paper is part of a series on the costand performance of renewable energy technologies produced by IRENA. The goal of these papers is to assistgovernment decision-making and ensure that governments have access to up-to-date and reliable information onthe costs and performance of renewable energy technologies.Without access to reliable information on the relativecosts and benefits of renewable energy technologies,it is difficult, if not impossible, for governments toarrive at an accurate assessment of which renewableenergy technologies are the most appropriate for theirparticular circumstances. These papers fill a significantgap in information availability, because there is a lackof accurate, comparable, reliable and up-to-date dataon the costs and performance of renewable energytechnologies. The rapid growth in installed capacityof renewable energy technologies and the associatedcost reductions mean that even data one or two yearsold can significantly overestimate the cost of electricityfrom renewable energy technologies. There is also asignificant amount of perceived knowledge about thecost and performance of renewable power generationtechnologies that is not accurate or is misleading.Conventions on how to calculate cost can influence theoutcome significantly and it is imperative that these areclearly documented.1.1 DIFFErENt MEaSurES oF CoStaND Data LIMItatIoNSCost can be measured in a number of different ways, andeach way of accounting for the cost of power generationbrings its own insights. The costs that can be examinedinclude equipment costs (e.g. wind turbines, PV modules,solar reflectors, etc.), financing costs, total installed cost,fixed and variable operating and maintenance costs (O&M),fuel costs, and the levelised cost of energy (LCOE).The analysis of costs can be very detailed, but forcomparison purposes and transparency, the approachused here is a simplified version. This allows greaterscrutiny of the underlying data and assumptions,improving transparency and the confidence in theanalysis, as well as facilitating the comparison of costsby country or region for the same technologies in orderto identify what are the key drivers in any differences.The three indicators that have been selected are:The absence of accurate and reliable data on the costand performance of renewable power generationtechnologies is a significant barrier to the uptake ofthese technologies. Providing this information will helpgovernments, policy-makers, investors and utilities makeinformed decisions about the role renewable energy canplay in their power generation mix. This paper examinesthe fixed and variable cost components of wind power,by country and region and provides estimates of thelevelised cost of electricity from wind power given anumber of key assumptions. This up-to-date analysis ofthe costs of generating electricity from wind will allow afair comparison with other generating technologies.1»» Equipment cost (factory gate FOB anddelivered at site CIF);»» Total installed project cost, includingfixed financing costs2; and»» The levelised cost of electricity LCOE.The analysis in this paper focuses on estimating thecost of wind energy from the perspective of a privateinvestor, whether they are a state-owned electricitygeneration utility, an independent power producer, orIRENA, through its other work programmes, is also looking at the costs and benefits, as well as the macroeconomic impacts, of renewable powergeneration technologies. See WWW.IRENA.ORG for further details.2Banks or other financial institutions will often charge a fee, usually a percentage of the total funds sought, to arrange the debt financing of a project.These costs are often reported separately under project development costs.1Cost Analysis of Wind Power1
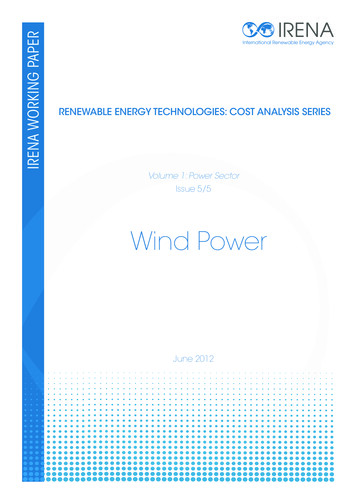
an individual or community looking to invest in smallscale renewables (Figure 1.1). The analysis is a pure costanalysis, not a financial one, and excludes the impact ofgovernment incentives or subsidies, taxation, systembalancing costs associated with variable renewables,and any system-wide cost savings from the meritorder effect.3 Similarly, the analysis doesn’t take intoaccount any CO2 pricing, nor the benefits of renewablesin reducing other externalities (e.g. reduced local airpollution, contamination of natural environments, etc.).Similarly, the benefits of renewables being insulatedfrom volatile fossil fuel prices have not been quantified.These issues and others are important, but are coveredby other programmes of work at IRENA.It is important to include clear definitions of thetechnology categories, where this is relevant, to ensurethat cost comparisons are robust and provide usefulinsights (e.g. off-shore wind vs. onshore wind PV).Similarly, it is important to differentiate between thefunctionality and/or qualities of the renewable powergeneration technologies being investigated. It isimportant to ensure that system boundaries for costsare clearly set and that the available data are directlycomparable. Other issues can also be important, suchas cost allocation rules for combined heat and powerplants, and grid connection costs and rules.An important point is that, although this paper tries toexamine costs, strictly speaking, the data available areactually prices, and not even true market average prices,but price indicators. The difference between costs andprices is determined by the amount above, or below, thenormal profit that would be seen in a competitive market.The rapid growth of renewables markets from a small basemeans that the market for renewable power generationtechnologies is rarely well-balanced. As a result, pricescan rise significantly above costs in the short-term ifsupply is not expanding as fast as demand, while in timesof excess supply, losses can occur and prices may bebelow production costs. This makes analysing the costof renewable power generation technologies challengingand every effort is made to indicate whether currentequipment costs are above or below their long-term trend.Project developmentSite preparationGrid connectionWorking capitalAuxiliary equipmentNon-commercial costTransport costImport leviesFactory gateEquipmentThe data used for the comparisons in this paper comefrom a variety of sources, such as business journals,industry associations, consultancies, governments,auctions and tenders. Every effort has been made toensure that these data are directly comparable and are forthe same system boundaries. Where this is not the case,the data have been corrected to a common basis usingthe best available data or assumptions. It is planned thatthis data will be complemented by detailed surveys of realworld project data in forthcoming work by the agency.On siteEquipmentProject costOperation &MaintenanceCost of financeResource qualityCapacity factorLife spanLCOELevelized cost of electricity(Discounted lifetime costdivided by discountedlifetime generation)FIGURE 1.1: RENEWABLE POWER GENERATION COST INDICATORS AND BOUNDARIES32See EWEA, Wind Energy and Electricity Prices, April 2010 for a discussion.Cost Analysis of Wind Power
The cost of equipment at the factory gate is often availablefrom market surveys or from other sources. A key difficultyis often reconciling different sources of data to identifywhy data for the same period differ. The balance of capitalcosts in total project costs tends to vary even more widelythan power generation equipment costs, as it is oftenbased on significant local content, which depends on thecost structure where the project is being developed. Totalinstalled costs can therefore vary significantly by project,country and region, depending on a wide range of factors.1.2 LeveLised costof eLectricity generationThe LCOE is the price of electricity required for a projectwhere revenues would equal costs, including makinga return on the capital invested equal to the discountrate. An electricity price above this would yield a greaterreturn on capital, while a price below it would yielder alower return on capital, or even a loss.The LCOE of renewable energy technologies varies bytechnology, country and project, based on the renewableenergy resource, capital and operating costs, and theefficiency/performance of the technology. The approachused in the analysis presented here is based on a simplediscounted cash flow (DCF) analysis.4 This method ofcalculating the cost of renewable energy technologies isbased on discounting financial flows (annual, quarterlyor monthly) to a common basis, taking into considerationthe time value of money. Given the capital intensivenature of most renewable power generation technologiesand the fact that fuel costs are low, or often zero, theweighted average cost of capital (WACC), also referredto as the discount rate in this report, used to evaluate theproject has a critical impact on the LCOE.There are many potential trade-offs to be consideredwhen developing an LCOE modelling approach. Theapproach taken here is relatively simple, given the factthat the model needs to be applied to a wide rangeof technologies in different countries and regions.However, this has the additional advantage of makingthe analysis transparent, easy to understand andallows clear comparisons of the LCOE of individualtechnologies across countries and regions, and betweentechnologies. The differences in LCOE can be attributedto project and technology performance, not differingmethodologies. More detailed LCOE analysis mayresult in more “accurate” absolute values, but resultsin a significantly higher overhead in terms of thegranularity of assumptions required and risks reducingtransparency. More detailed methodologies can oftengive the impression of greater accuracy, but when itis not possible to robustly populate the model withassumptions, or to differentiate assumptions based onreal world data, then the supposed “accuracy” of theapproach can be misleading.The formula used for calculating the LCOE of renewableenergy technologies is:LCOE Σnt 1ΣIt Mt Ft(1 r)tnt 1Et(1 r)tWhere:LCOE the average lifetime levelised cost of electricitygeneration;It investment expenditures in the year t;Mt operations and maintenance expenditures in theyear t;Ft fuel expenditures in the year t;Et electricity generation in the year t;r discount rate; andn economic life of the system.All costs presented in this paper are real 2010 USDunless otherwise stated;5 that is to say, after inflation hasbeen taken into account.6 The discount rate used in theanalysis, unless otherwise stated, is 10% for all projectsand technologies.As already mentioned, although different cost measuresare useful in different situations, the LCOE of renewableenergy technologies is a widely used measure bywhich renewable energy technologies can be evaluatedfor modelling or policy development. Similarly, moredetailed DCF approaches taking into account taxation,subsidies and other incentives are used by renewableenergy project developers to assess the profitability ofreal world projects.Including the impacts of subsidies, taxation and other factors that impact the financial viability of an individual project would lead to different results.Exchange rate fluctuations can have a significant impact on project costs depending on the level of local content. In an ideal world the local andimported cost components could be tracked separately and trends in each followed without the “noise” created by exchange rate fluctuations.6An analysis based on nominal values with specific inflation assumptions for each of the cost components is beyond the scope of this analysis. Projectdevelopers will develop their own specific cash-flow models to identify the profitability of a project from their perspective.45Cost Analysis of Wind Power3
2. Wind power technologiesand resourcesWind power technologies transform the kinetic energy of the wind into useful mechanical power. The kineticenergy of the air flow provides the motive force that turns the wind turbine blades that, via a drive shaft,provide the mechanical energy to power the generator in the wind turbine.7Wind and hydro power have been used by man sinceantiquity and they are the oldest large-scale sourceof power that has been used by mankind. However,the invention of the steam engine and its wide spreaddeployment in the nineteenth century allowed theindustrial revolution to occur by providing cheap, ondemand mechanical and then electrical energy, withthe possibility of taking advantage of the waste heatproduced as well. Their low cost and the fact they didnot depend on fickle winds or need to be located nextto a convenient water source allowed the great leapin productivity and incomes that stemmed from theIndustrial Revolution. Their success saw the importanceof wind energy decline dramatically, particularly in thetwentieth century.The modern era of wind power began in 1979 withthe mass production of wind turbines by Danishmanufacturers Kuriant, Vestas, Nordtank and Bonus.These early wind turbines typically had small capacities(10 kW to 30 kW) by today’s standards, but pioneeredthe development of the modern wind power industrythat we see today.The current average size of grid-connected wind turbinesis around 1.16 MW (BTM Consult, 2011), while most newprojects use wind turbines between 2 MW and 3 MW.Even larger models are available, for instance REPower’s5 MW wind turbine has been on the market for sevenyears. When wind turbines are grouped together, theyare referred to as “wind farms”. Wind farms comprise theturbines themselves, plus roads for site access, buildings(if any) and the grid connection point.Wind power technologies come in a variety of sizes andstyles and can generally be categorised by whether theyare horizontal axis or vertical axis wind turbines (HAWTand VAWT), and by whether they are located onshoreor offshore. The power generation of wind turbines isdetermined by the capacity of the turbine (in kW orMW), the wind speed, the height of the turbine and thediameter of the rotors.Most modern large-scale wind turbines have three bladesrotating around the horizontal axis (the axis of the driveshaft). These wind turbines account for almost all utilityscale wind turbines installed. Vertical-axis wind turbinesexist, but they are theoretically less aerodynamicallyefficient than horizontal-axis turbines and don’t have asignificant market share.8 In addition to large-scale designs,there has been renewed interest in small-scale windturbines, with some innovative design options developed inrecent years for small-scale vertical-axis turbines.Horizontal-axis wind turbines can be classified by theirtechnical characteristics, including:»» rotor placement (upwind or downwind);»» the number of blades;»» the output regulation system for thegenerator;»» the hub connection to the rotor (rigid orhinged; the so-called “teetering hub”);»» gearbox design (multi-stage gearboxwith high speed generator; singlestage gearbox with medium speedgenerator or direct drive withsynchronous generator);Wind turbine refers to the tower, blades, rotor hub, nacelle and the components housed in the nacelle.There are three vertical-axis wind turbine design concepts: the Gyro-turbine, the Savonius turbine and the Darrieus turbine. Only the Darrieus turbinehas been deployed at any scale (in Denmark in the 1970s). Today, they are used for small scale applications in turbulent environments, like cities. Someprototypes have been proposed for large-scale offshore applications in order to reduce installation and maintenance costs.784Cost Analysis of Wind Power
»» the rotational speed of the rotor tomaintain a constant frequency (fixed orcontrolled by power electronics); and»» wind turbine capacity.The turbine size and the type of wind power systemare usually related. Today’s utility-scale wind turbinegenerally has three blades, sweeps a diameter of about80 to 100 metres, has a capacity from 0.5 MW to 3 MWand is part of a wind farm of between 15 and as many as150 turbines that are connected to the grid.Small wind turbines are generally considered to bethose with generation capacities of less than 100 kW.These smaller turbines can be used to power remote oroff-grid applications such as homes, farms, refuges orbeacons. Intermediate-sized wind power systems (100kW to 250 kW) can power a village or a cluster of smallenterprises and can be grid-connected or off-grid. Theseturbines can be coupled with diesel generators, batteriesand other distributed energy sources for remote usewhere there is no access to the grid. Small-scale windsystems remain a niche application, but it is a marketsegment that is growing quickly.9 They are emerging asan important component of renewable electrificationschemes for rural communities in hybrid off-grid andmini-grid systems.The wind speed and electricity productionAs wind speed increases, the amount of available energyincreases, following a cubic function. Therefore, capacityfactors rise rapidly as the average mean wind speedincreases. A doubling of wind speed increases poweroutput of wind turbine by a factor of eight (EWEA,2009). There is, therefore, a significant incentive to sitewind farms in areas with high average wind speeds. Inaddition, the wind generally blows more consistently athigher speeds at greater heights. For instance, a fivefold increase in the height of a wind turbine above theprevailing terrain can result in twice
List of tables List of figures Table 2.1: Impact of turbine sizes, rotor diameters and hub heights on annual production 5 Table 2.2: offshore wind turbine foundation options 8 Table 4.1: Comparison of capital cost breakdown for typical onshore and offshore wind power systems in developed countries, 2011 19 Table 4.2: average wind