Transcription
Agents in their Midst:Evaluating User Adaptation to Agent-AssistedInterfacesTara Gustafson, J. Ben Schafer, Joseph KonstanDepartment of Computer ScienceUniversity of MinnesotaMinneapolis, MN 55455 USA 16126254002{tara, Schafer, konstan} @cs.umn.eduWe studied the acceptance of agents by the onlineproduction staff of a daily campus newspaper [5]. Twophases of user testing - with and without an agentassistance module - explored several broad-basedquestions.ABSTRACTThis paper presents the results of introducing an agent intoa real-world work situation - production of the onlineedition of a daily newspaper. Quantitative results showthat agents helped users accomplish the task more rapidlywithout increasing user error and that users consistentlyunderestimated the quality of their own performance.Qualitative results show that users accepted agents rapidlyand that they unknowingly altered their working styles toadapt to the agent.lllKeywordsHow do user’s perceptions of efficiency and accuracycompare with reality?Can a successful agent be designed for this domain?BACKGROUNDThe EnvironmentThe Minnesota Dairy is the nation’s largest college dailyAgent-assisted interface, user studies, user-centeredinterface design, learning agents, online newspaperproduction, electronic publication.newspaper, distributing 23,100 copies a day. In 1995 itbecame one of the first campus newspapers to publish onthe World Wide Web. This online edition is viewed byover 800 people a day nationwide.INTRODUCTIONWhile much research has been done in the design andimplementation of agents, there has been little work doneto study how users adapt to agent-assisted software.Donald Norman asks “How will intelligent agents interactwith people and perhaps more important, how mightpeople think about agents?” [13]. In addition, Rieckenquestions if people will want agents [16]. Studies haveincluded the use of agents in the domains of Usenetnewsreaders, calendar scheduling, air travel planning, andHowever, theseemail systems [1,3,9,10,11,12,15].studies focus on the feasibility of agent-aided systems andthe architecture for these agents. User studies, if any,were inclined to use test subjects in a controlled setting,rather than real users in their work context. The study byLester et. al [S] used elementary school students in acontrolled setting to examine how people perceive lifelike agents. Now that agents have been proven effectivein a laboratory setting, it is incumbent upon us to studyhow users in a real-world situation adapt to agentassistance in their software.To produce this digital edition the nightly production stafffollows a four-step procedure. The process begins with atransfer to the web server of the QuarkXPress’ files thatcomprise the print version. These files include not onlythe text of the stories, but also story elements such asheadlines, photos, cutlines (photo captions), and graphics.In the second step the user arranges the stories intodepartments (sports, for example), sorts them into thecorrect order within the department, and assigns eachstory its elements. Next, the formatting program createsthe HTML code by translating and combining theQuarkXPress files. Finally, this finished edition is addedto a searchable database for archive purposes.Although the print version of the paper is put togetherdigitally, online production is still a labor intensiveprocedure. There are several factors that complicate thisprocedure. First, the online edition does not have thesame structure as the print version of the newspaper. ThePermission to make digital/hard copies of all or part oftbii material forpersonal or classroom use is granted without fee provided that the copiesare not made or distributed for profit or commercial advantage, tbe copyright notice, the title ofthe publication and its date appear, and notice isgiven that copyright is by permission ofthe AChl, Inc. To copy otherwise,to republish, to post on servers or to redistribute to Iii requires speciticpermission and/or f2e.’ QuarkXPress is a page layout program. It is a powerfultool for formatting and manipulating text on a page,especially when using multiple columns across severalpages.IUI 98 San FranciscoCA USACopyright 1998 ACM O-89791-955-6/98/How do users accept and adjust to agents?01. 3.50163
online edition is organized by department (news, sports,etc.), whereas the paper publication is organized spatiallywith articles from different departments often sharing thesame page. Because the department of a story is neverexplicitly stated in the print version, human intervention isnecessary to assign each story to its department. Second,QuarkXPress views the story text, headlines, photos, andother story elements as separate entities. It requireshuman input to group these entities into stories. Thepaper production process only implicitly groups storyelements through spatial layout; each picture is adjacentto several text elements.All four users were University of Minnesotaundergraduates. As Table 1 shows, their newspaper andcomputer experience was varied. They also came fromdifferent academic backgrounds. The production managerserved as the paper’s representative to the interface designprocess and trained each of the interns.By theimplementation and research stages the three interns hadjust completed their training in paper and onlinenewspaper production.THE INTERFACEWhile most of the online production process is automated,the second step - grouping elements by story, arrangingthe stories into department, and ordering the stories withinthe departments - requires substantive user involvement.Before this project, the staff used a web-based, CGIdriven program that was very difftcult to use. In additionto having few error correction capabilities, the programforced users to perform their tasks in a rigid and specificorder. Once an incorrect selection was made there werefrequently only two choices - start over from the verybeginning, or complete the program and modify thegenerated HTML manually. This process proved to beboth time-consuming and highly stressful for the users.Users reported averaging over half an hour using theprogram each night, as well as an additional half-hourmanually correcting the output.The UsersDuring the design of the program, the online edition wassingle-handedly produced each night by the onlineproduction manager. While designing the study, it wasassumed that this situation would continue. On the firstnight of the trial, the online manager presented a surprise- his three online interns’ would take over the nightlyproduction duties.While this development wasunexpected, it reflects the dynamics of a real world study.Though the experimental design had to be revised, thischange was quite a bounty. Now the interface could betested with novice users and data gathered on agentadaption for four users, instead of only one.PREVIOUSDAILYIt was quite clear that a new interface was needed - onethat was more forgiving of mistakes and less rigid in itsflow structure. The task centered user interface designprocess [7] was used to develop a new interface in Tcl/Tk[14]. The interface was modeled after WinFTP, aprogram used in a prior step of the process, to provide afamiliar look and feel. Figure 1 shows the arranging andordering screen. It consists of two listboxes separated bybuttons with directional arrows. The left-hand list initiallycontains all of the stories for the edition in progress, whilePRIOR COMPUTEREXPERIENCEEXPERIENCEUser Aedit writer,staff reporter,opinions editor,online internWord processing,QuarkXPressUser Bonline internWord processing,intranet mail andfile transfer,PowerPointUser Cfreelance,online internMathematics,C, HTML,word processingProductionManager(PM)online productionmanagerWord processing,PERL scripting,HTML, QuarWISressTable 1: User Backgrounds* Although the interns were of mixed gender, all internswill be referred to as “she” in this document for the sakeof the users’ privacy.Figure 1: The story sorting and ordering window164. - . .- .,. . -.”
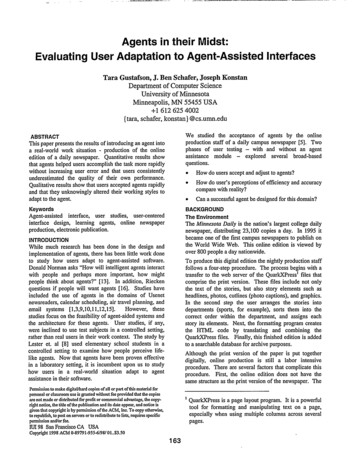
both the lead and a departmental list) adds more weight tothat department. Thus, words like “basketball,” “player.”and “court” found in the lead of a story probably suggestsa sports story. This algorithm could be extended toupdate the keyword lists based on each night’s stories.the right-hand list contains the five departments used bythe paper (News, Sports, Editorial Opinions, World andNation, and Backtalk). Users select stories and transferthem to the department list. Users drag and drop stories tosort them within each department. Furthermore, at somepoint, users must associate each story with its elements(headlines, photos, etc.).RESEARCH DESIGNA six-week, two-phase investigation was designed. PhaseI consisted of introducing the program (without agentassistance) into nightly use at the Minnesota Daily. PhaseII incorporated the agent assistance module into theprogram. Users were not informed about the pendingagent assistance module prior to the study.THE AGENTTo focus this study on user adaptation versus agenttechnology, a simple but effective agent was designed,consisting of several cooperating algorithms. As Figure 2shows, the agent combines programmed knowledge with ascoring system based on programmed and learnedsyntactic attributes. The results of each algorithm areweighted, and if the agent feels that the combinedconfidence level is high enough it places the story in therecommended department. Algorithm 1:Does thefilenameAlgorithm 2:No Is the author’s No-b name found in *the seededConfidencelevel is high.Place story inof the author’sdepartment,::I%:?i Ezlead, is it in thedepartment’skeyword list?YesWe gathered data in three ways. First, the programincluded code to trace and record user actions and timinginformation. These records provided a timeline of eachuser’s actions, allowing an analysis of user performanceand working style. Second, live observations provided anunderstanding of the context in which users work eachnight ahd how errors occur. Finally, user interviewsprovided insight into each user’s thought process and howshe perceived her own performance.’Finally, we needed a criterion to evaluate the third goal the success of the agent. Success was defined as a 20%reduction in sorting3 time per story with no significantincrease in the error rate. Data about the agent wasgathered using the tracing mechanism defined above.Add 1 to thedepartmentcount of the list.IMETRICSTo aid in defining the study and analyzing the results, thefollowing metrics were defined:.Figure 2: Agent AlgorithmlThe first algorithm is designed to make recommendationsbased on the filename of the story. For example, thereshould be a file each night named ‘stl####.xy’ (where the######is the month/day combination). This file containsthe “letters to the editor” and therefore can safely beassigned to the Editorial Opinions department (regardlessof the author(s) or keywords contained in the body of thefile).sorting time: the total time spent sorting, wheresorting is moving stories to a department and orderingthe stories within that department.placement rate: the percentage of stories placed bythe agent.Because this study occurred in a real-world situation,users often interrupted production to tend to other tasks,socialize, or correct prior production errors, such as filesabsent from the system. Therefore, times had to beadjusted to account for serious discontinuities inproduction.All resuhing measurements should beconsidered approximate.The second algorithm extracts the “by-line” from a story’sbody to determine the author of the article. Becausereporters for the Minnesota Daily tend to write articleswithin a single department, each author’s history can beused to make a prediction. The algorithm updates itsauthor association rules each night by examining thefinished, user verified online edition.We also defined three error metrics. These indicatewasted time either by human or agent misplacement.The third algorithm searches the lead of a story (the firstparagraph) for keywords. Due to time constraints, a nonlearning search was used [6]. Lists were compiled bymanually searching the archives for words common to agiven department. The algorithm compares words foundin a story’s lead to these lists. Each “hit” (a word found in.user error: the number of times that a user placed astory in a department and later moved the story to adifferent department.agent error: the number of times that the agent placeda story into a department and the user moved it to a3 We use time spent sorting rather than total time as ourmeasure because it is the area where the agent’s effectsare concentrated.165
differerit department.presented in the final product. She started withthe first story of the news department, andworked her way through the news department.Then she moved on to the other departments.significant increase in the error rate: this is a difficultmetric, because the “‘error rate” includes correctingagent errors and the number of user placements isreduced when the agent placed stories. A decisionwas made to use subjective user satisfaction as theprimary measure. Also, the change in user error wasused to assess whether the users were less carefulwith unplaced stories.User C was less consistent, but she tended towork through the alphabetical story list one storyat a time transferring each story to itsdepartment. After all stories were transferred shesorted each department’s stories into prop&order.The study did not take into account uncorrected errors,where a story was in the wrong department when the userfinished using the program.All three users completed the task of sorting ill of thestories before continuing with the task of associating eachstory with its elements.PHASE IDespite never having used the program before, the usersbecame quite proficient at the online production process.In order to complete the program, users spent an averageof 41 seconds per story [Table 31. More specifically, theusers spent an average of 11 seconds sorting each storyand made approximately one error per night.GoalsPhase I consisted of introducing the agentless programinto nightly use at the Minnesota Daily. There were threegoals for this phase.lTrack implementation of the program.lCompare user perceptions with reality.lEstablish a baseline for phase II.PHASE IIGoalsGoals in phase II were natural extensions of the goals inphase I.ResultsAt the end of phase I, we asked users to estimate the timespent using the program and the number of errors madeeach night. As Table 2 shows, in most cases usersunderestimated their own abilities. Users frequentlyreported times 50-100% higher than their actualperformance times. They also tended to report highererror rates than those recorded.lExamine how users adapt to agent-assisted software.0Compare user perceptions with reality.lDetermine if placement agents can improve overallperformance.ResultsThe first time each user encountered the agent, the typicalreaction was “cool, it placed some of the stories for me.”Surprisingly, the users did not ask the observers why someof the stories were being moved. Instead, they simplyreturned to the task of completing online production.With the agent in place, users settled into new workingstyles. Users A, B, and the production manager (PM)adopted the style of moving all unplaced stories to thecorrect department and then ordering the stories within theHowever, user C adopted the nearlydepartments.opposite style of ordering the stories department bydepartment and moving unplaced stories over as needed.Table 2: Phase I data: estimates by users and theactual figures.The users4 quickly developed individual styles:At the end of phase II, users were again asked to estimatetheir time and error rates. They were also asked toestimate the agent’s placement and error rate. Table 4shows that users continued to underestimate their ownThey all overestimated the agent’sperformance.placement rate, while also overestimating the number oferrors that the agent made each night. When asked todescribe the performance of the agent all reportedplacement rates in the 80-90% range. In fact, placementrates were closer to 70%. Users estimated the number ofUser A developed the habit of sorting storiesdepartment by department. She preferred toselect all of the stories for the first departmentand transfer them as a unit. Then she arrangedthem in the correct order. This was repeated foreach of the remaining departments.User B was inclined to transfer stories one at atime in the order in which they would be4 Due to the production schedule, the production managerdid not contribute any data to this phase of the trial.166
II-- ---.-TOTAL TIME PERSTORY (SECONDS)SORTING TIME PERSTORYERRORS 2OM.50Day 5User C180:36:2Day 6User A230:20.10:08.3cl0Day 7User B240:56.50:14.15Day 8User A210:29.60:15.90Day 9User A291:03.10:09.10Day 10User B151:11.40:16.82Day 11User A160:28.40:06.80Day 12User C190:49.90:16.430:41.20:ll.lper storyplacedII0:12.1I- ---- .0.92ITable 3: Phase I ResultsTable 4: Phase II data: estimates by users and the actual figures. The last column contains the users’responses when asked if the agent improved their speed.errors made by the agent to be approximately 2 to 3 eachnight. In reality, the agent averaged 1.5 errors each night.phase II, where the agent placed many of the stories, bothusers changed their strategy to move all unplaced storiesinto departments before ordering them. In phase I, user Ctended to work through the alphabetical story list onestory at a time, transferring each story to its department.In phase II, she adopted the style of ordering the storiesdepartment by department and moving stories into thedepartments as needed.Overall completion times became far more stable thanthose observed in phase I. Users quickly settled intoproduction times of less than 10 minutes [Table 51.Sorting times averaged 8.9 seconds per story in phase II.The users made an error only once during the entire phase.ANALYSISAdaptingComparing phases I and II at the user level revealed oddresults. For example, while User A improved her overalltime by 47%, her sorting time (which should show theagent’s effects) didn’t change at all. User C, on the otherhand, experienced the opposite phenomenon. Her overalltime decreased only slightly, but her sorting time droppedto AgentsWhile examining the users’ working styles, an interestingphenomenon was observed.In phase II, the usersreversed their sorting strategies. In phase I, users A and Bchose to assign and order all the stories for a singledepartment before moving on to the next department. In167
052.10:13.8PLACEDBYAGENTPLACEDCORRECTLYBY AGENT419/2115/1911l/21IO/l 111312212/13IUserCI22Day 4User C150:30.30:07.600113/15lU13Day 5User B190:29.20:05.60315/1912/15Day 6User A210:20.00:07.80112J211l/12Day 7User C170:31.80:07.800lU1712/12010/13lO/lODay 31ERRORSBYAGENTIIDay 8P.M.130:32.50:07.90Day 9User A200:19.50:11.302lU2010/12021512213/15Day 101 P.M.12210:13.210:03.71Day 11User C190:34.10:07.00111/19lO/llDay 12User sUser errorsper storyplaced0.01Table 5: Phase II databy 24%. A consistent explanation for these results has notbeen found.the fact they also had several nights without any errors,User estimates of the agent’s error rate confirms thisspeculation. Each reported an agent error rate of severalmistakes each night, when the agent averaged only 1.5.Users did, however, overestimate the number of articlesplaced by the agent.However, one explanation may lie in the productionmanager’s observation that more than just their stylechanged - so did their attitude. While admitting that as auser he preferred the agent-assisted version, he expressedconcerns as a supervisor. He felt that users put too muchconfidence in the agent’s decisions and unconsciouslyextended the agent’s abilities into areas where they did notexist. For example, he felt that users paid less attention tothe order of the stories within a department. This is hardto verify, because this was not a controlled experimentwith exact right and wrong answers. Short of asking theproduction manager to produce an “answer key” for eachevening’s edition, it is very difficult to establishcorrectness. What is published online may or may not bethe “correct” edition.During the interviews, the users were asked how the agentaffected their use of the program. All reported no changein their work patterns. Yet, as discussed above, each ofthe users significantly modified her style. It may be thatthe style modifications each user made was so natural toher that she did not recognize that her style had changed.Two of the users made an interesting observation. Theyfelt that the agent improved the “thought-flow” of theprogram. In general, they felt this program has twoseparate mindsets - first placing stories and then errorchecking. Users start in the first mindset. Once all storiesare assigned to a department, the user must switch to thesecond mindset and make sure the stories are in the rightorder within the correct department. Users then check tomake sure that the right elements have been assigned toeach story. When the agent places a majority of thestories, users may bypass the first mindset and sort theunplaced stories while error checking.Perceptions Versus RealityAn interesting pattern emerged when users were asked toestimate their performance using the program. In nearlyall cases users underestimated their own abilities. Usersfrequently reported times 50-100% higher than theiractual performance times. They also tended to reporthigher error rates than those recorded. We speculate thatthe users may have recalled a night where they madeseveral errors and reported that as their average, forgettingAgent Evaluation*Recall that there were two criteria established to measure168
FUTURE WORKThis project is a work in progress. We continue to collectdam from both versions of the program. It is hoped thatthis will help determine whether the difference betweenphases I and II reflects the agent or was skewed by theusers’ learning curve. We also look forward to seeing ifuser styles revert when the agent is removed from theprogram.We are also interested in studying these questions:the success of the agent: a 20% reduction in time, and nosignificant increase in the error rate. When we examinethe time spent running the program, we see that theaverage declined from 41.2 seconds per story to 30.0seconds, a decrease of 27.2% [Table 63. A more accurateand realistic measure of success is an examination of the“sorting” time. Because the agent aids the user inassigning stories to a department, the agent’s actions areconcentrated most clearly in the sorting domain. Sortingdropped from 11.1 seconds per story in phase I to 8.4seconds per story in phase II, an overall reduction of23.7%.USERTOTALTIME PERSTORY(SECONDS)SORTINGTIME PERSTORY(SECONDS)Group-27.2%-23.7%User A-41.4%-0.9%User B-33.8%-31.4%User c-2.3%-24.0%.effect of agent accuracy and placement rates on userperformance.effect of slow/fast increases/decreases in agentperformance on the user’s ability to detect errors.nature of user centered design in agent assistedapplications [ 151lthe value of filename and keyword analysis for thisdomainAFTERWORD: User Ownership and AcceptanceDuring the task-centered design process, we workedclosely with the online production manager. He was veryexcited about the development of the program and hisinput was invaluable during its design. By the time theonline interns were ready to perform production, theprogram’s design was complete. Though the interns didnot directly contribute to its development, they began tofeel that the program was being developed for them andthat they could influence its path [4]. We did notanticipate this sense of ownership, since the interns werenever directly involved in the program’s design. Thisfeeling of ownership may be attributed to the onlineproduction manager’s involvement in the project, hisrelationship with the interns, and his enthusiasm for theprogram.Table 6: Percentage change between phase I and II.The second criterion of success was no significantincrease in the error rate. While the error rate increased by54.5% between the two phases, this is only an increasefrom slightly less than one error to one-and-a-half errorsper evening. Since user error rates dropped (in fact therewas only one user error in all of phase II) and usersreported no difficulty in catching the agent’s mistakes, thiswas viewed as a non-significant increase.Looking at the number of errors each night may bemisleading since the number of stories placed by the userdiffered between phases. In phase I, users average .04errors per story placed, whereas in phase II, usersaveraged .Ol errors per story placed.Perhaps due to this feeling of ownership, the interns werewilling to overlook early bugs in the program thatprevented them from completing production, often tryingthree or four times before turning to the previousproduction program. It may have also contributed to theease with which users adapted to the agent.The numbers behind this project suggest that a successfulagent can be built for this domain. However, historyteaches us that no matter what the numbers may show, it isthe users’ perceptions and feelings that determine theoverall success of a system [2].ACKNOWLEDGMENTSWe would like to thank Joanne Holroyd for herinvolvement as a team member in the early stages of thisproject and the staff of the Minnesota Daily; in particularPatrik Dousa who let us into the late night world of onlineproduction and never once complained when our bugsmeant he or his staff had to attempt production multipletimes.Both in observations and in interviews, it was clear thatusers appreciated the agent assisted version. Despite theagent’s imperfections, it quickly gained the confidence ofthe users, All users reported that they were comfortablewith the agent and voiced a resounding preference for theagent assisted version. None of the users reportedconcern with how or why the agent was making itsplacement decisions. This may stem from the fact thatproduction frequently occurs between the hours of 11:30PM and 2: 15 AM. At this late hour, users’ attitudes are “Idon’t care what happens or how it happens, as long as itgets me out of here early.”REFERENCES1. Armstrong, R., Freitag, D., Joachims, T., Mitchell, T.,Web Watcher: A Learning Apprentice for the WorldWide Web, AAAI Spring Symposium on InformationGathering, Stanford, CA, March 1995.169
2. Baecker, R., Grudin, J., Buxton, W., and Greenberg,S., Readings in Human Computer Interaction: Towardthe Year 2000. Morgan Kaufmann, San Fransisco CA,1995,49-52.3. Barrett, R., Maglio, P., Kellem, D., How toPersonalize the Web, Proceedings of CHI ‘97 (AtlantaGA, March 1997), Addison-Wesley, 75-82.4. Bass, L., Kasabach, C., Martin, R., Siewiorek, D.,Smailagic, A., Stivoric, J., The Design of a WearableCompter. Proceedings of CHI ‘97 (Atlanta GA,March 1997). Addison-Wesley, 139-146.5. Bellotti, V., Rogers, Y., From Web Press to WebPressure: Multimedia Representations and MultimediaPublishing, Proceedings of CHI ‘97 (Atlanta GA,March 1997), Addison-Wesley, 279-286.6. Gennari, J., Langely, P., Fisher, D., Models ofIncremental Concept Formation. Elsevier SciencePublishers B. V., North-Holland, 1989, 1l-617. Lewis, C., Rieman, J., Task-Centered User InterfaceDesign, ftp.cs.colorado.edu8. Lester, J., Converse, S., Kahler, S., Barlow, S. T.,Stone, B., Bhogal, R., The Persona Effect: AffectiveImpact of Animated Pedagogical Agents, Proceedingsof CHI ‘97 (Atlanta GA, March 1997), AddisonWesley,359-3669. Lieberman,H.,AutonomousInterfaceAgents,Proceedings of CHI ‘97 (Atlanta GA, March 1997),Addison-Wesley, 67-74.lO.Maes, P., and Kozierok, R., Learning Interface Agents,In Proceedings of the AAAI’93 Conference. MITPress, Cambridge, Mass., 1988,459-4651l.Maes, P., Agents that Reduce Work and InformationOverload, Commun. ACM 37,7 (July 1994) 31-4012.Mitchel1, T., Caruana, R., Freitag, D., McDermott, J.,Zabowski, D., Experience With a Learning PersonalAssistant. Commun. ACM37,7 (July 1994), 81-9113.Norman, D., How Might People Interact with Agents,Commun. ACM 37,7 (July1994), 68-7114.Ousterhout, J., Tel and the Tk Toolkit, AddisonWesley, Reading, Mass., 1994lS.Rich, C., Sidner, C., Adding a Collaborative Agent toGraphical User Interfaces, ACM Symposium on .com/pub/rich/uist96.ps.Z16.Riecken, D., Intelligent Agents, Commun. ACM 37,7(July 1994), 18-21170
became one of the first campus newspapers to publish on the World Wide Web. This online edition is viewed by over 800 people a day nationwide. To produce this digital edition the nightly production staff follows a four-step procedure. The process begins with transfer to the web server of QuarkXPress' files that comprise the print version.