Transcription
Harari et al. Journal of NeuroEngineering and 0704-3(2020) 17:71RESEARCHOpen AccessInpatient stroke rehabilitation: prediction ofclinical outcomes using a machine-learningapproachYaar Harari1,2†, Megan K. O’Brien1,2†, Richard L. Lieber2,3,4 and Arun Jayaraman1,2*AbstractBackground: In clinical practice, therapists often rely on clinical outcome measures to quantify a patient’s impairmentand function. Predicting a patient’s discharge outcome using baseline clinical information may help clinicians designmore targeted treatment strategies and better anticipate the patient’s assistive needs and discharge care plan. Theobjective of this study was to develop predictive models for four standardized clinical outcome measures (FunctionalIndependence Measure, Ten-Meter Walk Test, Six-Minute Walk Test, Berg Balance Scale) during inpatient rehabilitation.Methods: Fifty stroke survivors admitted to a United States inpatient rehabilitation hospital participated in this study.Predictors chosen for the clinical discharge scores included demographics, stroke characteristics, and scores of clinicaltests at admission. We used the Pearson product-moment and Spearman’s rank correlation coefficients to calculatecorrelations among clinical outcome measures and predictors, a cross-validated Lasso regression to develop predictiveequations for discharge scores of each clinical outcome measure, and a Random Forest based permutation analysis tocompare the relative importance of the predictors.Results: The predictive equations explained 70–77% of the variance in discharge scores and resulted in a normalizederror of 13–15% for predicting the outcomes of new patients. The most important predictors were clinical test scoresat admission. Additional variables that affected the discharge score of at least one clinical outcome were time fromstroke onset to rehabilitation admission, age, sex, body mass index, race, and diagnosis of dysphasia or speechimpairment.Conclusions: The models presented in this study could help clinicians and researchers to predict the discharge scoresof clinical outcomes for individuals enrolled in an inpatient stroke rehabilitation program that adheres to U.S. Medicarestandards.Keywords: Physical therapy, Functional Independence measure, Gait, Balance, Lasso regression* Correspondence: a-jayaraman@northwestern.edu†Yaar Harari and Megan K. O’Brien these authors contributed equally to themanuscript and should be considered co-first authors.1Max Nader Lab for Rehabilitation Technologies and Outcomes Research,Shirley Ryan AbilityLab, 355 E. Erie St., Chicago, IL 60611, USA2Department of Physical Medicine and Rehabilitation, NorthwesternUniversity, Chicago, IL 60611, USAFull list of author information is available at the end of the article The Author(s). 2020 Open Access This article is licensed under a Creative Commons Attribution 4.0 International License,which permits use, sharing, adaptation, distribution and reproduction in any medium or format, as long as you giveappropriate credit to the original author(s) and the source, provide a link to the Creative Commons licence, and indicate ifchanges were made. The images or other third party material in this article are included in the article's Creative Commonslicence, unless indicated otherwise in a credit line to the material. If material is not included in the article's Creative Commonslicence and your intended use is not permitted by statutory regulation or exceeds the permitted use, you will need to obtainpermission directly from the copyright holder. To view a copy of this licence, visit http://creativecommons.org/licenses/by/4.0/.The Creative Commons Public Domain Dedication waiver ) applies to thedata made available in this article, unless otherwise stated in a credit line to the data.
Harari et al. Journal of NeuroEngineering and Rehabilitation(2020) 17:71BackgroundStroke remains one of the leading causes of disabilityworldwide, with the majority of stroke survivors requiring specialized rehabilitation [1]. Inpatient stroke rehabilitation is a program of medical intervention andtargeted therapies, which aims to maximize a patient’sfunctional recovery and facilitate reintegration into thecommunity [2, 3]. To evaluate progress, clinicians usestandardized assessment tools or clinical outcome measures such as the Functional Independence Measure [4](FIM) for level of disability or the Ten-Meter Walk Test[5] (TMWT) for walking ability. Understanding the factors that affect these outcomes may help clinicians tostreamline the treatment plan and efficiently allocaterehabilitation resources [6, 7]. Further, clinicians assess apatient’s functional abilities based on performance inthese standardized tests, such as classifying patients ashousehold ambulators or limited community ambulatorsbased on walking speed score from the TMWT [8, 9].Estimating a patient’s future discharge scores early in arehabilitation program would help clinicians set realisticrehabilitation goals and anticipate needs for additionalcare or medical equipment at discharge.Several studies have investigated predictors of clinicaloutcomes after acute inpatient stroke rehabilitation [10–15]. Their main focus was to predict individual’s abilityto perform activities of daily living, as measured by theFIM and the Barthel Index [16], or to predict walkingspeed as measured by the TMWT [14]. These studiesfound that the clinical assessment scored at dischargecould be predicted based on patient demographics suchas age [10–13, 15] and sex [11], medical informationsuch as the time from stroke onset to rehabilitation admission [11, 13] and the admission score of the predicted outcome [10–14]. However, there are somenotable gaps in our knowledge and understanding ofthese outcomes. Specifically, previous studies have primarily investigated predictors of a single clinical outcome measure, while therapists often use multiplestandardized tests to gauge functional abilities. TheAmerican Physical Therapy Association highly recommends additional tests [6], including the Berg BalanceScale [17] (BBS), which assesses balance outcomes andfall risk, and the Six-Minute Walk Test [18] (SMWT),which assesses walking endurance and aerobic capacity.Understanding interactions among different clinical outcomes may help identify the tests that provide uniqueinformation about specific functional abilities comparedto tests that may be redundant or unrelated to thoseabilities. Second, studies have predicted the dischargescore of a clinical outcome using admission scores froma small subset of other clinical outcomes [14, 19]. Forexample, discharge walking speed has been predictedfrom admission scores of BBS and the MotorPage 2 of 10Assessment Scale [20]. Considering additional admissionassessments should improve predictive accuracy, whileincluding additional discharge assessments should provide a more comprehensive overview of a patient’s functional outcomes. Finally, previous studies developedpredictive models for clinical outcomes using stepwisemethods based on the predictors’ significance level (pvalue). However, the ability of the p-value to determinethe importance of predictors and to output the optimalset of predictors is limited, especially for small samplesizes, small ratio of sample size to predictors, and correlated predictors [21–27]. Conversely, certain machinelearning approaches aim to reduce model error byselecting a targeted set of predictors based on relativeimportance [28] and incorporate regularization mechanisms to produce more accurate and generalizable predictions [29].The objective of this study was to use machinelearning algorithms to develop predictive models for discharge scores of four standardized clinical tests (FIM,TMWT, SMWT, BBS) after inpatient stroke rehabilitation. Potential predictors included patient demographics,stroke characteristics, and the scores of each of the fourtests at admission. We also investigated the correlationsbetween the clinical outcomes and the predictors, statedthe predictors’ significance level and compared theirrelative importance in effecting the discharge scores.MethodsFifty individuals with stroke admitted to the Shirley RyanAbilityLab (formerly, the Rehabilitation Institute of Chicago) for acute inpatient rehabilitation participated inthis study. All individuals (or a proxy) provided writteninformed consent prior to participation. Inclusion criteria were: diagnosis of stroke and admitted to the Shirley Ryan AbilityLab; at least 18 years of age, and ableand willing to give consent and follow study proceduredirections. Exclusion criteria were: diagnosis of neurodegenerative pathology as a co-morbidity (e.g., Alzheimer’sdisease, Parkinson’s disease, etc.); pregnant or nursing;or utilizing a powered, implanted cardiac device formonitoring or supporting heart function (i.e., pacemaker,defibrillator, or LVAD). Medical clearance was obtainedfrom each patient’s primary physician for study participation. The study was approved by the Institutional Review Board of Northwestern University (Chicago, IL;STU00205532) in accordance with federal regulations,university policies and ethical standards regarding research on human subjects.After consent, and within the first week of admission,a battery of clinical tests – including the TMWT,SMWT, and BBS – was administered by a licensed physical therapist. These tests were performed in a nonstandardized order based on the availability of
Harari et al. Journal of NeuroEngineering and Rehabilitation(2020) 17:71equipment and space in the therapy room. During theinpatient rehabilitation program, patients received, onaverage, 180 min of therapy per day, five to 6 days aweek. Based on the needs of the patient, this time wasdivided among physical, occupational, and speechlanguage therapy. This rehabilitation program follows requirements of Medicare, a major health insurance provider, which sets standards for inpatient strokerehabilitation in the United States [30]. Within a week ofdischarge from the hospital, the same battery of clinicaltests was again administered to determine the clinicaloutcomes after inpatient rehabilitation. FIM scores atadmission and discharge were compiled from individualFIM items recorded in the patient’s electronic medicalrecords in accordance with the Inpatient RehabilitationFacility Patient Assessment Instrument guidelines (IRFPAI, regulated by the United States Centers for Medicare & Medicaid Services). As per hospital standards, theFIM was also administered by licensed physical therapists and performed within 72 h of admission and withinthe 24–48 h window prior to discharge.Patient demographics and stroke type were obtainedfrom the Electronic Medical Record (EMR). Diagnosesof dysphagia, cognitive-communication deficit, and otherspeech/language impairments were made by experiencedspeech/language pathologists in the hospital and alsocollected from the EMR as additional stroke characteristics. Finally, patients (or their proxies) completed a studyintake form regarding lifestyle and education.Dependent and independent variablesThe dependent variables were the discharge assessmentscores of four commonly used clinical tests: FIM,TMWT, SMWT, BBS.The independent variables (predictors) included demographic information, stroke characteristics, and scores ofthe clinical tests from the admission assessment. Demographic information included the patient’s sex, age, bodymass index (BMI), race, years of education, and prestroke activity levels (defining sedentary as less than 3 hof exercise per week, moderately active as 3–6 h of exercise per week, and highly active as greater than 6 h of exercise per week). Stroke characteristics included timefrom stroke onset to rehabilitation admission, stroketype (hemorrhagic or ischemic), and diagnoses at admission: dysphagia (i.e., difficulty or discomfort in swallowing), cognitive-communication deficit (i.e., frontal lobedisorders), speech impairments (e.g., aphonia, dysphoniaor dysarthria), and language impairment (i.e., aphasia).For analysis, these diagnoses were coded as binary variables (present or absent). The clinical tests at admissionincluded the patients’ FIM, TMWT, SMWT, and BBSscores. Patients who could not walk during a given assessment received a score of 0 for the TMWT orPage 3 of 10SMWT, in accordance with clinical practice guidelines[31] and similar to previous discharge prediction models[14, 32].Data analysisAll statistical analyses were performed using Python version 3.7.3. Normality was evaluated for each dependentvariable (i.e. FIM, BBS, TMWT and SMWT) using theShapiro-Wilk test. For normally-distributed variables,correlations among continuous variables were measuredusing the Pearson product-moment coefficient (r) andamong continuous and categorical variables were measured using the Point-biserial coefficient (rpb). For nonparametric variables, correlations were measured usingthe Spearman’s rank correlation coefficient (rs). For allprocedures, we considered a coefficient value below 0.3to express a weak correlation, 0.3 to 0.5 to express amoderate correlation and above 0.5 to express a strongcorrelation, as recommended by Cohen [33]. Significancelevel (α) was set to 0.05 and was used to determinewhich predictors significantly affected each clinical outcome score at discharge.Predictive models for the discharge scores of each clinical outcome were developed using the cross-validatedLasso regression [29]. Lasso regression is a type of linearregression that includes a regularization term. This termpenalizes a model based on the number of predictorsand the magnitude of their coefficients. Therefore, it encourages the development of simpler models (fewer predictors) and reduces risk of overfitting [34–37]. Therelative strength of the regularization is determined bythe value of its parameter λ, wherein λ 0 produces thesame coefficients as linear regression and higher valuesof λ produce sparser models by forcing more coefficientsto 0. In this study, we developed the prediction equations and evaluated their performance using a two-stage,nested, leave-one-out cross-validation (LOOCV) procedure [38, 39]. The outer LOOCV stage was used forevaluating the ability of the model to predict the outcome of a new patient, while the inner stage was used tooptimize the parameter λ. In each iteration of the outerstage, the data was divided into train and test sets. Then,the train set was sent to the inner stage and dividedagain for optimizing λ. Using this procedure ensuredthat the test set would only be used to evaluate themodels performance and never be used for developmentof the model or optimization of the λ parameter. Toquantify the goodness-of-fit of each predictive model, wecalculated the percentage of variance explained (R2), andMean Absolute Error (MAE). To evaluate model performance while accounting for the number of predictors,we also computed the adjusted R2 ( R2adj ). To comparemodel performance across the different dependent
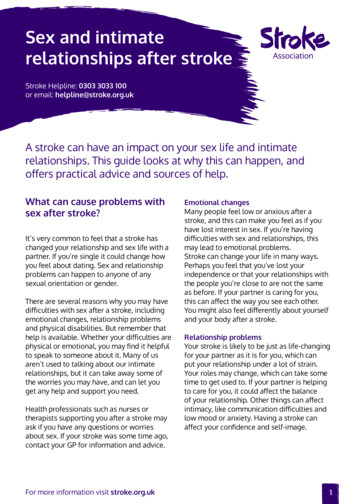
Harari et al. Journal of NeuroEngineering and Rehabilitation(2020) 17:71variables, we normalized the MAE of each model by therange of observed values (MAEn). To evaluate themodel’s ability to predict both patients that experiencesmall recovery and patients that experience large recovery, we used the Spearman’s rank correlation coefficient(rs) and calculated the correlation the patient responseto therapy (i.e. change in outcome from admission todischarge) and the model’s error.We applied the permutation importance analysis basedon a Random Forest model [28, 40] to measure the relative importance of the independent variables on eachclinical outcome score. Relative importance was established from the contribution of the variable to the predictor in reducing the prediction error. The permutationimportance analysis assigned an importance score (IS) toeach variable, ranging from 0 to 1. The relative importance (RI) of a predictor (%) was calculated by dividingthe predictor’s score by the sum of all the predictorsscores, as follows:Page 4 of 10Table 1 Demographic information, stroke characteristics, andclinical tests of study participants (N 50)Numeric variablesCharacteristicMeanSDRangeAge (y)57.514.1522–86Height (cm)172.911.3149.9–195.6Weight (kg)81.319.942.7–1182BMI (kg/m )27.15.7616.7–44.7Education (y)14.93.36–20Rehab duration (days)18.710.44–57Time from stroke to admission African ly active1122Highly ngeFIM55.919.117–98Predictors of clinical outcomes at dischargeTMWT (m/s)0.470.490–1.55All clinical outcomes at discharge (FIM, TMWT,SMWT, BBS) were strongly correlated to the scores ofthe FIM, TMWT, SMWT, and BBS at admission (0.69 SMWT (m)103.34122.770–461BBS20.616.261–55RI i; j ¼ IS i; j nXIS i; jð1Þi¼1where RIi, j is the relative importance of predictor i toclinical outcome j; ISi, j is the importance score of predictor i to clinical outcome j assigned by the RandomForest model; and n is the number of predictors for clinical outcome j. Only variables with RIi, j 0.01 were considered in the analysis.Categorical variablesCharacteristicSexRaceLifestyleStroke typeResultsSummary statistics of the patient demographics, strokecharacteristics, and clinical test scores are presented inTable 1. The scores of all four clinical outcomes measures significantly improved from admission to discharge(p 0.05). On average, from admission to discharge, FIMscores increased by 47.5% (26.6 points), walking speedfrom TMWT increased by 61.7% (0.29 m/s), walking endurance from SMWT increased by 82% (185 m), andBBS scores increased by 43% (9 points).Correlations between clinical outcomesThese results show a strong correlation (0.61 rs 0.92)among all clinical outcomes both at admission and atdischarge (Table 2). The strongest correlation was foundbetween the TMWT and SMWT at admission (rs 0.92). All correlations were significant (p 0.05) andpositive, such that higher scores in one test indicatedhigher scores in the other tests.Cognitive/Communication diagnosisSpeech diagnosisLanguage diagnosisDysphagiaClinical tests at admission
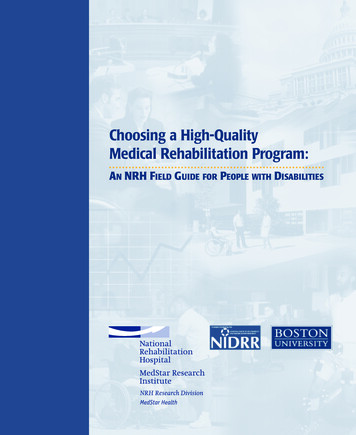
(2020) 17:71Harari et al. Journal of NeuroEngineering and RehabilitationTable 1 Demographic information, stroke characteristics, andclinical tests of study participants (N 50) (Continued)Clinical tests at dischargeTestMeanSDRangeFIM82.519.542–120TMWT (m/s)0.760.610–2.06SMWT (m)188.38163.440–562BBS29.617.410–56rs 0.88; p 0.05), meaning that a high score in one clinical test at admission indicated high scores in all clinicaltests at discharge. Time from the stroke onset to admission marginally affected the BBS and TMWT (rs 0.24; 0.05 p 0.1), meaning that shorter time fromstroke onset to admission indicated improved clinicaloutcomes at discharge. The FIM score was moderatelycorrelated with the patient’s sex (rpb 0.3; p 0.05), withfemales having higher FIM scores at discharge, and withdiagnoses of dysphasia at admission (rpb 0.32; p 0.05),where dysphagia was related to lower FIM scores at discharge. The BBS score was also moderately correlatedwith diagnoses of dysphasia (rs 0.38; p 0.05), wheredysphagia was related to lower BBS scores at discharge.Finally, the patient’s age significantly affected the BBSscore (rs 0.32; p 0.05), and marginally affected theSMWT (rs 0.26; 0.05 p 0.1), where younger patients had greater SMWT and BBS scores at discharge.Predictive equations for clinical outcomes at dischargePredictive models for discharge scores of each clinicaloutcome were developed using cross-validated Lasso regression (Table 3). The resulting models explained 70–77% of the variance in discharge scores, and averagenormalized error ranged from 10 to 13% for the studyparticipants and 13–15% for new patients. Thegeneralizability of each model was evaluated using atwo-staged nested LOOCV procedure, testing its abilityto predict scores of patients that did not participate inthe model’s development (Table 3). The LOOCV resultsTable 2 Correlations between clinical test scores, at admissionand 7310.770.8810.860.770.861Page 5 of 10show that the MAE increased by an average of 19% topredict the outcomes of a new patient in comparison tothe prediction error of the study’s participants. For predicting clinical outcomes of new patients, the averageerror was 9.5 points for the FIM model (range 0–23),0.3 m/s for the TMWT model (range 0.01–0.9), 80.8 mfor the SMWT model (range 7–256), and 7.4 points forthe BBS model (range 0–23).We used Spearman’s coefficient to measure the correlation between the patient response to therapy and themodel’s error. The results show a weak (rs 0.3) andnon-significant correlation (p 0.05) for all clinical tests,though there is a trend of greater error for individualswith large change in clinical scores in the TMWT andSMWT (Fig. 1). Patients with a change of 0 in theTMWT and SMWT were unable to complete these testsat both Admission and Discharge due to insufficient ambulation ability. Average MAE for these patients was0.16 0.10 m/s in the TMWT (n 7; Fig. 1b) and 80.7 23.6 m in the SMWT (n 3; Fig. 1c). On the other hand,some patients were unable to complete these tests atAdmission but gained sufficient ambulation ability to attain a score at Discharge. Average MAE for these patients was 0.27 0.25 m/s in the TMWT (n 9; Fig. 1b)and 56.7 32.9 m in the SMWT (n 10; Fig. 1c).The relative importance of the models’ predictors foreach clinical outcome at discharge is illustrated graphically in Fig. 2. The most important predictor for the discharge score of the FIM, TMWT, and BBS was theirown score at admission. The most important predictorfor the SMWT at discharge was the TMWT score at admission. The scores of the clinical tests at admissioncontributed 80–90% of the relative importance, whiledemographics and stroke characteristics together contributed the remaining 10–20%.DiscussionThis study presents a machine learning approach forthe prediction of clinical outcomes at discharge afterinpatient stroke rehabilitation. The equations developed in this study considered scores of clinical testsat admission, patient demographics, and stroke characteristics as possible predictors, which explained 70–77% of the variance in clinical scores at discharge.The normalized errors for the study’s patients rangedbetween 0.10–0.13 and for new patients between0.13–0.15. The permutation analysis found that themost important variables for prediction of the discharge outcomes predictors were the admission scoresof the clinical tests. The importance of the scores ofclinical test in admission for predicting dischargescore was also shown in a previous studies focusingon prediction of FIM [10] and walking speed [14].
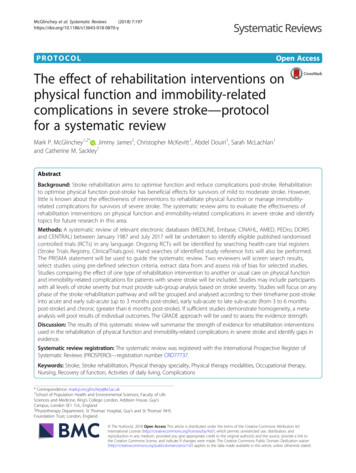
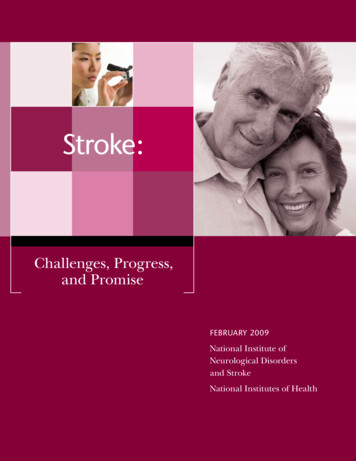
Harari et al. Journal of NeuroEngineering and Rehabilitation(2020) 17:71Page 6 of 10Table 3 Predictive models for the discharge clinical outcomes, including coefficients of each predictor and model goodness-of-fit(R2, R2adj , MAE, and MAEn)Predictive equation for clinical outcomes at dischargeStudy patients(N 50)Newpatients(LOOCV)MAER2ðR2ad j Þ (MAEn)MAE(MAEn)FIM60.14 2.23 TMWT 0.35 FIM 0.5 BBS 0.24 age 0.02 TSA 0.8 EDU 1.71 LI 0.05 BMI 10.6 HM 3.76 SI0.76(0.70)7.6(0.10)10.2(0.13)TMWT(m/s) 0.16 0.7 TMWT 0.01 FIM 0.003 TSA 0.02 EDU 0.44 HIS 0.15 LI0.70(0.66)0.26(0.13)0.3(0.15)SMWT(m)190.83 101.72 TMWT 1.03 BBS 0.54 SMWT 2.21 age0.70(0.67)73.2(0.13)80.8(0.14)BBS13.27 10.1 TMWT 0.33 FIM 0.21 BBS 0.24 age 0.08 TSA 0.42 EDU 5.57 WHT 1.96 LI0.77(0.73)6.4(0.11)7.4(0.14)MAE Mean Absolute Error, TMWT, FIM, BBS, SMWT clinical test scores at admission, TSA time from stroke to admission, EDU education in years, BMI Body MassIndex. The following variables are binary and receive the value of 1 or 0: HM hemorrhagic stroke, HIS Hispanic, WHT White, SI speech impairment, LI languageimpairment. The “New patients” MAE is the averaged error across all left-out subjects during the LOOCV procedureOur predictive equations may assist clinicians estimate a trajectory of recovery for their patients duringinpatient rehabilitation, using measures that are oftenavailable following admission. These results are especially relevant for rehabilitation programs similar tothe current study (i.e. following the requirement ofMedicare in terms of therapy types and dosage).We investigated the correlation between the clinicaloutcomes and found that the TMWT and SMWT werestrongly correlated (rs 0.92), as previously observed byFig. 1 Relationship between patient recovery and model performance. Spearman’s rank correlation between change in clinical score and meanabsolute error (MAE) for the (a) FIM, (b) TMWT, (c) SMWT, and (d) BBS. Red circles represent patients who scored a 0 at both Admission andDischarge assessments (did not achieve sufficient ambulation ability to complete the test by the end of inpatient rehabilitation); yellow circlesrepresent patients who scored a 0 at Admission but gained sufficient functional ability to complete the test at Discharge
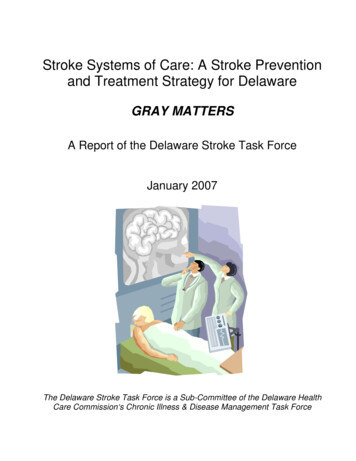
Harari et al. Journal of NeuroEngineering and Rehabilitation(2020) 17:71Page 7 of 10Fig. 2 Relative importance of independent variables for discharge clinical outcomes. (a) FIM Discharge model; (b) TMWT Discharge model; (c) SMWTDischarge model; (d) BBS Discharge model. Within each model, predictors relating to clinical outcomes tests (FIM, TMWT, SMWT, BBS) are scores fromthose tests at admission. TSA time from stroke onset to admission; EDU education in years; BMI Body Mass Index; HIS Hispanic; SI speechimpairment; LI language impairment; Age patient’s age in yearsseveral studies for patients with stroke, spinal cord injury, multiple sclerosis [41–45]. These correlations couldexplain why only one of the walking tests is included inthe FIM, BBS, and TMWT models, since the Lasso regression tends to choose a single variable in a set of correlated predictors [29].In the current study, apart from the admission scores,additional variables with at least 1% of relative importance for at least one clinical outcome included the timefrom stroke onset to admission, age, BMI, race, education, dysphasia, and language impairment. Each of thesepredictors was found to affect clinical outcomes in atleast one previous study [10, 13, 14, 46, 47]. The contribution of the current study is in providing a more comprehensive investigation of the clinical tests and set ofpredictors, in which we found that the relative importance of these variables was much smaller (10–20%) thanthe importance of the scores of clinical tests at admission (80–90%).The predictive equation for the FIM discharge scoreexplained 76% of the variance. This model explainedmore variance than the models presented in all previousstudies for predicting FIM at discharge [9, 13, 48], except Ferriero et al. [48] whose model explained 82% ofthe variance. However, the model of Ferriero et al. [48]included medical comorbidities and complications,which were not considered in the current study. TheTMWT discharge predictive equation in the currentstudy explained 70% of the variance, outperforming previous models [15, 19] except for Bland et al. [14] whosemodel explained 81% of the variance. The model inBland et al. [14] might have explained more variance because it considered the FIM walk item, which focusesmore on elements affecting gait velocity compared tothe total FIM score used in the current study. To thebest of our knowledge, the current study is the first todevelop predictive models for the BBS or SMWT valuesat discharge.We applied a machine learning approach to developpredictive models of clinical outcomes at hospital discharge (using cross-validated Lasso regression). Previousstudies that predicted discharge scores of clinical outcomes used the p-value as a criterion for determiningrelative importance or selecting features [11, 13, 14, 19].However, this criterion is prone to overfitting and maynot select the most important features, especially incases where the predictors are strongly correlated [21–27]. In the current study, the feature selection processwas performed using the cross-validated Lasso regression, which includes a regularization mechanism (L1) toreduce the risk of overfitting. Since Lasso regressionmay rule out important variables due to co-linearity withother variables, we investigated the relative importanceof the independent variables using permutation
Harari et al. Journal of NeuroEngineering and Rehabilitation(2020) 17:71importance analysis considering all independent variables. The importance of each variable was evaluated byits ability to reduce error of the Random Forest modelwhich provides a more comprehensive, non-linear, analysis of the relative contributions of each variable to theclinical outcome.The ability to predict clinical outcomes during strokerehabilitation remains a meaningful yet challenging task.Clinical test scores at discharge are informative whenassessing the patient’s level of independence, ambulation, and risk of falling. Forecasting a patient’s dischargescores early in a rehabilitation program can help clinicians, patients, families, and insurance companies betterprepare for the patient’s care needs after leaving the hospital (e.g., to plan discharge location such as skillednursing facility or home, to estimate the level of assistance the patient will require, to order equipment such asa wheelchair or orthosis, or to evaluate the expectedmedical costs or insurance coverage). One of t
Inpatient stroke rehabilitation: prediction of clinical outcomes using a machine-learning approach Yaar Harari1,2†, Megan K. O’Brien1,2†, Richard L. Lieber2,3,4 and Arun Jayaraman1,2* Abstract Background: In clinical practice, therapists often rely on clinical outcome measures to quan