Transcription
134Tropical Cyclone Research and ReviewVolume 8, No. 3Seasonal Tropical Cyclone ForecastingPhilip Klotzbacha, Eric Blakeb, Joanne Campc, Louis-Philippe Carond, Johnny C. L. Chane,Nam-Young Kangf, Yuri Kuleshovg, Sai-Ming Leeh, Hiroyuki Murakamii, Mark Saundersj,Yuhei Takayak, Frederic Vitartl and Ruifen ZhanmColorado State University, Fort Collins, USANOAA/National Hurricane Center, Miami, USAcMet Office, Exeter, UKdBarcelona Supercomputing Centre, Barcelona, SpaineGuy Carpenter Asia-Pacific Climate Impact Centre, School of Energy and Environment, City Universityof Hong Kong, Hong Kong, ChinafNational Typhoon Center/Korea Meteorological Administration, Seoul, Republic of KoreagBureau of Meteorology, Melbourne, AustraliahHong Kong Observatory, Hong Kong, ChinaiGeophysical Fluid Dynamics Laboratory, Princeton University/University Corporation for AtmosphericResearch, USAjUniversity College London, Surrey, UKkMeteorological Research Institute, Japan Meteorological Agency, Tokyo, JapanlEuropean Centre for Medium-Range Weather Forecasts, Reading, UKmShanghai Typhoon Institute of China Meteorological Administration, Shanghai, ChinaabABSTRACTThis paper summarizes the forecast methods, outputs and skill offered by twelve agencies for seasonal tropical cyclone (TC) activity around the world. These agencies use a variety of techniques ranging from statisticalmodels to dynamical models to predict basinwide activity and regional activity. In addition, several dynamical and hybrid statistical/dynamical models now predict TC track density as well as landfall likelihood. Realtime Atlantic seasonal hurricane forecasts have shown low skill in April, modest skill in June and good skill inAugust at predicting basinwide TC activity when evaluated over 2003-2018. Real-time western North Pacificseasonal TC forecasts have shown good skill by July for basinwide intense typhoon numbers and the ACE indexwhen evaluated for 2003-2018. Both hindcasts and real-time forecasts have shown skill for other TC basins. Asummary of recent research into forecasting TC activity beyond seasonal (e.g., multi-year) timescales is included. Recommendations for future areas of research are also discussed.Keywords: hurricane, typhoon, tropical cyclone, seasonal forecasting, forecast skill1. IntroductionSeasonal tropical cyclone (TC) forecasts began withthe pioneering work of Neville Nicholls at the AustralianBureau of Meteorology for the Australian region (Nicholls1979, Nicholls 1984, Nicholls 1985) and William Grayat Colorado State University (CSU) for the Atlantic basin(Gray 1984a, b). These original forecasts were based onstatistical relationships between climate phenomena suchas El Niño-Southern Oscillation (ENSO) and TCs. Manygroups currently issuing seasonal forecasts continue to useCorresponding author: Philip Klotzbach, philk@atmos.colostate.eduDOI: 10.6057/2019TCRR03.03statistical relationships between climate indices and TCs astheir primary tools for prediction.Dynamical models are also used as a forecast tool byseveral groups issuing seasonal TC forecasts. Vitart et al.(1997) showed that TC-like vortices could be tracked in ageneral circulation model (GCM) and that these vorticesshowed interannual variability that matched well withobserved TC variability when forced with observed seasurface temperatures (SSTs). Vitart and Stockdale (2001)showed that dynamical forecasts could also use forecastSSTs to successfully replicate Atlantic TC activity levels.Additional studies over the next several years documented
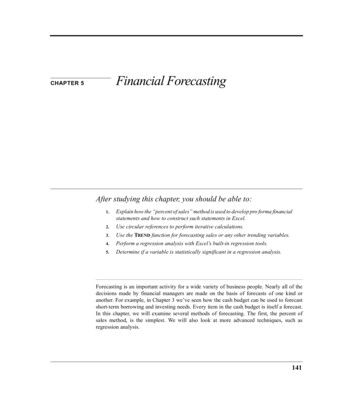
September 2019Klotzbach et al.dynamical model skill at forecasting both basinwide as wellas regional TC activity for various portions of the globe(e.g., Vitart 2003, Camargo and Barnston 2009).Another technique currently in use by many forecasting organizations is a hybrid statistical/dynamical seasonalforecast, whereby large-scale climate factors are forecastby a dynamical model, and then a statistical model is usedto relate the predictions of these large-scale climate factorsto hurricane activity (Vecchi et al. 2011). The use of hybrid schemes has become more popular in recent years, asevidenced by the number of groups in this manuscript currently using this approach.The longest continuous operational forecast has been issued for the North Atlantic basin by CSU since 1984 (Gray1984a, b). Since that time, many other forecast groupshave begun issuing forecasts for the North Atlantic basin.In addition, several groups now issue operational forecastsfor other TC basins around the globe, including the easternNorth Pacific, the western North Pacific (WNP) and theAustralian region. Camargo et al. (2007) and Camargo etal. (2010) provided reviews of seasonal forecasting techniques available at that time. This paper summarizes andupdates current operational seasonal forecasts available forvarious TC basins. We do note that many groups other thanthose discussed here issue forecasts for the Atlantic basin,with several groups not listed here issuing predictions forother TC basins as well. For additional discussion of themechanisms driving TC variability on seasonal timescales,please refer to Vitart et al. (2014).Recently, integrated and collaborative efforts for seasonal TC forecasts have been made among research andoperational agencies. Currently, 26 different forecastgroups including six government agencies, ten private sector weather companies and ten universities are contributingpublicly-available seasonal forecasts for the North Atlanticto a collation website http://www.seasonalhurricanepredictions.org. All forecast numbers are available for download.Nearly half of the contributing agencies (12 out of 26)have been issuing publicly-available forecasts since at least2007. This collation website also provides brief descriptions of each North Atlantic forecast group’s methodologyand provides links to their websites where more detailsare included. The forecast technique used by the majorityof contributing agencies is a hybrid statistical/dynamicaltechnique, with the UK Met Office being the only publiclyavailable dynamical model included. The goal is to expandthis website in the future to include seasonal TC forecastsfor all ocean basins for which multiple agencies are issuingforecasts.In addition to seasonal forecasts for entire TC basins,some of these forecasts now go beyond predicting basinwide TC activity and highlight areas where TC tracks aremore or less likely. The paper also briefly discusses outlooks issued beyond seasonal (e.g., multi-year) timescalesand finishes with a summary and some ideas for areas of135future research.2. Seasonal tropical cyclone forecastsTable 1 summarizes the scope and nature of the forecastsissued by the twelve agencies considered herein. The tablelists the agencies in the order that they are discussed. Thefirst seven agencies provide publicly available forecastswhile forecasts issued by the latter five agencies are notpublicly available.2.1Publicly-available forecastsColorado State University (CSU)CSU has been issuing North Atlantic basin seasonal hurricane forecasts since 1984. Forecasts are currently issuedin early April, with updates then provided in early June,July and August. These forecasts use a blend of statisticalmodeling based on historical atmosphere/ocean data suchas the Climate Forecast System Reanalysis (CFSR) (Saha etal. 2010), the European Center for Medium Range WeatherForecasts Interim Reanalysis (ERA-Interim) (Dee et al.2011), and the National Oceanic and Atmospheric Administration (NOAA) optimum interpolation (OI) sea surfacetemperature (SST) (Banzon et al. 2016). In addition, CSUincorporates an analog year selection process wherebyobserved and projected climate indices are compared withprior hurricane seasons. Lastly, CSU examines dynamicalmodel predictions of El Niño-Southern Oscillation (ENSO)and North Atlantic SST and sea level pressure (SLP) patterns and qualitatively adjusts its predictions based on theseoutlooks. CSU is currently developing a statistical/dynamical model based on output from the ECMWF SEAS5 thatwill be used in real-time in 2019.Most of CSU’s predictors relate closely to ENSO andNorth Atlantic SSTs, with more active Atlantic hurricaneseasons associated with warmer-than-normal waters in thetropical Atlantic and cooler-than-normal waters in the central and eastern tropical Pacific. This combination of SSTanomaly patterns also tends to reduce (increase) verticalwind shear in the Atlantic. Too much vertical wind shearis known to be detrimental for hurricane formation andintensification (e.g., Klotzbach et al. 2017 and referencestherein).CSU’s forecasts have been issued in real-time since 1984and have shown skill since their inception (Klotzbach andGray 2009) when compared to climatology or the previous 5-year and 10-year means. CSU’s real-time forecastshave also shown competitive skill to those demonstratedby Tropical Storm Risk (TSR) and NOAA in recent years(Figure 1) (Klotzbach et al. 2017). Seasonal forecasts issued in real time by all three agencies from 2003-2018 haveshown low levels of skill in early April (r 0-0.2), modestskill in early June (r 0.2-0.4), and moderate to high levelsof skill in early August (r 0.5-0.8). Figure 2 displays earlyAugust seasonal forecasts for the number of named stormsissued in real time by CSU compared with observations.
136Tropical Cyclone Research and ReviewVolume 8, No. 3Table 1. Forecast agencies, TC basins predicted, metrics forecast, techniques used, and websites where the forecasts are published.Forecast AgencyColorado State UniversityTC Basins PredictedNorth AtlanticNational Oceanicand AtmosphericAdministrationTropical Storm RiskNorth Atlantic, EasternNorth PacificUK Met OfficeNorth Atlantic, EasternNorth Pacific, Western North Pacific,South Indian, Australia, South PacificAustralia, South PacificAustralian Bureauof Meteorology/University ofMelbourneNorth Atlantic, WesternNorth PacificCity University ofHong KongWestern North PacificHong Kong ObservatoryWestern North PacificEuropean Centrefor MediumRange WeatherForecastsNorth Atlantic, EasternNorth Pacific, Western North Pacific,South Indian, Australia, South PacificNorth Atlantic, EasternNorth Pacific, Western North PacificGeophysical FluidDynamics LaboratoryJapan Meteorological AgencyShanghai TyphoonInstitute of ChinaMeteorologicalAdministrationNational tern North PacificWestern North PacificWestern North PacificMetrics ForecastBasinwide activity; ContinentalUS and Caribbean landfallprobabilityBasinwide activityBasinwide activity;Continental US landfalling acti vity; Caribbean Lesser Antilles landfalling activityBasinwide activityGlobal map for increased/decreased risk of tropical cyclone tracksAustralian region and sub-regionactivity; South Pacific Regionand sub-region activityBasinwide activity;Landfall numbers for 3 sectionsof East Asian coastAnnual number of tropical cycloneswithin 500 km of Hong KongBasinwide activityGlobal map of increased/decreased risk of tropical stormstrike probabilityBasinwide major hurricaneactivity; Continental US landfalling activity; East Asianlandfalling activityBasinwide activity and subregion activityBasinwide activity; Number ofTCs making landfall in Chinaand affecting subregionsBasinwide activity (number, intensity, track); Annual numberof tropical cyclones affectingthe Korean peninsulaTechniques UsedStatistical, Statistical-DynamicalForecast Websitehttp://tropical.colostate.eduStatistical, StatisticalDynamical, ones/australia/archive.shtmlSouth k/tc forecast/forecast.htmDynamicalStatistical, l-Dynamical, DynamicalDynamicalStatistical, Statistical-Dynamical,DynamicalStatistical, f.htmhttps://www.ecmwf.int/en/forecasts/chartsOnly available to member countriesand commercial users.Only available internally to forecasters at NOAAOnly available internally to forecastersat the Japan Meteorological AgencyOnly available internally to forecasters at the China MeteorologicalAdministrationOnly available to the fourteen member countries under the ESCAP/WMO Typhoon Committee's perennial operating plan.Only available internally to the forecasters at the Korea Meteorological Administration
September 2019Klotzbach et al.137Fig. 1. Real-time skill of North Atlantic seasonal tropical cyclone outlooks assessed for the 16-year period 20032018. The skill of the seasonal outlooks issued by CSU (red lines), Tropical Storm Risk (TSR, blue lines) and theNational Oceanic and Atmospheric Administration (NOAA, green lines) are compared for (a) ACE, (b) major hurricanenumbers, (c) hurricane numbers and (d) named storm numbers. The skill is shown as the Pearson correlation (r)between the forecast values (issued separately in early April, early June and early August) and the observed values.Fig. 2. Real-time named storm forecasts from CSU issued in early August compared with observations from 19842018. The correlation between predicted and observed North Atlantic named storms from 1984-2018 is 0.74.National Oceanic and Atmospheric Administration(NOAA)The NOAA seasonal hurricane forecasts for the NorthAtlantic and eastern North Pacific (to 140 W) basins arebased on a suite of statistical prediction tools and dynamical model forecasts and have been issued since 1998. Theprimary statistical aids for the North Atlantic are based,in part, on research detailed in Bell and Chelliah (2006).
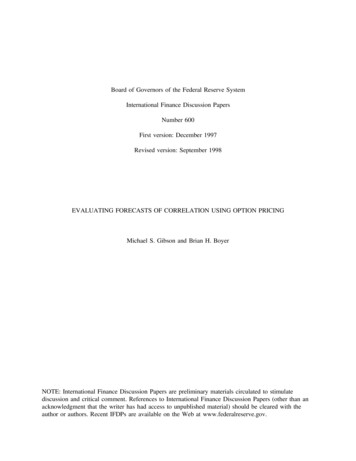
138Tropical Cyclone Research and ReviewOne of these aids is the Climate Prediction Center (CPC)statistical analog regression. A range of forecast August–October (ASO) Niño 3.4 temperatures, ASO tropical Atlantic SSTs, and the forecast ASO tropical Atlantic differencefrom global tropical SSTA (usually a range of 0.5 C isused) are considered. The eastern North Pacific CPC statistical analog regression is based on a range of projectedASO Nino 3.4 and Nino 3 SSTs. These predictors are thenregressed upon years with similar climate conditions toprovide one statistical forecast, along with a likely range.NOAA’s North Atlantic operational seasonal forecastshave demonstrated skill in real-time over the period from2003-2018 (Figure 1), with a correlation of 0.39 betweenthe mid-May forecast and observed named storms, increasing to a correlation of 0.83 for named storm outlooks issued in early August. The eastern North Pacific seasonalforecasts for ACE issued in mid-May have correlated withobserved ACE at 0.73 from 2005-2018, and forecasts fornamed storms have correlated at 0.75 from 2005-2018.One unique aspect of the NOAA forecast is its use of thehigh-resolution CFS-T382 model. The model is run for2-3 weeks prior to the May and August forecasts, and theseforecasts are collected as an ensemble of large-scale predictions, including shear and SST, along with a count of TCsand overall activity. Finally, the GFDL-FLOR (Vecchi etal. 2014) and HiFLOR (Murakami et al. 2015, 2016a) forecasts, plus the ECMWF, NMME, and UKMET seasonalforecast models are also used for both ASO climate conditions and total storm and activity counts in making the seasonal hurricane forecast. After all of these forecast aids arecompiled, subjective adjustments are made, and the forecast is a consensus of 6 forecasters throughout NOAA offices in the Climate Prediction Center, National HurricaneCenter and the Hurricane Research Division. The Atlanticseasonal forecasts are issued in mid-May and updated inearly August. The eastern North Pacific seasonal forecastis issued in mid-May.The Climate Prediction Center and the Central PacificHurricane Center jointly issue a seasonal hurricane forecastfor the central North Pacific basin (defined to extend from140 W to the International Date Line). The outlooks arebased on climate analogs using the Niño 3 and Niño 3.4region predicted SST anomalies for the July-Septemberand August-October periods. They also reflect the expectedseasonal activity in the eastern North Pacific (to 140 W)hurricane region.Tropical Storm Risk (TSR)TSR, based at University College London in the UK, hasissued public outlooks for seasonal TC activity in the NorthAtlantic and WNP basins since 2000. TSR forecasts basinwide TC activity (comprising numbers of storms of different strengths and the Accumulated Cyclone Energy (ACE)index (Bell et al. 2000)) and U.S. landfalling TC activity.The TSR forecast models are statistical in nature and areVolume 8, No. 3underpinned by predictors that have sound physical links tocontemporaneous TC activity. Outlooks are issued in deterministic and tercile probabilistic form. For the North Atlantic, TSR issues seasonal forecasts in early December, earlyApril, late May, early July and early August. For the WNP,TSR issues seasonal outlooks in early May, early July andearly August. All historical TSR seasonal TC forecasts areavailable online at www.tropicalstormrisk.com/forecasts.html thereby allowing assessments to be made of the TSRreal-time forecast skill for the period 2000-2018. TSR’sreal-time forecast skill was shown to slightly exceed thoseof CSU and NOAA for ACE based on data from 2003-2014(Klotzbach et al. 2017).The TSR seasonal model for North Atlantic TCs is sophisticated for a statistical model. The model divides theNorth Atlantic basin into three regions: (1) the tropicalNorth Atlantic; (2) the Caribbean Sea and Gulf of Mexico;and (3) the ‘rest’ region which comprises the North Atlanticarea outside regions (1) and (2). TSR employs separate outlook models for each of the three regions before summingthe regional hurricane outlooks to obtain an overall NorthAtlantic hurricane outlook. The two main predictors usedby TSR in making its seasonal outlooks are: (1) The forecast speed of the trade winds for July-August-Septemberfor the region 7.5-17.5 N, 100-30 W. The trade winds blowwestward across the tropical Atlantic and Caribbean Seaand influence cyclonic vorticity and vertical wind shearover the main hurricane track region; (2) The forecast SSTfor August-September for the region 10-20 N, 60-20 Wbetween West Africa and the Caribbean where many hurricanes develop during August and September. Waters hereprovide heat and moisture to help power the developmentof storms within the hurricane main development region.The nature of the TSR model is shown in Figure 3 and isFig. 3. Nature of the TSR statistical model for replicating North Atlantic seasonal hurricane activity. The figure displays the two AugustSeptember environmental field areas that the TSR model employsmost often in producing a seasonal hurricane outlook. The figure alsodisplays the anomalies in August-September SST (color coded in C)and 925 hPa wind (arrowed) linked to active Atlantic hurricane years.Figure taken from Saunders and Lea (2008).
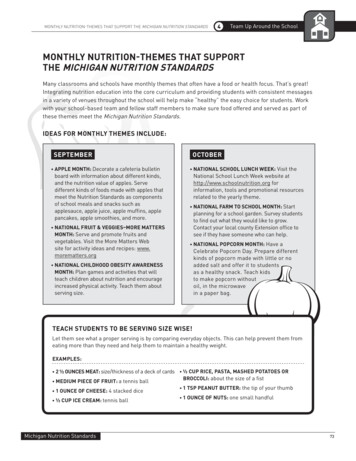
September 2019Klotzbach et al.described further in Lea and Saunders (2004, 2006), Saunders (2006) and Saunders and Lea (2008). The basis for thetrade wind speed being the environmental field that bestreplicates long-term hurricane activity is given in Saunderset al. (2017).The skill of the TSR publicly-released seasonal outlooksfor North Atlantic hurricane activity is shown in Figure 1assessed for the 16-year period 2003-2018. The TSR realtime skill (like that of CSU and NOAA) is low from earlyApril but increases to moderate-to-good skill by early August (prior to the most active part of the hurricane season).Overall TSR has the most skillful prediction of ACE, whileNOAA has the best named storm predictions in early August. Assessment of the TSR replicated real-time skill forthe 29-year period 1980-2018 shows similar but slightlyhigher correlation skills compared to Figure 1. The 29-yearcorrelation skills for ACE are 0.36, 0.61 and 0.72 for earlyApril, early June and early August forecasts respectively.TSR outlooks for US landfalling TC activity issuedbetween December and July employ a historical thinningfactor between ‘tropical’ North Atlantic activity and USlandfalling activity. The TSR outlook for US landfallingactivity issued in early August employs the persistence ofJuly steering winds (Saunders and Lea, 2005). These windseither favor or hinder evolving hurricanes from reachingUS shores during August and September. The replicatedreal-time correlation skill for predicting the US ACE Indexfrom early August assessed for the 39-year period 19802018 is r 0.53.TSR outlooks for WNP TC activity are made as follows.Predictions of intense typhoon numbers and the ACE indexare made using the forecast value for the August-SeptemberNiño 3.75 region (5 S-5 N, 140 W-180 W) SST and thecurrent year-to-date ACE index (July and August outlooks).Typhoon numbers and tropical storm numbers are forecasted using the Niño 3 region SST from the prior Septemberand the forecast number of intense typhoons. Above average (below average) Niño 3.75 SSTs are associated withweaker (stronger) trade winds over the region 2.5 -12.5 N,139120 E-180 E. These in turn lead to enhanced (reduced)cyclonic vorticity over the WNP region where intense typhoons form. Figure 4 shows the skill of the TSR publiclyreleased seasonal outlooks for WNP ACE and intense typhoon numbers assessed for the 16-year period 2003-2018(the same period as in Figure 1). This shows low predictionskill from early May but good prediction skill (r 0.65 to0.75) by early July. The correlation skill for typhoon numbers (not shown) is lower, reaching 0.35 by early August.UK Met OfficeThe UK Met Office has been issuing seasonal TC forecasts for the North Atlantic annually to the public since2007 (Camp et al. 2015). These forecasts are made available through the Met Office website ne. The forecasts are producedusing output from the Met Office Global Seasonal forecastsystem GloSea5 (MacLachlan et al 2015, Williams et al2015), which is a fully coupled ocean-atmosphere-landensemble prediction system with 60 km horizontal resolution in the atmosphere and 0.25 in the ocean. Forecastproducts include numbers of named storms, ACE (since2009) and numbers of hurricanes (since 2013). Verificationof real-time TC frequency forecasts issued by the Met Office between 2007 and 2018 is shown in Figure 5. Over the12 years of forecasts, 10 have verified well with observedvalues falling within the range predicted. More recently,GloSea5 provided useful guidance on the extremely active2017 North Atlantic hurricane season, in particular predicting the enhanced frequency of observed TC tracks acrossthe northeast Caribbean at more than 3 months lead time(Camp et al. 2018).In 2015, the Met Office expanded its seasonal TC forecasts to include all ocean basins around the world (Campet al. 2015). These are made available to forecasters internally at the Met Office, as well as to the National HurricaneCenter. Forecasts include the number of TCs, the numberof hurricanes and ACE, as well as spatial track frequencyanomalies, for the forthcoming 6-month period. Figure 5Fig. 4. Real-time skill of the TSR seasonal outlooks for western North Pacific (WNP) (a) ACE and (b) intensetyphoon numbers assessed for the 16-year period 2003-2018. Skill is shown as the Pearson correlation (r) between theforecast values (issued separately in early May, early July and early August) and the observed values.
140Tropical Cyclone Research and ReviewVolume 8, No. 3Fig. 5. Example (a) TC frequency forecasts for the North Atlantic, eastern North Pacific, western North Pacific,southwest Indian ocean, Australian region and South Pacific (forecast ensemble mean and 70% range in green; 19812010 climatology in orange), and (b) spatial track frequency anomalies relative to model climatology (1993-2015).Forecasts issued on 1 September 2018 for the period October 2018-March 2019. (c) Realtime North Atlantic seasonalTC frequency forecasts (ensemble mean and forecast range in red) and corresponding observations (black line) issuedby the UK Met Office for the period July-November 2007 to 2010 and June-November 2011 to 2018.
September 2019Klotzbach et al.shows example global forecasts of TC numbers and spatialtrack frequency anomalies issued in September 2018 forthe period October 2018-March 2019. These forecasts areupdated on a monthly or weekly basis as required.Realtime verification is provided alongside each forecast.Overall, GloSea5 shows significant skill for predictions ofACE over the hindcast period June-November 1993-2015,with correlations exceeding 0.8 in the eastern North Pacificand 0.7 in the North Atlantic. Hindcast skill of TC numbersalso exceeds 0.6 in the North Atlantic. Recent research hasshown that GloSea5 exhibits significant skill for predictions of TC landfall in the Caribbean (Camp and Caron2017) as well as the WNP for the period June-August whenusing the WNP subtropical high (WPSH) as a predictor(Camp et al 2019). Following this research, trial seasonalforecasts of TC landfall risk for East Asia are now beingdeveloped for the 2019 typhoon season. The Met Office arealso expanding its range of seasonal TC forecast products,with major hurricane frequency forecasts and spatial ACEindex anomalies being released ahead of the 2019 Atlantichurricane season.Australian Bureau of Meteorology/The University ofMelbourneTC season outlooks are issued operationally by the Australian Bureau of Meteorology (BoM) for November to theend of April (Southern Hemisphere TC season) for the Australian Region (AR) since 2009 archive.shtml) and for the SouthPacific Ocean (SPO) since 2010 fic/archive.shtml).The statistical seasonal TC forecast model used by theBoM described in Kuleshov et al. (2009) applies lineardiscriminant analysis (LDA) to identify the historical relationship between observed numbers of TCs and indices(predictors) describing the state of ENSO. The ENSOpredictors employed in the Bureau’s statistical predictionmodel are the Southern Oscillation Index (SOI) and equatorial SST anomalies in the Niño 3.4 region (N34). TheLDA technique is applied in the Bureau model to identifythe relationship between the JAS mean of an ENSO predictor (either SOI or N34) and the observed number of TCs ina TC season in a region/sub-region over a training period.The resulting statistical relationship is then applied to apredictor value for a JAS period subsequent to the training period to yield predictions for the probability that thenumber of TCs in the forthcoming season is greater thanthe median over the training period and for the number ofTCs in that season. The skill of the predictions was evaluated over a 30-year hindcast period using a leave-one-outcross validation approach. TC predictions show some skillfor the western Australian sub-region (5 -40 S, 90 -125 E)and the Australian region as a whole (5 -40 S, 90 -160 E),however the value over climatology can be small.The use of support vector regression (SVR) models,141exploring new explanatory variables and the non-linear relationships between them, the use of model averaging, andlastly the integration of forecast intervals based on a biascorrected and accelerated non-parametric bootstrap havebeen investigated, aiming to improve skills of operationalTC seasonal forecasts issued by the BoM for the Australianregion and the South Pacific Ocean, as well as sub-regionstherein (Wijnands et al 2015). Hindcasting analyses showedthat the SVR model outperforms several benchmark methods. Analysis of the generated models shows that the Dipole Mode Index, the 5VAR index (an index that combinesthe mean sea level pressure from Tahiti and Darwin as wellas the Niño 3, Niño 3.4, and Niño 4 indices) and the Southern Oscillation Index are the most frequently selected asexplanatory variables for TC seasonal forecasting in all regions. For both the AR and the SPO, normalized root meansquared error (nRMSE) statistics for the hindcast analysesfor 2003/2004 to 2013/2014 indicates that SVR has betterskill than LDA: in the AR, nRMSE was 0.93 and 1.25 forSVR and LDA, respectively; in the SPO, nRMSE was 0.83and 0.94 for SVR and LDA, respectively (Wijnands et al2015). Overall, the new SVR methodology is an improvement over the current linear discriminant analysis modelsand has the potential to increase the accuracy of seasonalTC forecasts in the AR and the SPO.City University of Hong KongSince 2000, the Guy Carpenter Asia-Pacific ClimateImpact Centre (GCACIC) of the City University of HongKong has been issuing a seasonal forecast for TC activityfor the WNP. For the period 2000-2011, the forecast wasfor annual WNP TC activity based on a statistical modeldeveloped by Chan et al. (1998) and later modified (Chanet al. 2001). However, because of the decreasing trend inWNP TC activity since 1997, the statistical model generally over-predicted such activity. Therefore, the statisticalforecast was stopped in 2011.Huang and Chan (2014) then developed a dynamicalseasonal TC activity forecast model based on RegionalClimate Model Version 3 (RegCM3). In addition to theTC activity for the entire WNP, the model also producesforecasts of the number of landfalling TCs in East Asia.Three regions are defined: South (southern China, Vietnam and Philippines), Middle (eastern China) and North(Korean Peninsula and Japan). Because the model uses asboth initial and lateral boundary conditions the US ClimateForecast System (CFS) global model forecasts, which runsonly seven months from the initial time, the forecasts canonly be issued for six months (with the initial month usedas spin up
seasonal TC forecasts have shown good skill by July for basinwide intense typhoon numbers and the ACE index when evaluated for 2003-2018. Both hindcasts and real-time forecasts have shown skill for other TC basins. A summary of recent research into forecasting TC activity beyond s