Transcription
September 30, 2020Pennsylvania SERSInvestment Measurement ServiceQuarterly ReviewInformation contained herein includes confidential, trade secret and proprietary information. Neither this Report nor any specific information contained herein isto be used other than by the intended recipient for its intended purpose or disseminated to any other person without Callan’s permission. Certain informationherein has been compiled by Callan and is based on information provided by a variety of sources believed to be reliable for which Callan has not necessarilyverified the accuracy or completeness of or updated. This content may consist of statements of opinion, which are made as of the date they are expressed andare not statements of fact. This content is for informational purposes only and should not be construed as legal or tax advice on any matter. Any decision youmake on the basis of this content is your sole responsibility. You should consult with legal and tax advisers before applying any of this information to yourparticular situation. Past performance is no guarantee of future results. For further information, please see Appendix for Important Information and Disclosures.
Table of ContentsPennsylvania SERSSeptember 30, 2020Capital Markets Overview1Active Management OverviewMarket Overview7Asset Allocation and PerformanceForeword9Actual vs.Target Asset Allocation10Actual vs.Target Asset Allocation13Quarterly Total Fund Attribution- Net14Historical Asset Allocation18Total Fund Cumulative Performance20Total Fund Cumulative Performance21Total Fund Drawdown Analysis22Total Fund Ranking24Investment Manager Returns- Net30Investment Manager Returns- Gross46U.S. EquityDomestic Equity Overview61U.S. Equity62U.S. Equity Drawdown Analysis65Current Holdings-Based Style Analysis66Domestic Equity Holdings-Based Manager Comparison67Equity Characteristics Analysis68Active Share Analysis69U.S. Equity Managers70U.S. Mid/Large Cap EquityMCM Russell 1000 Index71Current Holdings Based Style Analysis74Equity Characteristics Analysis75U.S. Small Cap EquityMCM Russell 2000 Core Index76Current Holdings Based Style Analysis79Equity Characteristics Analysis80MCM Russell 2000 Val Index81Current Holdings Based Style Analysis84Equity Characteristics Analysis85Emerald Advisers Div Small Cap Growth86Current Holdings Based Style Analysis89Equity Characteristics Analysis90
Table of ContentsPennsylvania SERSSeptember 30, 2020International EquityInternational Equity Overview92International Developed Markets EquityInternational Developed Markets Equity94International Developed Equity Drawdown Analysis97Equity Characteristics Analysis101Country Weights102Active Share Analysis103International Developed Equity ManagersWalter Scott & Partners Global Growth Equity105Equity Characteristics Analysis109BlackRock MSCI World Ex. U.S. Index110Equity Characteristics Analysis114Country Weights115Xponance Non-U.S. Small Cap116Equity Characteristics Analysis118Country Weights119Harris Assoc Int’l Small Cap Value120Equity Characteristics Analysis124Country Weights125Emerging Markets EquityEmerging Markets Equity127Emerging Markets Equity Drawdown Analysis130Equity Characteristics Analysis134Country Weights135Active Share Analysis136
Table of ContentsPennsylvania SERSSeptember 30, 2020Emerging Markets ManagersBlackRock Emerging Markets Index138Equity Characteristics Analysis142Country Weights143Leading Edge Emerging Markets144Equity Characteristics Analysis146Country Weights147Macquarie Emerging Markets Equity148Equity Characteristics Analysis152Country Weights153Martin Currie Emerging Markets Equity154Equity Characteristics Analysis158Country Weights159GlobeFlex Emerging Small Cap160Equity Characteristics Analysis164Country Weights165Private CreditPrivate Credit167Fixed IncomeDomestic Fixed Income Overview169International Fixed Income Overview170Fixed Income172Global Public Equity Drawdown Analysis174Bond Characteristics Analysis175Core Fixed IncomeCore Fixed Income178Bond Characteristics Analysis180Core Fixed Income ManagersMCM Bond Index183Bond Characteristics Analysis186PIMCO Core Bond Fund188Bond Characteristics Analysis191BMO (TCH) Corp FI193Bond Characteristics Analysis196Nominal U.S. Treasuries ManagersPIMCO U.S. Treasuries199
Table of ContentsPennsylvania SERSSeptember 30, 2020Opportunistic Fixed IncomeOpportunistic Fixed Income204Bond Characteristics Analysis206Opportunistic Fixed Income ManagersBlackstone Keystone209Brandywine Global Opportunistic Fixed Income212Bond Characteristics Analysis215Eaton Vance GMARA217Fidelity High Yield CMBS218Bond Characteristics Analysis221SEI Structured Credit: HY Bank Loans223Stone Harbor Emerging Markets Debt226Bond Characteristics Analysis229Stone Harbor Global High Yield231Bond Characteristics Analysis234Inflation Protection (TIPS)Inflation Protection (TIPS)237Bond Characteristics Analysis240Inflation Protection (TIPS) ManagersBrown Brothers TIPS243Bond Characteristics Analysis246NISA TIPS248Bond Characteristics Analysis251New Century Global TIPS253Bond Characteristics Analysis256Research & Disclosures258
Third Quarter 2020CapitalMarketsReviewCaution Needed—Hard Road Ahead!Equity Jump ProvidedSome Help to ReturnsContinued Gains, butWith a Big AsteriskLow Returns in U.S.;Muted Gain GloballyE CO NO M YI NST I T UT I O NAL I NVE S TO RSE Q UI T YF I X E D I NCO ME2468The huge jump in 3Q GDPstill leaves it 3.5% belowP A G Eits previous peak (4Q19).Employment remains more than 10million jobs short of the level reachedin the U.S. in February of this year,and many other measures of economic activity remain below pre-pandemic levels.Institutionalinvestorssaw more gains in 3Q20P A G Eas equities rebounded,but not enough to overcome laggingglobal ex-U.S. equity returns, whichhindered performance against a60% equities/40% bonds benchmark. But results over 20 years continue to match the benchmark.The S&P 500 rose in3Q20 and has gainedP A G E5.6% year to date, butwould be negative without the bigjumps of the major technology irms.Supported by low rates, globalequity returns were broadly positiveacross developed and emergingmarkets but have been muted YTD.U.S. Treasury yields wererelativelyunchanged,P A G Eand the Aggregate wasroughly lat. Corporate and CMBSwere the strongest investmentgrade sectors as investors huntedfor yield. Global ixed income roseamid rate cuts, but U.S. dollar weakness dampened hedged returns.Virus Hit All Sectors;REITs Lagged EquitiesActivity Muted byImpact of PandemicStimulus Hopes, FedBoost Risky TradesIndex’s 2Q20 Gain of15% Largest EverREAL E S TAT E / RE AL AS SET SPRI VAT E EQ UI T YHE DG E F UNDS / MACsDE F I NE D CO NT RI BUT I O N10121315All sectors experiencednegative appreciation inP A G E3Q20, but income rosefor every sector except for Hotels.Rent collection held up well for mostsectors. All property types will seean impact on vacancy rates due tothe pandemic. Most REITs trade ata discount to net asset value.Mostprivateequityactivity measures wereP A G Edown in 3Q20 comparedto the previous quarter, a patternthat also held for most year-to-datecomparisons. A rough averagingacross fundraising and privateinvestments and exits indicates a30% drop in year-over-year activity.Representing a portfolio of hedge fund interP A G Eests without implementation costs, the Credit Suisse HedgeFund Index rose 3.4% in 3Q20. As alive hedge fund portfolio, net of feesand expenses, the median managerin the Callan Hedge Fund-of-FundsDatabase Group advanced 3.7%.The Callan DC Index’srebound comes oneP A G Equarter after the largestdrop since 4Q08. The index alsohad its largest-ever increase in balances, driven primarily by robustinvestment returns. TDFs regainedtheir position atop the inlowsleaderboard.Broad Market Quarterly ReturnsU.S. EquityGlobal ex-U.S. EquityU.S. Fixed IncomeGlobal ex-U.S. Fixed IncomeRussell 3000MSCI ACWI ex USABloomberg Barclays AggBloomberg Barclays Gbl ex US9.2%6.3%0.6%4.1%Sources: Bloomberg Barclays, FTSE Russell, MSCI
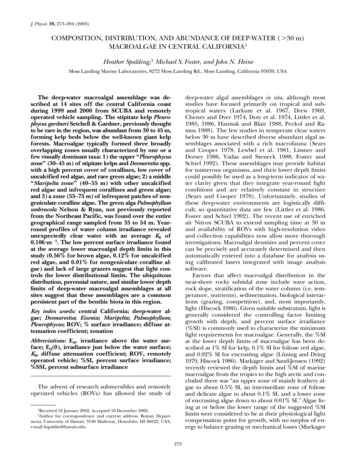
Caution—Hard Road Ahead!E CO NO M Y Jay KloepferGDP growth came roaring back in 3Q20 as expected, notchinga 33.1% gain, following the 31.4% decline in 2Q. The 3Q growthrate set a record by a wide margin (as did the decline), but theinterpretation of quarterly GDP growth is problematic whentrying to understand the true condition of the U.S. and globaleconomies. GDP is customarily reported as quarterly growth,translated to an annual rate, which helps remove some of theseasonal noise that interferes with evaluating economic activity in normal times. The past nine months have been anythingbut normal, and annualized quarterly growth rates on either sideof a global economic shutdown are perhaps less meaningful(20 Years)Quarterly Real GDP %-35%00 01 02 03 04 05 06 07 08 09 10 11 12 13 14 15 16 17 18 19 20than analyzing the level of current and future economic activity relative to that seen before the onset of the pandemic. TheSource: Bureau of Economic Analysishuge jump in 3Q still leaves GDP 3.5% below its previous peakInlation Year-Over-Year(4Q19). Employment remains more than 10 million jobs short ofthe level reached in the U.S. in February of this year, and manyCPI (All Urban Consumers)PPI (All Commodities)20%other measures of economic activity such as personal consumption remain below pre-pandemic levels.15%10%The surge in 3Q GDP clearly relects the gradual reopening ofthe U.S. and global economies that began back in May. Thesharp increases in jobs, spending, and output were concen-5%0%trated in May, June, and July. Growth in subsequent months-5%has been much more modest. High-frequency tracking of the-10%economy from the likes of GDPNow (from the Federal Reserve)and IHS Markit not only signaled slowing growth in August andSeptember, but these forecasters are now expecting 4Q GDP-15%00 01 02 03 04 05 06 07 08 09 10 11 12 13 14 15 16 17 18 19 20Source: Bureau of Labor Statisticsgrowth to cycle back down to 5% annualized.these two sectors account for just 6% of GDP, and only 2% ofThis would bring the level of GDP back close to where wethe U.S. job market as of August. The vast majority of jobs loststarted 2020, but the road forward into 2021 will be challeng-during the pandemic were in services (transportation, healthing. Growth across industry sectors, regions within the U.S.,care, inancial business, and personal) as well as hospitality andand occupations and income groups has been widely disparate.retail. These sectors are underrepresented in the stock market,Technology illustrates the dichotomy. Deined as a combinationyet they employed a substantial portion of the U.S. workforce asof the Information Technology and Communication Servicesthe pandemic struck.sectors, technology has seen lights-out performance in the stockmarket, up 22% collectively year-to-date through September,The slowdown in August, September, and into the fourth quarterand accounts for 39% of the market cap of the S&P 500. Yetcame in part from a concern by both businesses and consumers2
U. S . E CO NO M Y (Continued)about the end to the stimulus payments and to extended unem-The Long-Term Viewployment beneits in September. Without another round ofstimulus and further extension of jobless aid, growth will likelybe restrained as the economy continues to operate underIndexPeriods Ended 9/30/20Year 5 Yrs 10 Yrs 25 Yrs3Q20U.S. EquityRussell 30009.215.013.713.5S&P 5008.915.114.113.79.3in the year wanes. The increase in COVID-19 infection ratesRussell 20004.90.48.09.98.0both around the U.S. and the world, the so-called third wave,Global ex-U.S. Equitywill further burden strained medical systems and increase pan-MSCI EAFE4.80.55.34.64.6demic-related deaths. The rising tide of infections may force theMSCI ACWI ex USA6.33.06.24.0--return of more stringent restrictions at the state level to controlMSCI Emerging Markets9.610.59.02.5--10.57.06.85.35.8Bloomberg Barclays Agg0.67.04.23.65.390-Day T-Bill0.01.11.20.62.3Not all the economic news is dour as we head into the fourthBloomberg Barclays Long G/C1.212.98.87.47.7quarter. Manufacturers’ orders for durable goods have shownBloomberg Barclays Gl Agg ex US4.15.53.61.33.9considerable strength, and consumer purchases of durableReal Estategoods have been incredibly robust. Excluding capital goodsNCREIF Property0.72.06.39.49.1like defense hardware and civilian aircraft, orders for durableFTSE Nareit Equity1.4-18.23.97.99.3goods have fully recovered to pre-pandemic levels. Trade hasAlternativessurprised on the upside with a narrowing of the trade deicit,CS Hedge Fund3.42.42.83.67.3pandemic constraints and the effect from the stimulus earlierthe virus, although a sudden stop to economic activity similar toMSCI ACWI ex USA Small Cap9.3Fixed Incomewhat happened in the spring is unlikely.Cambridge PE*9.97.711.413.414.9Bloomberg Commodity9.1-8.2-3.1-6.00.9global economy. Another surprising source of strength has beenGold Spot Price5.328.711.23.86.6the housing market. Investment in new housing has alreadyInlation – CPI-U1.01.41.81.82.1even with demand for exports depressed by weakness in thereached its pre-pandemic peak, driven by low mortgage ratesand newly created demand for improved and larger housing by*Data for most recent period lags by a quarter. Data as of 6/30/20.Sources: Bloomberg, Bloomberg Barclays, Bureau of Economic Analysis, CreditSuisse, FTSE Russell, MSCI, NCREIF, Reinitiv/Cambridge, S&P Dow Jones Indicespeople leaving the urban cores of many large cities. Underlyingdemographics such as the aging baby boom and the maturationincomes, spending, and therefore production. While the jobof families in the next generation suggest this trend is near-termmarket has a long way to go to recover all the jobs lost, thein nature and will likely fade as we see some sort of resolution tounemployment rate has surprised to the positive, falling fromthe pandemic, perhaps in the second half of 2021.14.7% in April to 7.9% in September. The thorn in the job market’s side has been the number of initial unemployment claims,Government assistance targeted to aid those affected by pan-which remains stubbornly high at 837,000 in September, still fardemic-related closures helped greatly to support householdabove prior periods of stress. For reference, at the bottom of theGFC in March 2009, initial claims hit 665,000.Recent Quarterly Economic IndicatorsEmployment Cost–Total Compensation GrowthNonfarm Business–Productivity GDP ufacturing Capacity %Consumer Sentiment Index (1966 100)75.674.096.497.293.898.494.598.2* EstimateSources: Bureau of Economic Analysis, Bureau of Labor Statistics, Federal Reserve, IHS Economics, Reuters/University of Michigan3
Equity Gains Provided Some Help to 3Q ReturnsI NST I T UT I O NAL I NVESTO RS– The continuing equity rebound helped boost institutionalQuarterly Returns, Callan Database Groupsinvestors’ returns over the 12 months ending Sept. 30,8%especially compared to the negative results at the end of1Q20. Corporate plans performed the best, possibly driven6%by higher bond allocations given the performance of the4%Bloomberg Barclays US Aggregate Bond Index. Taft-Hartley2%plans trailed their peers.0%– But the exceptionally strong gains in U.S. equity did notprovide a big-enough short-term boost to investor returnsto help them match a 60% S&P 500/40% Aggregate benchmark during 3Q20, held down by lagging results for globalex-U.S. equities.– Over shorter time periods ranging up to 10 years, all inves-10th Percentile25th PercentileMedian75th Percentile90th 4.1Taft-HartleyDatabase5.85.45.04.43.8Source: Callantor types lagged the 60%/40% benchmark, but over a20-year time period, all types posted returns roughly in linewith that benchmark.– Amid the pandemic, investors are shifting their focus from“What happened?” to “What should we do now?”– Institutional investors continued to increase allocations toalternative asset classes, while interest in increasing expo-– Their liquidity needs have eased, but they are still top ofmind.sure to equities or ixed income was minimal.Callan Database Median and Index Returns* for Periods Ended 9/30/20Database GroupQuarterYear-to-dateYear3 Years5 Years10 YearsPublic Database5.02.27.56.28.17.7Corporate Database4.64.99.57.58.98.2Nonproit Database5.41.57.35.98.07.5Taft-Hartley Database5.01.67.16.48.28.1All Institutional Investors5.02.47.86.48.27.9Large ( 1 billion)4.92.88.06.88.38.1Medium ( 100mm - 1bn)5.02.47.96.58.38.0Small ( 100 million)5.22.17.66.18.07.6*Returns less than one year are not annualized.Source: Callan. Callan’s database includes the following groups: public deined beneit (DB) plans, corporate DB plans, nonproits, and Taft-Hartley plans. Approximately 10%to 15% of the database constituents are Callan’s clients. All database group returns presented gross of fees. Past performance is no guarantee of future results. Referenceto or inclusion in this report of any product, service, or entity should not be construed as a recommendation, approval, ailiation, or endorsement of such product, service,or entity by Callan.4
I NS T I T UT I O NAL I NV E S TO RS (Continued)– Investors across the board are reevaluating the purposeand the future of all asset classes:asset classes.– They are also exploring alternatives to cap-weighted passive Fixed incomeexposures to combat the concentration risk in U.S. equity. Public equity– Some have also re-introduced opportunistic buckets—with Hedge funds and liquid alternatives Private equity, private credit, and the notion of privatea zero target, up to 5% allocation—to fund opportunities ascapitalthey arise.– Fees continue to be the top issue for DC plan sponsors. But– Asset class structures are the focus of many investors.they have expressed growing interest in investment struc-– It has been business as usual for many investors in the facetures and reducing the number of options in the plan.of political, economic, and public health upheaval; this is a– DC litigation has not slowed down during the pandemic.rational response when so much is uncertain.– Recordkeeper consolidation activity picked up in 3Q20 with– Many institutional investors are examining active vs. passive, value, and alternatives to cap-weighted passive allo-notable announcements from two key providers.– Nonproits showed growing interest in private real estate.But their appetite for ESG investing signiicantly declined,cations for their global equity structure.although there was a notable rise in the share of clients– Opportunistic allocations are making a return as investorshiring staff speciically for ESG.eye tactical investments.– Both corporate and public deined beneit (DB) plans haveprioritized funding status.– More nonproits expressed interest in private real estate.– Callan’s strategic asset allocation work with endowments– DB plans also indicated they planned to reduce their pas-and community foundations is focused on evaluating invest-sive exposure, a shift from previous quarters.ment portfolios that can support the desired distribution– More corporate DB plans are putting their liability-drivenrate in order to balance intergenerational equity. Subduedinvesting (LDI) plans on hold, and there was a reduction inexpectations for capital markets returns are challengingLDI interest for corporate DB plans amid concerns aboutboth the risk tolerance of the organization and the sustain-the impact of a continued low-rate environment.ability of established spending rates.– Public DB plans continued to focus beyond the traditionalAverage Asset Allocation, Callan Database Groups2.6% y 11.6%1.2%y1.5%3.0%2.6% de ds .5%27.8%10.0%3.1%*Latest median quarter returnNote: charts may not sum to 100% due to roundingSource: Callan29.0%Corporate4.6%*16.5%12.1%3.7%43.6%4.2%5
EquityU.S. EquitiesU.S. Equity: Quarterly ReturnsGains YTDRussell 3000– S&P 8.9% for the quarter, bringing YTD to 5.6%9.2%Russell 1000– Consumer Discretionary ( 15%) and Industrials ( 13%)9.5%Russell 1000 Growthdominated, with Tech ( 12%) a close third in risk-on market.13.2%Russell 1000 Value– S&P 500 YTD would be negative if not for Facebook,5.6%S&P 500Microsoft, Amazon, Alphabet, and Apple, representing 33%8.9%Russell Midcapof the return.7.5%Russell 2500– YTD, pandemic punished some sectors, rewarded others5.9%Russell 20004.9%– Tech 29% YTD; Cons. Disc. 23% (online retailers 60%)– Energy -48% amid declining crude and natural gas pricesU.S. Equity: One-Year Returns– Demand from hotels/cruise lines/airlines down as thoseindustries have dropped 40% Russell 300015.0%Russell 1000Small cap reverses to trail large cap16.0%Russell 1000 Growth– Following a stellar 2Q20 recovery, small cap trailed large.37.5%Russell 1000 Value-5.0%S&P 500– Behind large cap by a wide margin over last 12 months15.1%Russell MidcapRussell 2500Growth continues to outpace value across market capsRussell 2000– Growth, value dispersion near all-time high driven by Tech– YTD RUS1G 25% vs. RUS1V -12%4.6%2.2%0.4%Sources: FTSE Russell and S&P Dow Jones Indices– Growth stock P/E near 2x historical average across marketcaps– Today’s index concentration surpasses levels seen in the– Higher interest rates, a steeper yield curve, economicgrowth, and improving consumer conidence are among thelate 90’s Dot-Com boom.– Index concentration of the top ive names is at 5 standardcatalysts that could result in value outperforming.deviations above the 30-year average of approximately 13%.– S&P 500 Index currently delivers a dividend yield well above– Large and small value indices continue to underperformthe 10-year Treasury, which can help support current valua-large and small growth in 3Q20 and YTD.tion levels.Quarterly Performance of Industry 9%-19.7%Communication ConsumerServicesDiscretionarySource: S&P Dow Jones ndustrialsInformationTechnologyMaterialsReal EstateUtilities
E Q UI T Y (Continued)Global/Global ex-U.S. Equity– Asian currencies have maintained resiliency relative to theContinued recovery into 3Q20U.S. dollar due to better COVID-19 management and eco-– Returns broadly positive across developed and emergingnomic outlook.markets but muted YTD– Recent support from ultra-low interest rates and upwardearnings revisions– EM recovery driven by global risk-on environment; key countries within EM (China and South Korea) have better managed the pandemic– Small cap continued to outperform large as lockdownseased and business conidence improved.MSCI ACWI– Materials, Industrials, and Consumer Discretionary outper– Factor performance led by momentum (rebound) and volatility (risk-on market mentality)4.8%MSCI EAFERebound for cyclicalsformed as consumption and production resumed.(U.S. Dollar)Global ex-U.S. Equity: Quarterly Returns8.1%MSCI World7.9%MSCI ACWI ex USA6.3%MSCI World ex USA4.9%MSCI ACWI ex USA Small Cap10.5%MSCI World ex USA Small Cap10.1%MSCI Emerging Market Small CapU.S. dollar vs. other currencies11.8%MSCI Europe ex UK– U.S. dollar lost ground versus every developed market cur--0.2%rency on expectation of lower-for-longer U.S. rates due toMSCI Pacific ex JapanFed’s shift in approach toward inlation and employment.5.9%MSCI UK2.0%MSCI Japan6.9%MSCI Emerging Markets9.6%MSCI ChinaCOVID-19 exacerbated outperformance of growth vs. value12.5%MSCI Frontier Markets8.3%– Growth outpaced value by 34% year-to-date as of Sept. 30.– Extremely narrow market with performance dominated byGlobal ex-U.S. Equity: One-Year Returns(U.S. Dollar)Tech– Growth beneited from strong performance by InformationMSCI EAFETechnology (27%), while Financials (-22%) and Energy(-46%) weighed on value.been seen over the past 45 years.What may stoke value rotation?10.4%MSCI World10.4%MSCI ACWI ex USA– YTD performance gap between growth and value has notMSCI World ex USAMSCI ACWI ex USA Small Cap7.0%MSCI World ex USA Small Cap6.9%6.9%MSCI Europe ex UK-15.8%– Bond yields correlated to value/growth since the GFC4.4%MSCI UK-6.1%MSCI -6.7%JapanMSCI Emerging MarketsMSCI Pacific ex Japan6.9%10.5%MSCI China– Management of COVID-19 a key variable to recovery-2.7%– Advanced economies have struggled to contain the pandemic relative to emerging markets.3.0%0.2%MSCI Emerging Market Small Cap– Higher bond yields may be needed to drive value rebound.Key drivers: global recovery, U.S. elections0.5%MSCI ACWI33.6%MSCI Frontier MarketsSource: MSCI7
Fixed IncomeU.S. Fixed IncomeU.S. Treasury Yield CurvesTreasury yields largely unchanged– 10-year UST yield at 0.69% in 3Q20, up 3 bps from 2Q20 butSeptember 30, 2020June 30, 2020September 30, 20194%off sharply from year-end level of 1.92%– TIPS did well as inlation expectations rose from 1.34% to3%1.63%.– No rate hikes expected until at least 20232%Bloomberg Barclays Aggregate roughly lat– Corporate and CMBS the strongest investment grade sec-1%tors as investors hunted for yield– Corporate supply ( 1 trillion YTD) at a record as companiesrushed to take advantage of ultra-low interest ratesRisk-on sentiment helped high yield and loans0%051015Maturity (Years)202530Source: BloombergU.S. Fixed Income: Quarterly Returns– Non-investment grade sectors rallied, but remainedroughly lat YTD.– The high yield bond market also experienced high levels ofnet new issuance (over 120 billion YTD).Bloomberg Barclays Gov/Credit 1-3 YrBloomberg Barclays Interm Gov/Credit0.6%Bloomberg Barclays Aggregate0.6%Bloomberg Barclays Long Gov/CreditMunis boosted by favorable supply/demand dynamics0.2%Bloomberg Barclays Universal1.2%1.0%– Robust demand and muted supply of tax-exempt municipals– Issuance in taxable municipals sharply higher– Tax revenues better than expected, but challenges remainand stimulus uncertain (but needed)CS Leveraged Loans4.1%Bloomberg Barclays Corp. High Yield4.6%Bloomberg Barclays US TIPS3.0%Sources: Bloomberg Barclays and Credit SuisseHigh yield trended higher in quality– BB/Ba-rated debt, the highest-quality category within highyield, experienced a surge of new issuance as 2020 remainsa year of record new issuance across corporate debt.U.S. Fixed Income: One-Year ReturnsBloomberg Barclays Gov/Credit 1-3 Yr3.7%Bloomberg Barclays Interm Gov/Credit6.3%– Reconstitution of downgraded investment grade debt intohigh yield has also added to the category.– BBs now represent over half of the Bloomberg Barclays USHigh Yield Index.– Historically, composition changes have generated marketineficiencies that managers can seek to exploit.Bloomberg Barclays Aggregate7.0%12.9%Bloomberg Barclays Long Gov/Credit6.7%Bloomberg Barclays UniversalCS Leveraged LoansBloomberg Barclays Corp. High Yield0.8%3.3%Bloomberg Barclays US TIPSSources: Bloomberg Barclays and Credit Suisse810.1%
F I XED I NCO M E (Continued)Default rate has trended higher, but below GFC levelsChange in 10-Year Global Government Bond Yields– Additionally, spreads at the height of COVID-19 implied2Q20 to 3Q20a 16.8% default rate, but thus far defaults have been wellbelow market expectations at 5.8%.3 bpsU.S. Treasury-7 bpsGermany6 bpsU.K.High yield spreads have rallied; managers are putting agreater focus on security selection3 bpsCanada-1 bpsJapan– Recovery rates remain low relative to the 30-year average,concentrated within pandemic-sensitive sectors (particularlySource: Bloomberg Barclaysretail and energy) and subordinated debt.– The ratio of downgrades to upgrades is higher than in 2008.Global Fixed IncomeGlobal Fixed Income: Quarterly ReturnsBloomberg Barclays Global AggregateRate cuts spur gainsBloomberg Barclays Global Agg (hdg)– Central banks continued to act aggressively to provide sup-Bloomberg Barclays Global High Yieldport via rate cuts, asset purchase programs, and other formsBloomberg Barclays Global Agg ex USof stimulus.2.7%0.7%4.3%4.1%JPM EMBI Global Diversified2.3%– Broad-based U.S. dollar weakness dampened hedgedreturns as the USD lost 4% versus the euro and the Britishpound, and 2% versus the yen.– Over 70% of global sovereign debt has negative real yields,a record high, according to JP Morgan.Emerging market debt made up ground– Emerging market debt indices gained in 3Q20 but remaindown from year-end.– U.S. dollar-denominated index (EMBI Global Diversiied)outperformed local currency as U.S. rates fell; returns weremixed across the 70 constituents, but most were positive.JPM GBI-EM Global DiversifiedJPM EMBI Gl Div / JPM GBI-EM Gl Div1.5%JPM CEMBI2.7%Sources: Bloomberg Barclays and JPMorgan ChaseGlobal Fixed Income: One-Year ReturnsBloomberg Barclays Global Aggregate6.2%Bloomberg Barclays Global Agg (hdg)4.1%2.9%Bloomberg Barclays Global High Yield– Local currency index (GBI-EM Global Diversiied) was upBloomberg Barclays Global Agg ex USslightly but returns varied widely among constituents (Russia:JPM EMBI Global Diversified-8%; Brazil: -3%; Mexico and S. Africa: 6%).0.6%-1.4%5.5%1.3%JPM GBI-EM Global Diversified– Staggered inclusion of China bonds continued with theweight rising to 7% in the JPM GBI-EM Global DiversiiedIndex.-0.1%JPM EMBI Gl Div / JPM GBI-EM Gl DivJPM CEMBI5.6%Sources: Bloomberg Barclays and JPMorgan Chase9
Pandemic Hit All Sectors; REITs Gained but Trailed EquitiesRE AL E S TAT E / REAL ASSET S Munir Iman– 3Q rent collections showed relatively stable income through-All sectors saw negative appreciation– Pandemic’s impact relected in 3Q20 resultsout the quarter in the Industrial, Apar
sectors, technology has seen lights-out performance in the stock market, up 22% collectively year-to-date through September, and accounts for 39% of the market cap of the S&P 500. Yet these two sectors account for just 6% of GDP, and only 2% of the U.S