Transcription
Hindawi Publishing CorporationAdvances in Decision SciencesVolume 2014, Article ID 537605, 17 pageshttp://dx.doi.org/10.1155/2014/537605Research ArticleThe Effects of Total Quality Management Practices onPerformance and the Reasons of and the Barriers to TQMPractices in TurkeyEsin Sadikoglu and Hilal OlcaySchool of Business Administration, Gebze Institute of Technology, 41400 Kocaeli, TurkeyCorrespondence should be addressed to Esin Sadikoglu; e.sadikoglu@gyte.edu.trReceived 24 April 2013; Revised 20 September 2013; Accepted 1 January 2014; Published 16 March 2014Academic Editor: David BulgerCopyright 2014 E. Sadikoglu and H. Olcay. This is an open access article distributed under the Creative Commons AttributionLicense, which permits unrestricted use, distribution, and reproduction in any medium, provided the original work is properlycited.Previous studies reported mixed and ambiguous results of the relationship between TQM practices and performances. This studyinvestigated impacts of TQM practices on various performance measures as well as the reasons and the barriers of the TQMpractices of firms in Turkey. We used a cross-sectional survey methodology in this study, and the unit of the sample was atthe plant level. The sample was selected from the member firms to Turkish Quality Association and the firms located in theKocaeli-Gebze Organized Industrial Zone. We obtained 242 usable questionnaires, with a satisfactory response rate of 48.4 percent.We conducted exploratory factor analysis and multiple regression analysis. This study has shown that different TQM practicessignificantly affect different performance outcomes. Results revealed that primary obstacles that the firms in Turkey face were lackof employee involvement, awareness and commitment of the employees, inappropriate firm structure, and lack of the resources.It is recommended that firms should continue implement TQM with all variables to improve performance. Firms should improveemployees’ involvement/commitment/awareness to TQM, enhance firm structure, and provide resources to overcome the barriersthat prevent effective implementation of TQM practices.1. IntroductionTotal quality management (TQM) is a firm-wide management philosophy of continuously improving the quality of theproducts/services/processes by focusing on the customers’needs and expectations to enhance customer satisfaction andfirm performance. There are mixed results about the relationship between total quality management practices and performance [1–3]. Table 1 presents a summary of relationshipsbetween TQM practices and performance. Although mostof the results of the previous studies were positive, some ofthe results were negative or nonsignificant [2, 3]. The reasonsof the mixed results can be as follows. (1) The previousstudies used different methods, different TQM variables, anddifferent performance measures in their research models. (2)They were performed in different contexts such as differentcountries and different industries. (3) The barriers to TQMpractices might have caused to the mixed results in differentstudies.Research with appropriate analytical methodologies andmeasuring tools can significantly contribute to investigating work on TQM which analyzed reasons of the relationship between TQM practices and performance. Theaims of this work are (1) finding the impact of TQMpractices on various firm performances, (2) investigating the reasons and difficulties of implementing TQMpractices by firms in Turkey, and (3) using appropriate analytical techniques and statistical analysis methodsto investigate the relationship between TQM practicesand firm performances. The paper is organized as follows. Section 1 explains the importance and purpose ofthe research. Section 2 reviews TQM practices and summarizes the results of the relationships between TQMpractices and various performance measures reported bythe previous studies. Section 2 also includes the proposedresearch model and the hypotheses related to the relationship between TQM practices and performance measures.Section 3 explains the reasons and the barriers of TQM
Phan et al.,2011 [30];cf. Sadikoglu andZehir, 2010 [3]H2:LeadershipKaynak, 2003 [1];Phan et al., 2011H4: Training [30];cf. Sadikoglu andZehir, 2010 [3]Phan et al., 2011[30];cf. Sadikoglu andZehir, 2010 [3]Samson andTerziovski, 1999[31];Ahire andO’Shaughnessy,1998 [28];Dow et al., 1999[29];Phan et al., 2011[30];cf. Sadikoglu andZehir, 2010 [3]H1: TQMpracticesPhan et al.,2011 [30];cf. Sadikoglu andZehir, 2010 [3]cf. Sadikoglu andZehir, 2010 [3]Demirbag et al.,2006 [81];Saravanan andRao, 2007 [82] ;Tarı́ and Claver,2008 [51];cf. Sadikoglu andZehir, 2010 [3]Phan et al., 2011[30];H3:Forza and Flippini,Knowledge1998 [38];and processLee et al., 2003 [8];managementcf. Sadikoglu andZehir, 2010 manceHypothesisPhan et al.,2011 [30];Kim et al.,2012 [32]cf. Sadikoglu andZehir, 2010 [3]Fuentes et al., 2006[7];MacKelprang et al.,2012 [41];cf. Sadikoglu andZehir, 2010 [3]Phan et al., 2011[30];Kim et al., 2012[32];cf. Sadikoglu andZehir, 2010 [3]Sadikoglu andZehir, 2010 [3];Prajogo and Hong,2008 [9];Santos-Vijande andÁlvarez-González,2007 [10]InnovationperformancePhan et al.,2011 [30];Kim et al.,2012 [32];cf. Sadikoglu andZehir, 2010 [3]Samson andTerziovski,1999 [31];Dow et al.,1999 [29];cf. Sadikoglu andZehir, 2010 [3]Sadikoglu andZehir, 2010 [3];Fuentes et al., 2006[7];Mohrman et al.,1995 [15]EmployeeperformanceParast andAdams, 2012[33]SocialresponsibilityDas et al., 2000[12];Phan et al.,2011 [30];cf. Sadikoglu andZehir, 2010 [3]Phan et al.,2011 [30];cf. Sadikoglu andZehir, 2010 [3]Fuentes et al., 2006[7];cf. Sadikoglu andZehir, 2010 [3]Wilson and Collier,2000 [39];cf. Sadikoglu andZehir, 2010 [3]Adam et al.,1997 [34];cf. Sadikoglu andZehir, 2010 [3]Fuentes et al., 2006[7];Mann and Kehoe,1994 [5];Agus and Sagir,2001 [13];Easton and Jarrell,1998 [16];Escrig et al.,2001 [18];cf. Sadikoglu andZehir, 2010 [3]Das et al., 2000[12];Fuentes et al., 2006[7];Mann and Kehoe,1994 [5];Choi and Eboch,1998 [11];Das et al., 2000[12];cf. Sadikoglu andZehir, 2010 [3]Parast andAdams, 2012 [33];cf. Sadikoglu andZehir, 2010 [3]Market andfinancialperformanceCustomer resultsTable 1: A summary of the hypotheses and the related literature showing positive relationships between TQM practices and performance.Tari et al., 2007[42];MacKelprang et al.,2012 [41]Zu et al., 2008 [37];Macinati, 2008[35];Zehir andSadikoglu,2012 [81];cf. Sadikoglu andZehir, 2010 [3]Zu et al., 2008[37];Powell, 1995 [36];Macinati, 2008[35];cf. Sadikoglu andZehir, 2010 [3]Kaynak, 2003 [1];Sadikoglu andZehir, 2010 [3];Choi and Eboch,1998 [11];Brah et al.,2002 [14];Hendricks andSinghal, 1997 [21];Douglas and Judge,2001 [19];Merino-Dı́az deCerio2003 [22];Sharma, 2006 [23]Aggregate firmperformance2Advances in Decision Sciences
OperationalperformanceH7: StrategicqualityplanningKannan and Tan,2005 [50];Ahire andH5: Supplier O’Shaughnessy,quality1998 [28];management Phan et al., 2011[30];cf. Sadikoglu andZehir, 2010 [3]Samson andTerziovski,1999 [31];Terziovski et al.,2003 [53];Ahire andO’Shaughnessy,1998 [28];Dow et al.,H6:1999 [29];CustomerPhan et al.,focus2011 [30];Grandzol andGershon, 1997 [52];Tarı́ and Claver,2008 [51];Das et al., 2000[12];cf. Sadikoglu andZehir, 2010 [3]HypothesisPhan et al.,2011 [30];Ittner and Larcker,1997 [55]Phan et al.,2011 [30];cf. Sadikoglu andZehir, 2010 [3]Phan et al.,2011 [30];Kim et al.,2012 [32];cf. Sadikoglu andZehir, 2010 [3]InventorymanagementperformanceSamson andTerziovski,1999 [31];Dow et al.,1999 [29];Tarı́ and Claver,2008 [51];cf. Sadikoglu andZehir, 2010 [3]EmployeeperformancePhan et al.,2011 [30];Kim et al.,2012 [32];Zehir andSadikoglu,2012 [40];cf. Sadikoglu andZehir, 2010 [3]Phan et al.,2011 [30];Kim et al.,2012 [32]InnovationperformanceTable 1: Continued.Obeng andUgboro, 2008[56]SocialresponsibilityPhan et al.,2011 [30];Forza and Flippini,1998 [38];Grandzol andGershon, 1997 [52];Tarı́ and Claver,2008 [51]Customer resultsMacinati, 2008 [35]Fuentes et al., 2006[7];Nair, 2006 [2];cf. Sadikoglu andZehir, 2010 [3]Fuentes et al., 2006[7]Market andfinancialperformanceChong andRundus, 2004 [60];Nair, 2006 [2];Zehir andSadikoglu,2012 [40];Joiner, 2007 [54]Nair, 2006 [2];Powell, 1995 [36];Zehir andSadikoglu, 2012[40]Aggregate firmperformanceAdvances in Decision Sciences3
4Advances in Decision Sciencespractices. Section 4 gives the research methodology, including population and sample, the survey instrument, datacollection procedures, and statistical analysis. Section 5 provides findings obtained from the data analysis, the explanatory factor analysis, tests for reliability and validity of theconstructs, and the multiple regression analysis. The finalSection, Section 6, presents discussion, managerial implications, future research implications, research limitations, andconclusion.2. The Relationships between TQMPractices and Performance2.1. Overall TQM Practices. Most of the previous studiesreport that overall TQM practices have positively been relatedto productivity and manufacturing performance [4, 5], quality performance [6–9], employee satisfaction/performance[3, 7], innovation performance [3, 9, 10], customer satisfaction/results [5, 7, 11, 12], competitive advantage [13, 14],market share [15], financial performance [7, 13, 16–18], andaggregate firm performance [1, 3, 11, 14, 19–23]. However,some authors have found negative or insignificant results[15, 24, 25]. Based on the literature reviewed, we propose thefollowing hypothesis.H1: TQM practices are positively related to performance.2.2. Leadership. Leaders in a TQM system view the firmas a system; support employee development; establish amultipoint communication among the employees, managers,and customers; and use information efficiently and effectively.In addition, leaders encourage employee participation indecision-making and empower the employees. Top management commitment and participation in TQM practices arethe most important factors for the success of TQM practices. Managers should demonstrate more leadership thantraditional management behaviors to increase employees’awareness of quality activities in TQM adoption and practices[26, 27].Previous studies have found that leadership improvesoperational performance [28–31], inventory managementperformance [30], employee performance [29, 31], innovationperformance [30, 32], social responsibility and customerresults [33], financial performance [34], and overall firmperformance [35–37]. Based on the literature reviewed, wepropose the following hypothesis.H2: Leadership is positively related to performance.2.3. Knowledge and Process Management. Effective knowledge management ensures that employees obtain timelyreliable, consistent, accurate, and necessary data and information as they need to do their job effectively and efficiently in the firm. Only in this way, the expected benefitsfrom TQM practices can be achieved. Process managementemphasizes activities, as opposed to results, through a setof methodological and behavioral activities. It includes preventive and proactive approaches to quality management toreduce variations in the process and improve the qualityof the product (cf. [3]). Knowledge and successful processmanagement practices monitor data on quality to manageprocesses effectively. In this way, turnover rate of purchasedmaterials and inventory can be improved. Errors or mistakesin the processes can also be figured out and corrected ontime. The processes are improved by means of controllingthe processes periodically and monitoring data on qualitycontinuously. Effective knowledge and process managementdesign minimize the negative effects on the environment.Furthermore, as the processes become prevention oriented,costs are reduced and profit of the firm increases.Previous studies have found that knowledge, processmanagement, and statistical control/feedback improve operational performance [8, 30, 38], inventory managementperformance [30], innovation performance [30, 32], socialresponsibility [33], customer results [30], competitive advantage [16], financial performance [39], and overall firm performance [35, 37, 40]. Thus, we propose the followinghypothesis.H3: Knowledge and process management are positivelyrelated to performance.2.4. Training. TQM firms should give necessary training toall their employees to improve their proficiencies in theirtasks. Effective training in management and improvementin quality bring success for the firms. Employees’ effectiveknowledge and learning capability will provide sustainabilityof quality management in the firm. Furthermore, learningorganizations adapt rapidly to the changes and developunique behavior, which distinguishes them from other firmsand enables them to obtain better results. Quality does notbegin in one department or function; it is the responsibilityof the whole firm. Training should be given to all employeesbased on the results of the training needs assessment [26, 27].With effective training, employees know the industry andthe structure of the firm. In addition, effective training willimprove employees’ loyalty to the firm, motivation, and workperformance. If employees are trained on producing reliableand high quality products and/or services, their full participation in the production stage would be more fruitful. Thus,customer satisfaction will increase and customer complaintswill reduce.Some studies report that training is positively relatedto operational performance [1, 30], inventory managementperformance [30], employee performance [7, 41], innovationperformance [30, 32], customer results [12, 30], market andfinancial performance [7], and aggregate firm performance[41, 42], while others report negative/insignificant results[43]. Based on the literature reviewed, we propose thefollowing hypothesis.H4: Training is positively related to performance.2.5. Supplier Quality Management. Supply chain management in TQM implies reducing and streamlining the supplier base to facilitate managing supplier relationships [44],developing strategic alliances with suppliers [45, 46], workingwith suppliers to ensure that expectations are met [47], and
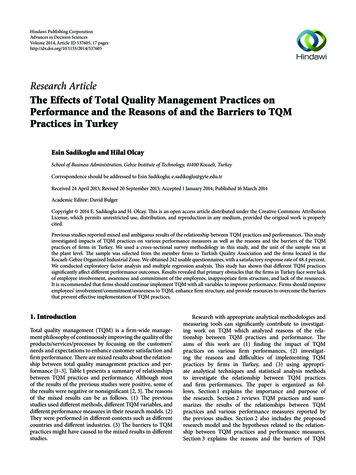
Advances in Decision Sciencesinvolving suppliers early in the product development processto take advantage of their capabilities and expertise [48, 49].Inputs from suppliers constitute the first phase of producing the products and/or services in a firm. High quality inputsprovide high quality products and/or services. Therefore, thesuppliers should adopt TQM and be involved in this process.Effective supply management practices enable the suppliersto adopt quality management and deliver reliable and highquality products and/or services timely.Previous studies have found that supplier quality management positively affects operational performance [28, 30,50], inventory management performance, innovation performance [30, 32], and overall firm performance [36, 40]. Thus,we propose the following hypothesis.H5: Supplier quality management is positively related toperformance.2.6. Customer Focus. TQM firms focus on serving theexternal customers. They first should know the customers’expectations and requirements and then should offer theproducts/services, accordingly. By the aid of successful customer focus efforts, production can be arranged with respectto the customers’ needs, expectations, and complaints. Thisencourages firms to produce high quality and reliable products/services on time with increased efficiency and productivity. When customer expectations are met, their satisfactionwill be increased, and the firm’s sales and the market share willincrease.Previous studies have found that customer focus positively affects operational performance [28–31, 51–53], inventory management performance [30], employee performance[29, 31, 51], innovation performance [30, 32, 40], customersatisfaction/results [30, 38, 51, 52], sales [51], and aggregatefirm performance [40, 54]. Based on the literature reviewed,we suggest the following hypothesis.H6: Customer focus is positively related to performance.2.7. Strategic Quality Planning. Strategic quality planningincludes vision, mission, and values of the firms. They areformed by taking into account the quality concept. Witheffective strategic quality planning efforts employees aretaken as an input in developing the vision, mission, strategies,and objectives. This facilitates acceptance and support ofstrategic quality plans by the employees. Successful strategicquality planning efforts also take into account the possibleside effects of the plan to the environment prior to the production. This will manifest and improve social responsibilityof the firm.Previous studies have found that strategic quality planning is positively associated with operational performance,inventory management performance [30, 55], society results[56], customer results, and market performance [35]. However, strategic quality planning is not statistically related toperceived performance in the computer industry [55]. Thus,we propose the following hypothesis.H7: Strategic quality planning is positively related toperformance.5Figure 1 shows the proposed research model of the relationship between TQM practices and performance measuresincluding hypotheses.3. Reasons of and Barriers to TQM PracticesThe reason of implementing TQM practices is improvingcustomer satisfaction, quality of products and/or services,productivity, capacity of the production line, employeeperformance, quality-of-work-life, market share, and competitive position. Another reason is reducing productiondevelopment time, waste of inventory, work in process, cost,delivery times, employee turnover, and complaints [3, 11, 27,40, 57]. Table 2 gives the barriers to TQM practices (cf. [57]).4. Research Methodology4.1. Measurement Instrument. We decided on leadership,knowledge management, training, supplier quality management, customer focus, strategic quality planning, continuous improvement, employee involvement, and processmanagement as the factors of TQM practices based on theliterature review. We also included multiple performancefactors, namely, operational performance, inventory management performance, employee performance, innovationperformance, social responsibility, customer results, andmarket and financial performance, to cover all aspects offirm performance. Furthermore, the TQM index, whichwas developed by Sadikoglu and Zehir [3], was used as acomposite variable of TQM practices. We adopted the itemsof the questionnaires of Ahire and Ravichandran [58], BouLlusar et al. [59], Chong and Rundus [60], Claver et al. [61],Conca et al. [62], Cua et al. [63], Das et al. [12], Kaynak[1], Prajogo and Sohal [24], Rahman and Bullock [64],Rungtusanatham et al. [43], Samson and Terziovski [31], Sila[65], Tari et al. [42], and Zu et al. [37] for both the TQM andperformance measurements. The items of the questionnairesof Anderson et al. [66], De Cerio [67], Flynn et al. [68],Fuentes-Fuentes et al. [69], Saraph et al. [70], and Taveiraet al. [71] were adopted for the TQM items, and the itemsof the questionnaires of Benson et al. [72], Kannan and Tan[50], and Terziovski et al. [53] were used for the performancemeasurement items. We inserted repeating items in eachpage of the questionnaire to figure out respondent bias andcarefulness. The initial questionnaire included 51 TQM itemsand 29 performance items, respectively. Thirty-one itemsfor the TQM practices and 27 items for the performancemeasures remained after exploratory factor analysis (EFA)and reliability analysis (appendix). The items included a fivepoint Likert-type scale anchored from (1) strongly disagree to(5) strongly agree, which indicates respondents’ disagreementor agreement with each item, respectively. Only the items ofthe reasons of and the barriers to TQM practices and thereasons of being ISO certified were open-ended questions.4.2. Population and Sample. We used a cross-sectional survey methodology in this study, and the unit of the sample was at the plant level. The sample was selected from
6Advances in Decision SciencesTQM factorsOverall TQMpracticesH1LeadershipFirm performanceH2Knowledge andprocessmanagement- Operationalperformance- InventorymanagementperformanceH3H4- EmployeeperformanceTraining- InnovationperformanceH5Supplier qualitymanagement- Social responsibilityH6- Customer resultsH7- Market and financialperformanceCustomer focusStrategic qualityplanningFigure 1: The proposed research model of the relationship between TQM practices and performance measures.the member firms of Turkish Quality Association and thefirms located in the Kocaeli-Gebze Organized IndustrialZone. The members of the Quality Association were morelikely to excel in TQM practices and to have ISO certification.We sent questionnaires to 500 firms in 2010.4.3. Data Collection Process. We refined the questionnairebased on the comments taken from the company representatives (respondents), managers, and academicians. We alsorevised the questionnaire after conducting a pilot study andtaking feedback from the respondents to make it simple, clear,understandable, and easy-to-follow. We asked the respondents about their firm’s performance data based on the lastthree years’ period with respect to their major competitor inthe industry. We promised confidentiality, and we did notask for the names of the respondents to improve accuracyof responses and response rate. Furthermore, we agreed onsending the final firm profile to the firms that participatedin the survey, on request, to obtain a high response rate.We administered the questionnaires with the guidelines ofthe follow-up stages given by Saunders et al. [73] in orderto increase response rate. Specifically, we administered thesurvey as follows. First, we informed recipients about thesurvey and questionnaire by email, telephone, or face-to-faceconversation. Second, we sent the survey with a cover letteron Monday morning, when the recipients were likely to bereceptive. Finally, we sent the questionnaire to all recipientsone week later to increase the response rate. We thankedthe early respondents and reminded nonrespondents. Wecould not post a second follow-up because we did notknow which firm responded to the survey. We sent twoquestionnaires to each firm, and we used the average of themto reduce common method bias. We obtained the responsesvia email, fax, or face-to-face meeting. We obtained 242usable questionnaires, with a satisfactory response rate of48.4 percent.4.4. Statistical Analysis. We conducted EFA to establishfactorial validity and to confirm whether or not the theorizeddimensions emerge. EFA analysis showed that the factorswere logic and reflected accurately what was intended to bemeasured. We used principle components extraction withvarimax rotation to identify factors with eigenvalues of atleast one in order to obtain more easily interpreted factorloadings. We performed a bivariate correlation analysis toidentify the correlation of TQM factors with each otherand with the measures of firm performances. We usedmultiple regression analysis for each performance measureto figure out the relationship between TQM practices andperformance. The TQM index equals the aggregate of allTQM factors [3]. We classified the reasons of and the barriersto TQM practices of firms in Turkey according to frequencydistribution of the sample.5. Results5.1. Sample Demographics. Table 3 presents the demographics of the sample. As clearly noticed in the table, most of
Advances in Decision Sciences7Table 2: Barriers to TQM practices.The main barriers to TQMpracticesFailure to incorporate qualitymanagement to alldepartmentsResistance of the workforce;inadequate use ofempowerment and teamwork;failure to develop employeeparticipationReferencesHarris, 1995 [83];Smith et al.,1994 [84]Harris, 1995 [83]; Whalen andRahim, 1994 [85]; Masters, 1996[78]; Goetsch and Davis, 2010[27]; Bohan, 1998 [86]Whalen and Rahim, 1994 [85];Masters, 1996 [78]; Bohan, 1998[86]; Burril and Ledolter, 1999[87]Inappropriate supervisoryWhalen et al., 1994 [85]; Masters,structure or culture of the firm 1996 [78]; Mcabe et al., 1998;for implementing TQMBurril and Ledolter, 1999 [87]Baillie 1986 [88]; Smith et al.,Lack of involvement and1994 [84]; Whalen and Rahim,commitment of top1994 [85]; Masters, 1996 [78];managementBohan, 1998 [86]; Goetsch andDavis, 2010 [27]Lack of understanding ofSmith et al., 1994 [84]; Masters,TQM; inappropriately1996 [78]; Bohan, 1998 [86];adopting TQM to theGoetsch and Davis, 2010 [27]organizationManagers’ resistance to learn Smith et al., 1994 [84]; Goetschand changeand Davis, 2010 [27]Inability to build a learningorganization that provides for Masters, 1996 [78]continuous improvementWhalen and Rahim, 1994 [85];Poor planningMasters, 1996 [78]Insufficient resourcesWhalen and Rahim, 1994 [85];providedMasters, 1996 [78]Ineffective measurement ofWhalen and Rahim, 1994 [85];quality improvement and lackMasters, 1996 [78]of access to data and resultsMasters, 1996 [78]; Goetsch andInappropriate reward systemDavis, 2010 [27]Short-term focus or using aMasters, 1996 [78]; Goetsch andBand-Aid solutionDavis, 2010 [27]Paying inadequate attention toMasters, 1996 [78]; Goetsch andinternal and externalDavis, 2010 [27]customersMcCabe and Wilkinson, 1998Downsizing[89]Lack of proper training andpreparationthe 242 firms (91.2%) were private firms; 75.5 percent of thefirms were international or global firms; 74.7 percent of thefirms were manufacturing firms; 53.0 percent of the firmswere large firms, who had more than 250 employees. Most ofthe respondents were quality managers (44.0%) and middlelevel managers (53.9%). Most of the firms (92.2%) were ISOcertified, 64 percent of the firms had a quality award, and 84percent of the firms did not get a firm award.Table 3: Demographic profiles of the respondents.SectorPrivatePublicScope of ryManufacturing (74.7%)Electronics and asticsFoodService ecommunicationResearch and developmentEnvironmentTourismFinanceNumber of employeesSmall (less than 100)Medium (between 100 and 250)Large (more than 250)Job titleSenior manager (top manager, vice manager)Middle managerQuality managerSales and marketing managerProduction managerHuman resources managerFinance and accounting managerOther managerLow-level managerNonmanager (engineer or technician)Existence of ISO certificationYesNoExistence of quality awardsYesNoExistence of firm awardsYesNo 217 (91.2%) 21 (8.8%)23 (9.7%)35 (14.8%)101 (42.8%)77 (32.7%)59 (24.9%)45 (19.0%)29 (12.2%)18 (7.6%)16 (6.8)6 (2.5%)4 (1.7%)16 (6.8%)9 (3.8%)8 (3.4%)8 (3.4%)8 (3.4%)5 (2.1%)3 (1.3%)2 (0.8%)1 (0.4%)56 (25.3%)48 (21.7%)117 (53.0%)27 (11.6%)125 (53.9%)102 (44.0%)4 (1.7%)3 (1.3%)3 (1.3%)1 (0.4%)12 (5.2%)63 (27.2%)17 (7.3%)202 (92.2%)17 (7.8%)144 (64.0%)81 (36.0%)35 (16.0%)184 (84.0%)The numbers in the parentheses give percentages of the correspondingvalues.
8Advances in Decision SciencesTable 4: Rotated factor matrix of the TQM practices.VariablesLeadershipKnowledgeand centage totalFactor temItemItemEigenby factorexplainednumber 1 number 2 number 3 number 4 number 5 number 6 number 7 .240.660.560.670.790.71——3.6911.9065.14Table 5: Rotated factor matrix of the firm ory managementperformanceEmployee performanceInnovationperformanceSocial responsibilityCustomer resultsMarket and financialperformanceFactor loadingsPercentage varianceItemItemItemItemItemEigen value explained by factornumber 1 number 2 number 3 number 4 number 5Percentage totalvariance 520.750.810.850.84—3.2712.1175.635.2. Results of the EFA, Reliability, Descriptive Statistics, andCorrelations. We performed EFA for TQM practices andperformance measures separately. After EFA and reliabilityanalysis, the final measurement instrument included 31 TQMitems and 27 performance measurement items. As clearlynoticed from Tables 4 and 5, the TQM items explained 65.14percent of the total variance, and performance measurementitems explained 75.63 percent of the total variance, withthe eigenvalue of more than one, respectively. Specifically,leadership included three items that explained 6.74 percentof the total variance, knowledge and process managementincluded seven items that explained 13.22 percent of the totalvariance, training included five items that explained 9.72percent of the total variance, supplier quality managementincluded five items that explained 11.27 percent of the totalvariance, customer focus included six items that explained12.29 percent of the total variance, and strategic qualityplanning included five items that explained 11.90 percent ofthe total variance. The items of continuous improvementand employee involvement were eliminated after EFA. Also,the items of knowledge management and items of processmanagement fell into one variable named as knowledgeand process management. Table 5 shows that operationalperformance had three items that explained 9.46 percent ofthe total variance, inventory management performance hadtwo items that explained 7.42 percent of the total variance,employee performance had five items that explained 12.80percent of the total variance, innovation performance had fiveite
The Effects of Total Quality Management Practices on Performance and the Reasons of and the Barriers to TQM Practices in Turkey EsinSadikogluandHilalOlcay School of Business Administration, Gebze Institute of Technology, Kocaeli, Turkey Correspondence shoul