Transcription
2The financial needsof MexicansHow do Mexicans solvetheir financial needs?September 20191
AuthorsChristine Hougaard (insight2impact)Isabelle Carboni (insight2impact)Wicus Coetzee (insight2impact)Leonard Makuvaza (insight2impact)Marco Antonio Del Río Chivardi (CNBV)Christopher Edmundo Castro Solares (CNBV)Julissa Hernández Godínez (CNBV)Yolanda Sosa Juárez (CNBV)AcknowledgementsThe authors of this report would like to thank staff at the commercialbank who provided the transactional data and valuable comments.Our sincere thanks also to Gabriela Zapata for her valuable input andreview throughout the project.Editorial Design and Style CorrectionRicardo Gómez Ortega (CNBV)Tonatiuh Estrada Sandoval (CNBV)Carlos Alberto Godínez Haro (CNBV)Publication date: September 2019.2
CONTENTSABBREVIATIONS3Contents4Executive summary5Introduction7Why measure financial needs?9Methodology12122333FindingsHow do people meet their financial needs?Use of the financial devicesWhy do these findings matter?GPFGlobal Policy Forum for Financial InclusionAFIAlliance for Financial InclusionENIFEncuesta Nacional de Inclusion Financiera(National Financial Inclusion Survey)CNBVComision Nacional Bancaria y de ValoresPOSPoint-of-sale3
The study was conducted to provide acomplementary lens into the financialinclusion landscape in Mexico, alongsidethe existing National Financial InclusionSurvey (ENIF 2018, for its acronym inSpanish) ,as well as the Mexico FinancialDiaries findings. It combined insightsfrom a survey on financial needsimplemented in the State of Puebla,with transactional data obtained from acommercial bank to make a completepicture of people’s formal and informalfinancial devices choices.The findings suggest that the formalfinancial sector is barely used to satisfythe needs of Mexicans. This is seenclearly through people’s continuedpreference for cash to transfer value. Thebias towards informal financial services,particularly assistance from friends andfamily, is also clear when people face aliquidity constraint or a financial shock.Given that, after three months, two-thirdsof respondents had yet to recover fromsuch financial shocks, and the preferencefor informal services is not sufficientto build resilience. Formal servicesare used more frequently for meetingfinancial goals, than the other needs, butthis could be further strengthened withmore use-case-specific products, such asfor housing or education.The transactional data shows thatdespite growing usage of point-of-saletransactions, much card usage remains4in ATM withdrawals to transact in cash.This confirms the survey’s findings that,whether banked or unbanked, peoplecontinue to meet their financial needsmostly in cash. In turn digital paymentsare growing for some consumersegments – income level and educationwere identified as drivers of this.Receiving an income digitally is apotential driver for digital payments.It would be necessary to analyse therelevance of policies and incentives somerchants can offer digital paymentsand expand the opportunities for noncash usage. There is an expectationthat the implementation of new instantpayment methods by the financialinstitutions generates competition withcash usage.The combination of the survey’s dataand transactional data provides insightsfor policymakers and financial serviceproviders. Taking a more customercentric perspective, by understandingpeople’s choices through the lens offinancial needs, can be used to designmore targeted financial products. Giventhe size of the needs that remain unmetby formal financial services, there isa large market opportunity as well aswelfare imperative to offer better valueto consumers, in a way that can competewith a broad presence of informalalternatives.The findings suggest that people cannotrely only on informal financial servicesto effectively solve liquidity constraints,build resilience and meet their goals. Inshort, they cannot become financiallyhealthy in the long-term without thesupport of formal financial services.However, without better formal financialservice offerings, the population willcontinue to use informal services.EXECUTIVE SUMMARYThis report outlines the findings from astudy carried out by insight2impact incollaboration with Comision NacionalBancaria y de Valores (CNBV) of Mexicoto gauge how Mexicans meet theirfinancial needs, especially when it comesto send and receive money, manageliquidity, build resilience for financialshocks, and to meet goals.
INTRODUCTIONMexico is at the forefront ofadvancing financial inclusion. In2011, the Mexican Governmenthosted the Global Policy Forumfor Financial Inclusion (GPF) of theAlliance for Financial Inclusion,which gave rise to the MayaDeclaration and the NationalStrategy on Financial Inclusion. Thisdemonstrates the concerted effortsof the Government to extend thereach of financial inclusion.The National Financial InclusionSurvey 2018 (ENIF 2018, for itsacronym in Spanish), shows that68% of working-age adults haveaccess to at least one formalfinancial product. Yet, cashcontinues to dominate the economy,with most Mexicans borrowingfrom friends and family when theirexpenses exceed their income. Thishighlights the challenges that stillneed to be addressed to ensure thatfinancial services deliver advantagesto consumers.There have been global successesin meeting financial inclusiontargets, but questions raised aboutthe impact on welfare. The 2017World Bank Global Findex Surveyrevealed that accounts holding hasnot led to regular usage of them.Mexico was not the exception, withdormancy rates of 22% in 2017.How can financial inclusion beincreased to enhance welfareeffects? Can the formal financialsector meet the financial needs inancial-diaries/This report outlines the findingsand insights from a study onfinancial needs implemented byinsight2impact in collaborationwith Comision Nacional Bancariay de Valores (CNBV). The purposeof the study was to assess the roleof the financial sector in meetingpeople’s underlying financial needs.This research complements theexisting financial inclusion data fromENIF 2018 and Mexico’s FinancialDiaries1.The study found that peoplelargely meet their financial needsin cash and outside of formalfinancial services. They choose toborrow money through their, socialnetworks instead. Those decisionsdid not show any link to a lack ofaccess nor low financial knowledge(ENIF 2018). They were rationalchoices based on preferences forinformal services that providedgreater convenience, flexibility,and sense of belonging. However,this reliance on informal financialservices has not reduced thefinancial vulnerability.This creates an imperative need todesign financial inclusion policies.The untapped market presents anopportunity for formal financialservices providers to develop moretargeted and relevant productsthat enable people to meet theirfinancial needs. For policy-makers,these insights into people’s financiallives and behaviours can contributeto strategies, programs, actions,as well as indicators that measurefinancial needs satisfaction.This report is structured as follows: Section 2 deals with the relevanceof measuring financial needs. Section 3 describes the studymethodology. Section 4 states the main findings. Section 5 sets the implicationsof the findings for the market andfinancial inclusion policies.5
6
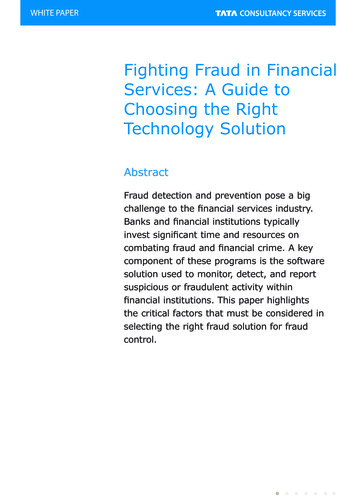
WHY MEASUREFINANCIAL NEEDS?People use financial services because these services can help them meettheir needs. Most uses of money or financial services typically fall into oneof the four financial needs2 that are the following:FinancialneedsFIGURE 11. to pay or receive payments for something (transfer of value);2. to be able to meet expenses within an income cycle (liquidity);3. to meet large expenses that have resulted from an unexpected financialshock (resilience); and4. to save for larger life goals that cannot be funded from a single incomecycle (meeting financial goals).Transfer ofvalueMeetinggoalsLiquidityResilienceThe reasons for using money are referred to as use cases. All use casescan be categorised into one of the financial needs; so, they are a way tosummarise and classify all the different use cases for analysis purposes.For example, saving for retirement, your children’s education, or buying ahouse are use cases that can be classified under the meeting-goals need.If a person expresses a use case in a need category, it is counted in thatcategory. This enables to draw broader conclusions at the needs level.Everybody meets their financial needs in some way, be it through with onsavings, credits from family and friends, by adjusting their consumption orwork patterns, or on the government’s support. These strategies are calledfinancial devices3 which are used to meet each use case.2/This categorisation corresponds largely to that identified by others. FSD Kenya, for example, through the financial diaries and other research, refers to “bridges” (liquidity), “safety nets” (resilience)and “ladders” (meeting goals) as three core functions of financial services towards financial health. CFSI (2016), also as part of a measurement framework for financial health, classifies the needto (i) spend, (ii) plan, (iii) save, and (iv) borrow. Spend spans the ability to spend less than current income and pay bills on time and in full (liquidity need). Save has a liquidity and resiliencecomponent (the ability to have sufficient liquid savings to meet day-to-day needs), as well as a meeting goals and ‘longer-term’ resilience component, (what CFSI term ‘have sufficient long-termsavings or assets’). Under borrow, they classify having a sustainable debt load and having a prime credit score (which contributes to meeting goals and resilience). Lastly, under plan it is classifiedhaving appropriate insurance (resilience need) and the ability to plan ahead for expenses (meeting goals). Follow-up research conducted to apply the CFSI framework globally, via a dedicateddemand-side survey of more than 1,000 respondents in Kenya and India as well as 89 qualitative interviews (Dalberg, 2016), lists key needs as meeting day-to-day needs plus shaping andsmoothing volatile income (corresponding to our liquidity and transfer of value categories), pursuing opportunities and building financial reserves (meeting goals) and building resilience.Likewise, CGAP (Peachey & Arora, 2016) classify functional value rendered by financial services as supporting customers to deal with health and other shocks (resilience), to balance cash flowsbetween income and expenditure cycles (liquidity) and to seize opportunities to enhance income and assets (meeting goals).3/The term was taken from the financial diaries’ methodology (see, for example, Collins et al., 2009, and Zollman, 2014), which maps all financial tools or instruments people used under the term“financial devices”.7
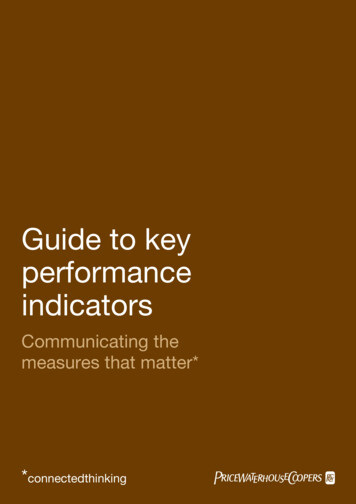
A financial device is any physical, social, or electronic mechanism that stores,accumulates, distributes, or transfers value, and can be used to meet a financialneed. Cash at home or physical assets would be a “personal” mechanism,while assistance from family and friends would be a “social” mechanism. Whilea financial device includes any financial service, it is a broader concept thanformal financial services provided by financial institutions. In short: a financialdevice is what people use to meet a financial use case.In deciding how to meet a use case, people not only consider formalfinancial products such as credit, payments, savings or insurance, but alsothe other options available to them, such as their social or family network,cash at home or liquid assets. They may use a combination of these devices,depending on the use case.Example of devicesused to meet specificuse caseFIGURE 2Figure 2 illustrates how people may use different types of devices torespond to a single use case of covering medical costs for a sick child.Child is sickLoanRelativesMedical insuranceCashFinancial devicecategoriesBox 1The needs measurement framework used in this report, explores thefinancial needs of a population and considers the uptake of different typesof financial devices to respond to use cases linked to each need. By buildinga picture of the portfolio of financial devices that people use for each need(see Box 1 for examples), insights can be drawn on how different types offinancial services complement, or substitute for, meeting each financialneed. For financial services providers, such insights highlight untappedmarket opportunities that can be used in the financial product or channeldesign. From a policymaker perspective, the framework helps to identifymarket gaps where the formal financial sector is not serving the needs of thepopulation, and guiding public policies, or regulatory strategies.FormalInformal44/When contrasting overall formal uptake toother devices, the term “informal” is alsoused broadly to refer to any device notprovided by a regulated financial institution.Thus “informal,” applied in the broad sense,groups together informal devices and socialand personal devices, such as cash.8SocialPersonalAny transaction through an authorised and supervised financial institution, such asbanks, credit unions, insurers, or savings and credit cooperatives.Any device provided by a third-party institution that is not a licensed financialservice provider, such as an informal moneylender.Borrowing or assistance from friends, family, employer, any collective orcommunity-based device such as savings clubs.Cash kept at home, at hand, or personal assets (watches, jewellery, cars, etc.)Under this framework, financial devices can also be categorised by type ofproduct: savings, payments, credits or insurances.
METHODOLOGYThis study applied a new researchapproach that combined a faceto-face survey on financial needswith transactional data from acommercial bank. It wanted tobuild a deeper understanding ofthe population’s financial lives.First step. A survey wasadministered to 1,154 adults inPuebla State, in December 2017,to analyse needs, usage, anddrivers. Insight2impact designedthe survey in collaboration withCNBV, and sub-contracted apollster enterprise to administer it.The survey’s methodology designallowed capturing a sample thatis representative of Puebla’s adultpopulation. This State was chosenas its demographics roughlyresembles that of the Mexicanpopulation to yield findings thatare indicative of the overall adultpopulation.The survey data was analysedaccording to the four financialneeds (i.e. transfer of value,liquidity, resilience, and meetinggoals), and in more detail byrelevant use cases. The findingscannot be generalized at a nationallevel and should be read alongsidethe findings of the NationalFinancial Inclusion Survey (ENIF2018).Second step. A commercial bankprovided anonymous transactionaldata from 616,867 clients (arepresentative sample of its fullclient’s base) across different typesof financial service accounts; so,insight2impact can analyse theusage patterns. This includedtransactions over a one-year periodfrom saving accounts, credit cards,insurance products, and credits,as well as the correspondingdemographic information.Transactional data from a financialservice provider complementssurvey data by providing moregranular and reliable data on actualusage patterns. The transactionaldata was used to characterisedclients, based on how intensivelythey used formal financial products,such as credit and debit cards, andtheir demographic characteristics.Third step. The survey wasadministered to an additional400 respondents drawn from thecommercial bank clients’ sample, tocreate a merged data set that linksthe same customer’s demand-sideand supply-side data. The use of amerged dataset allowed assessinghow consumers use formal andinformal devices to meet theirfinancial needs; also, to understandwith greater depth their financiallives.9
BOX 2Overview of studymethodologySurvey:Usage ntsPueblaStateSampleBooster sampleBank clients'sample1,154 adults, representative of Puebla StateFieldwork completed in December 2017400 individual bank clientsFieldwork completed in July 2018616,867 clients, transactional data for a period of 12 monthsComparison offinancial needssurvey, ENIF 2018and FinancialDiariesTABLE 1This methodology complementsboth the ENIF 2018, which isrepresentative and measures accessand uptake; also, the FinancialDiaries, which is an in-depthlongitudinal study that providesan in-depth understanding ofhouseholds’ financial decisions (seeBox 3 for an overview of findings).This study analyses quantitativefindings on the usage of financialservices to meet needs, and theoutcomes of this usage. Table1 shows how the three studiescomplement one another for adeeper understanding of thefinancial lives of the Mexicanpopulation.Insight2impact surveyin PueblaENIF 2018Financial diaries inMexicoState-wideNational and salLongitudinalSociodemographiccharacteristics Cash flow Means of payment Savings SampleSurvey typeAspects considered:10
Box 3Highlights fromMexico's FinancialDiariesInsight2impact surveyin PueblaENIF 2018Financial diaries inMexicoCredits Income sources Unforeseen expenses Saving frequency andactivity Partially included Goal achievement XRemittance transfers X Usage incentives XPartially includedSocio-economic context Partially includedRetirement savingsPartially included Financial channelsPartially included InsurancePartially included Asset ownership Reasons for no uptake/use Partially includedFinancial education Households operate on very tight budgets.On average, they earn income from over seven different sources but still struggle to smooth income.Respondents make over 85% of all purchases and financial transactions within 30 minutes’ walkingdistance from home.During the study, households on average used seven financial instruments and relied more heavily oninformal financial devices.Credit allows families to cover daily expenses, acquire assets that make their lives better, start and runsmall businesses.Due to a reliance on credit, some families channel short-term savings to credit repayments.Some households use informal savings, like savings groups, due to the rigid structures of formalfinancial products, such as minimum account balance requirements.Preparing for emergencies and achieving key aspirations such as building a home, buying land, andfinancing education are the primary motivations for saving.Transactions for saving at home are of meaningful size, suggesting a potential opportunity for formalsavings.Respondents value certainty and predictability, but at the same time, they appreciate and needflexibility in financial products.11
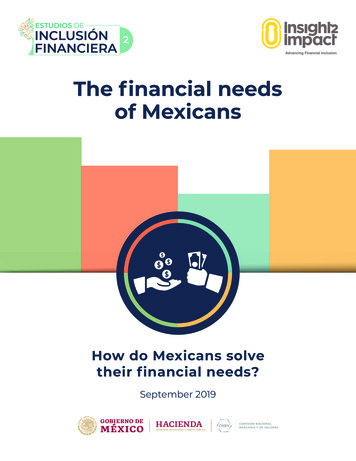
FINDINGSThis section has two parts: The first section outlines how people meet their financial needs. It uses thedata from the survey to explore common use cases and the financial devicesthat people choose. The outcomes are analised from a market perspectiveto see whether the financial sector contributes to needs satisfaction. The second section takes a closer look at the transactional data from thecommercial bank about the usage of financial products. There are statisticaltechniques to identify distinct customer segments based on the intensity ofusage of debit and credit cards. Also, there is a comparative exercise aboutthe usage of formal and informal financial devices of persons that holda saving account. It was made based in the merged data set, which linkstransactional data with the survey’s data.5How do peoplemeet theirfinancial needs?5/Note that the sample of clients in themerged data was too small to conductmeaningful statistical analysis. Thus, it wasused to derive indicative insights across thetwo data sources.12Even though Mexico has maderemarkable progress in extendingfinancial inclusion, the study offinancial needs shows that theformal financial sector is generallynot the primary channel for peopleto meet their financial needs. Cashcontinues to dominate when theyneed to make or receive payments.When people faced a financialshock or cannot meet their liquidityneeds within an income cycle, mostof them turn to their families andsocial network first, rather than toformal financial services. When itcomes to meeting goals, peopletend to use the cash saved at home,rather than formal savings or credits.This highlights a significant gap inthe market not yet served by formalfinancial services.Figure 3 shows the split betweenformal and informal financialdevices usage for each of the fourneeds. Each circle represents theadults who expressed use caseslinked to that need. For example, ofall the adults who are expressing ause case for meeting goals (such aswanting to buy a house or save fortheir children’s education), only 15%reported using a formal financialservice.
FIGURE 3Use of formalfinancial services,by adultsexpressing eachneed6Transfer ofvalueLiquidityResilienceMeetinggoals29%7%13%15%% Adults who use at least one formal financial service to meet their needsSource: Puebla Financial Needs survey (2017).To understand why the uptake offormal financial services towardsneeds is so low; first, it is neededto understand why people choosespecific services and not others.To this end, the survey includeda series of questions designed togauge the importance of certainproducts or providers attributes indetermining why people choosecertain device mixes to meet theiruse cases. This generated a largevolume of information from whichthere are the following patterns: Formal services are selected morefor their functional benefits (i.e. theproduct delivers functional value at areasonable cost).Transfer of value Informal or social devicesare chosen for their relationalbenefits (i.e., the population truststhe provider and feels a senseof belonging when using theirproduct). All socio-economic strata skewtowards the relational aspectsprovided by social devices, exceptfor the highest socio-economicsegments, which emphasisefunctional benefits instead.The following sub-sections, unpackthe details of how people meet theiruse cases in each of the four needcategories.Most respondents expressed the need to transfer cash or digital value fromone person to another. The transfer of value use cases can be grouped intohow people receive income and how they make payments. For example,the income include wages and remittances, and payments include dailypurchases such as rent, school tuitions, and utilities, as well as sendingremittances to others.The following results are based on all adults in Puebla. The bars representhow the income was received, or the payment was made: was it through adigital (formal) channel or in cash?Income6/Transfer of value n 1,139; Liquidity n 700; Resilience n 561; Meeting goals n 683Most adults receive an income in cash. For example, 37% of adults receivean income from wages, but more than three-quarters of those receive itin cash. Although a high proportion of remittances are received digitally(international 67% and domestic 64%), only a small number of adults inPuebla receive such remittances (11% and 8%, respectively). Based on this,remittances seem to be the most digitised financial service. However, a large13
How do peoplereceive theirincome?7FIGURE 4proportion of those transactions are through e-money transmitters (44%). Thisimplies a cash link, as the transaction is conducted over the counter, where asender cashes in an amount that is wired digitally and finally cashed out.100%80%60%40%20%0%Wage orsalary%Adultswith income 37%sourcePayments forproducts orservicesPaymentsfrom agovernmentprogrammeRemittancesin MexicoRemittancesfromabroadPayment forassistancefrom 4%% Received digitally% Received in cashSource: Puebla Financial Needs survey (2017).Note. The survey did not capture how value is stored once it received. Ifreceived digitally, is it converted to cash or vice versa? This line of inquirywould add value to future surveys.PaymentsCash also remains the dominant means of making payments. The two mostsignificant use cases reported for payments are daily expenses or purchases(91%) and regular payments (90%), which includes the use cases of rent,school fees, and utility payments. Both of these are predominantly paid incash (94% and 90%, respectively). Fewer adults expressed a use case forother regular payments for non-essentials such as TV and insurance (45%).Consistent with the findings on income from remittances, most people whosend money domestically (64%) or outside the country (75%) use the formalfinancial sector to do so. However, this use case represents only a smallnumber of adults (8% and 1%). Furthermore, only 25% of those who sendremittances do so via bank transfers, rather than using cash or e-moneytransmitters.87/n 1,1548/ In the case of –e-money transmitters,remitters often deposit cash with an agentor withdraw cash from agent. Therefore, thistype of transaction is distinct from an end-toend digital transaction such as an electronicbank transfer.14
FIGURE 5How do peoplemake yments (rent,utilities, school)% Adultswho makeeach type 91%of payment:Regularpayments(TV, insurance)90%Pay salaries(i.e. domesticworker)45%11%% Digital paymentsRemittancespayments withinMexicoRepaymentof informalloan8%Remittancespayments tooutside ofMexico1%4%% Cash paymentsSource: Puebla Financial Needs survey (2017).The ENIF 2018 data revealed a similar pattern, the bulk of adults in Mexico(91%) use cash as predominant payment means when making purchasesof 500 pesos or less; for purchases of 501 pesos or more, the percentagedecreases slightly to 87%.Bank account ownership, financial literacy and cash usageThe findings show that the use of cash remains high, even for those whohave an account. It complements the ENIF 2018 findings that show that cashusage is high even for those who hold an account.Cash usage byadults with andwithout bankaccount10FIGURE 6The two largest transfer of value use cases (daily expenses and regularpayments) remain heavily cash-based. As illustrated in Figure 6, 80% ofadults who have a bank account still use cash for daily expenses, which isonly slightly lower than adults without an account (87%).70%% Adults thatuse cash forregular expenses85%80%% Adults thatuse cash fordaily expenses87%0%9/20%n 1,15410/ Regular expenses n 1,154; Daily expensesn 1,145; With account n 293; Withoutaccount n 859. Note that this does notdenote exclusive cash usage.40%With account60%80%100%Without accountSource: Puebla Financial Needs survey (2017).15
Cash usage byscore of financialknowledgeFIGURE 7At the same time, ENIF 2018 reveals that usage of cash is almost the same,regardless of the financial knowledge of the respondent11. The differencebetween those adults with a high financial knowledge score (5-7 points) andthose with a low score (0-4 points) is less than 5%, as illustrated in Figure 7.94%Use cash forpurchases of 500pesos (26 USD)or less89%86%Use cash forpurchases of 501pesos (26 USD)or more0%73%20%40%60%80%100%% Adults with high score in financial knowledge (0-4 points)% Adults with low score in financial knowledge (5-7 points)Source: ENIF 2018, nationally representative.SummaryCash dominates across all transfer of value use cases. A notable proportionof adults have an account, yet the majority of them continue to makepayments in cash. Even when income or payments are primarily conductedvia the formal financial sector, as is the case for remittances, there isoften still a cash link. As the discussion in Section 4.2 shows, many digitaltransactions also involve cash-in or cash-out at an ATM.This preference for cash is not a function of low financial literacy. Froma policy perspective, strengthening an environment with more digitalpayment options and receipt of income is fundamental to reduce the useof cash. Supporting policies would need to incentivise regular paymentproviders as well as small and medium-sized merchants to offer digitalpayment solutions for customers, and must ensure that, for consumers,digital payments are just as cost-effective, convenient and ubiquitous ascash. The introduction of the CoDi instant payment system in Mexico bodeswell for digital payments to mimic and compete with cash12. However, it isabout to launch.11/ Financial knowledge is gauged in the ENIF2018 survey using the OECD methodology,as contained in the 2015 OECD Toolkit forMeasuring Financial Literacy and FinancialInclusion. The maximum score for this subindex is 7 points.12/ For an overview of the CoDi paymentsystem for Mexico, see for example,https://cbpaymentsnews.com/assets/CBPN Volume1/CBPN-December-2018Vol1 4 Web.pdf. The isight2impact study inNigeria showed rapid uptake of the instantpayment equivalent in Nigeria, NIP.16
ManagingliquidittyThe liquidity need is aboutbalancing your income andexpenses across income cycles.People use financial servicesto enable such consumptionsmoothing. When a person is unableto meet their expenses within aregular income cycle, it createsliquidity distress and triggers a needfor financial services to help regainliquidity. An important financialinclusion objective is to understandwhether people are at risk of relyingon situations that reduce their longterm wealth to stay afloat in theshort term.People experience liquidityshortages to varying degrees. Inthis sample, there is a distinctionbetween people who did notexperience a liquidity shortfallwithin the past 12 months (classifiedas “no distress”), those who reportexperiencing a liquidity constraintin one month (“some distress”) andthose who experienced it in morethan one month (“severe distress”).Device uptake byliquidity distresslevel13FIGURE 8As Figure 8 indicates, close to half ofthe population (48%) experiencedsevere distress in t
2011, the Mexican Government hosted the Global Policy Forum for Financial Inclusion (GPF) of the Alliance for Financial Inclusion, which gave rise to the Maya Declaration and the National Strategy on Financial Inclusion. This demonstrates the concerted efforts of the Government to extend the reach of financial inclusion. The National Financial .