Transcription
Stimulation of better summer comfortefficient cooling by EPBD implementationand“Alternative cooling calculationmethods: Comparative simulations”Servando ÁlvarezFrancisco José Sánchez de la FlorJosé Manuel SalmerónÁlvaro RuizAICIA- University of SevilleMarch 2010
Table of Contents1.2.3.4.5.6.7.8.IntroductionScope and MethodologySolar heat gains attenuationHeat Dissipation by intensive ventilationComfort assessment and risk of overheatingZoningConclusions and recommendationsReferences
1. IntroductionSummer comfort assessment is a very complex issue and it is not evident thatthe existing calculation methods and tools developed in the context of theregulatory procedures have the adequate level of assumptions if passivecooling concepts and strategies are to be promoted.One of the aims of task 4 is to provide guidance regarding the scope and theappropriateness of the calculation methods. The scope is discussed in subtask3.The aim of this report is to identify the modelling levels and assumptions inthe current calculation methods that are not sensitive to relevant designdecisions in summer performance, with special emphasis in passive cooling. Inother words, we will discuss those common assumptions of the calculationmethods that can become a barrier to the penetration of passive cooling inbuildings.The major reason for discussing the appropriateness of the calculationmethods in the context previously mentioned is that they are frequentlybased on previous existing methods applicable to the winter regime. Themajor difference is that the energy efficiency for heating purposes is largelybased on component level approach: high insulation, avoidance of thermalbridges, high performance low-e glazing or very low air tightness. On thecontrary, strategies for passive cooling are frequently based on zone orbuilding level approach. This is the case for solar heat gains attenuation orheat gains dissipation.2. Scope and MethodologyComparative simulations for buildings using the present regulatory calculationmethodologies as well as the alternative methodologies have been performedto help assess the differences between taking and not taking intoconsideration passive cooling strategies.The comparative calculations performed are based on the assumptions of therelated CEN standards rather than on every national calculation methodology.Regarding the CEN approaches covered, the assumptions discussed are thoseincluded as recommendations in the standards concerned, namely:prEN 15255: Thermal performance of buildings-Sensible room cooling loadcalculation. General criteria and validation procedures (version April 2007).prEN 15243: Ventilation for buildings - Calculation of room temperatures andof load and energy for buildings with room conditioning systems (version April2007).
prEN 15265 : Thermal performance of buildings - Calculation of energy needsfor space heating and cooling using dynamic methods – General criteria andvalidation procedures (version April 2007)EN-ISO 13791: Thermal performance of buildings – Calculation of internaltemperatures of a room in summer without mechanical cooling –Generalcriteria and validation procedures.EN-ISO 13790: Energy performance of buildings — Calculation of energy use forspace heating and coolingRegarding comfort, the standard concerned is EN 15251: Indoor Environmentalinput parameters for design and assessment of energy performance ofbuildings addressing indoor air quality, thermal environment, lighting andacousticsThe table below is a summary of the aspects covered by this task.TopicHeat gainsattenuationHeat Dissipationby intensiveventilationMechanisms orphenomena involvedSolar targetPosition of the thermalmassCalculation of air tionfactorsCalculation ofair flow rates(single zone,multi zone)Convection heattransfer coefficientsComfortassessment andrisk ofoverheatingClimatic dependencyof comforttemperatures for nonair-conditionedbuildingsZoningThermal couplingConstant zoneTable 1.- summary of the aspects covered in subtask 4.4ComparisonsperformedVariation of solardistribution factorsSignificance of airflow patterns(constant vs.variable convectioncoefficients) onindoortemperature.Degree- days ornumber of hoursabove fixed indoortemperature vs.degree- days ornumber of hoursabove adaptativeindoortemperature.Influence oninternaltemperature (localvs. average)
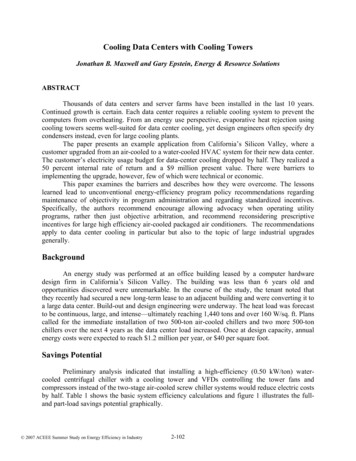
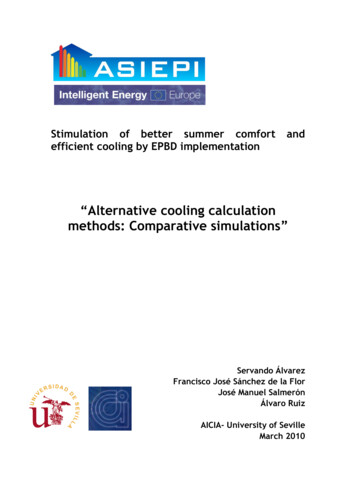
For every topic, the following aspects will be addressed: Description of the topic The topic in the CEN standards. Presentation of the comparison performed. Results and analysis Conclusions and recommendations.To perform the calculations, the algorithmic basis of the Spanish nationalcalculation tools (7) have been used, with the necessary modifications tointegrate in them the alternative assumptions and modelling levels analysed.3. Solar heat gains attenuationFigure 1 shows the evolution of the solar radiation in a room in W/m2 (y axis)throughout day (hours in x axis). The solar radiation entering (1) the enclosureis absorbed in the different components of the enclosure after redistribution(2) and is finally released to the space (3)2138070605040302010004812162024Figure 1.- Hourly evolution of the Excitaciónsolar heat gainsRespuestain a room Tao 5beforehand after being absorbedby the components of the enclosureThe design principle consists in maximizing the attenuation in order to avoidoverheating. The attenuation of the released solar heat gains depends on theinertia of the enclosure. Figure 2 (same axis as figure 1) shows the releasedsolar heat gains in an enclosure with different levels of inertia.
8070605040302010004812162024Figure 2.- Solar heat gains released to the air of the space in room s with different thermalinertia Solar gainsTao 3 hTao 5 hTao 10 hTao 15 hTao 20 hTypically, the inertia of a space is obtained from the inertia of the elementsof such space without discrimination of their actual position. It can bedemonstrated however (2) than the inertia of every element contributes tothe overall inertia in a directly proportional way to the fraction of solarradiation absorbed by such an element.The global time constant of the enclosure (i ) as: 1fr1 1 fr2 2 . frn nWhere fri is the fraction of the solar radiation absorbed by element I (calledsolar distribution factor in the CEN standards)According to this formula, if an element of heavy inertia absorbs zero or littlesolar radiation, its contribution to the overall inertia of the space isnegligible.In the CEN standards mentioned in section 5, the proposed assumption is thatthe distribution of the solar radiation in the internal surfaces of thecomponents of the room is time independent.As an example, in prEN 15255: 2007 (1) the distribution of the solar radiationis characterized by the so-called solar distribution factors as follows: ―Theheat flow rate due to the solar radiation entering through the glazing systemis absorbed by the internal surface of each envelope component. According tothe assumptions of Clause 4, the distribution of the solar radiation is timeindependent. The distribution factor is defined, for each surface, as thefraction of the solar shortwave absorbed by that surface. It depends on thesolar reflectivity of each internal surface.
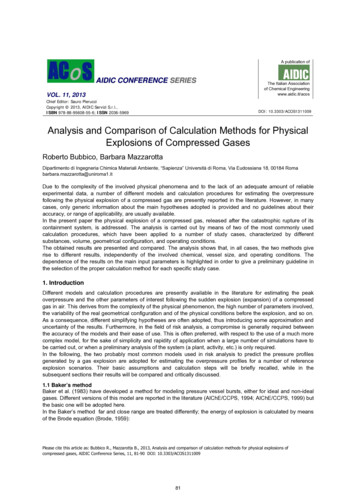
For the purposes of this standard the distribution factors should be calculatedusing the expressions in Table 2(below) , as a function of the type of thesystem, the floor colour and the area of the envelope components ―.Table 2: Solar distribution factors fdf (Table1 from prEN 15255: 2007 (1))The same approach but using a different table can be found in EN-ISO 13791(4)We have compared the solar distribution factor of table 2 with actual solarradiation redistribution of factors of different enclosures, taking into accountaspects neglected in prEN 15255 or in EN-ISO 13791 such as: Period of the year (summer, winter), Aspect ratios of the room Orientation of the glazing surfaces, Presence of furniture.Examples of the results obtained can be seen in figures 3, 4, 5 and 6Solar Distribution Factor (fdf)Width to Depth ratio: 0.5 (W 3 - D 6 - H 3)Window to Front wall ratio: 0.33SEVILLA - Orientation: SOUTH10.8FloorCeiling0.6Left wallBack wall0.4Right wallFront wall0.20WindowprEN 15255:2007Proposal (Winter)Proposal (Summer)Figure 3: influence of the period of the year on the solar distribution factor.
Solar Distribution Factor (fdf)Width to Depth ratio: 1 (W 3 - D 3 - H 3)Window to Front wall ratio: 0.33SEVILLA - Orientation: WEST1Solar Distribution Factor (fdf)0.8Width to Depth ratio: 1 (W 3 - D 3 - H 3)Window to Front wall ratio: 0.33SEVILLA - Orientation: SOUTHFloorCeiling0.6Left wall 1Back wall0.4Right wall0.80FloorFront wall0.2CeilingWindow 0.6prEN 15255:2007Proposal (Winter)Proposal (Summer)Left wallBack wall0.4Right wallFront wall0.2Window0prEN 15255:2007Proposal (Winter)Proposal (Summer)Figure 4: influence of the orientation on the solar distribution factor.Solar Distribution Factor (fdf)Solar Distribution Factor (fdf)Width to Depth ratio: 0.5 (W 3 - D 6 - H 3)Window to Front wall ratio: 0.33SEVILLA - Orientation: SOUTHWidth to Depth ratio: 1 (W 3 - D 3 - H 3)Window to Front wall ratio: 0.33SEVILLA - Orientation: SOUTH110.8Floor0.8FloorCeiling0.6Left wallBack wall0.4Right wallFront wall0.20WindowprEN 15255:2007Proposal (Winter)Ceiling0.6Back wall0.4Right wallFront wall0.20Proposal (Summer)Left wallWindowprEN 15255:2007Proposal (Winter)Proposal (Summer)Solar Distribution Factor (fdf)Solar Distribution Factor (fdf)Width to Depth ratio: 2 (W 6 - D 3 - H 3)Window to Front wall ratio: 0.33SEVILLA - Orientation: SOUTHWidth to Depth ratio: 4 (W 12 - D 3 - H 3)Window to Front wall ratio: 0.33SEVILLA - Orientation: SOUTH110.8Floor0.8FloorCeiling0.6Left wallBack wall0.4Right wallFront wall0.20WindowprEN 15255:2007Proposal (Winter)Proposal (Summer)Ceiling0.6Left wallBack wall0.4Right wallFront wall0.20WindowprEN 15255:2007Proposal (Winter)Proposal (Summer)Figure 5: influence of the aspect ratio of the room for a south oriented case on the solardistribution factor.
Solar Distribution Factor (fdf)Width to Depth ratio: 1 (W 3- D 3 - H 3)Window to Front wall ratio: 0.33SEVILLA - Orientation: SOUTH10.8FurnitureFloor0.6CeilingLeft wallBack wall0.4Right wallFront wall0.2Window0prEN 15255:2007Proposal (Winter)Proposal (Summer)Figure 6: influence of the presence of furniture (assuming 20% of the floor covered byfurniture) for a south oriented case on the solar distribution factor.It can be concluded that the solar distribution factors are considerablydependent on the season of the year and on the orientation of the glazingfacades and to a lower extent on the aspect ratio of the rooms. The presenceof furniture (perhaps as a percentage of the floor area) must be taken intoaccount as the inertia of the furniture can be very different of thatcorresponding to the other components of the room.There are significant differences between the actual values of solardistribution factors and the values in prEN 15255:2007.Finally, it is clear that the calculation methods used to evaluate properly theeffect of the inertia in order to design solar heat attenuation strategies musttake into account a more detailed redistribution of the solar radiation withinthe spaces than that proposed in the CEN standards concerned. At least, theyhave to be time dependent to set a distinction between summer and winterregimes.4. Heat Dissipation by intensive ventilationA very powerful well known strategy for reducing the cooling demand ofbuildings is the use of low outdoor air temperatures during the night to cooleither the indoor air (when the spaces air occupied during the night such asthe bed rooms) or the structures of the building (for the other spaces of thebuilding non occupied during the night).In many cases, the night-time outdoor air climatic conditions of manyMediterranean locations allow a significant compensation of the day-timesolar and internal heat gains (9). If we concentrate on spaces other than bedrooms, the major concern is the ability of the building inertia to store coolthduring the night and to use during the day the coolness produced during theprevious night.
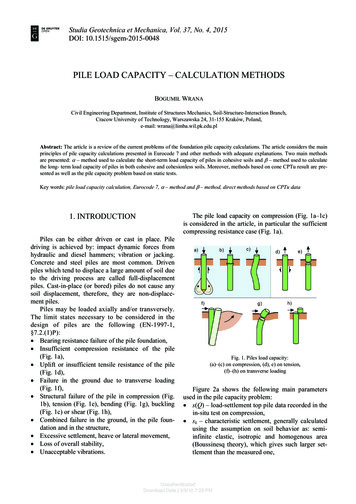
931.0.880.620.660.760.431Configuration 1Configuration 4Configuration 2Configuration 5Configuration 3Configuration 6Configuration 7Figure 7.- Different air flow patterns consideredThe role of the inertia appears then double-linked to this strategy. It can becharacterized by means of the storage efficiency (9,10). The storageefficiency depends not only of the thermal masses of the elements themselvesbut mainly on the air flow rates, the air flow patterns and the relativeposition of the thermal mass.Figure 7 shows different configurations of the flow patterns for a given spacecorresponding to different combinations of inlets and outlets.Assuming a constant amount of thermal mass and the same air flow rate forthe seven configurations, the relative results in terms of the storageefficiency are respectively(9) 0.93, 1., 0.88, 0.62, 0.66, 0.76, 0.43.These values (for instance compare the results for the configurations 2 and 7)reveal how different can be the efficiency of a night ventilation strategydepending of the flow pattern adopted. Moreover, if we compare for a givenconfiguration such as configuration 1 the relative contribution to the fourelements involved (numbered 1, 2, 3 and 4 in the figure) we get the followingvalues: 1., 0.93, 0.73 and 0.66 respectively. These results prove, howdifferent is the role of the inertia of the different elements depending ontheir position in the space.The physical reason that justifies the different performances achieved is thenature of the excitation for the different walls, in terms of the actual airvelocity and air temperature near every wall.In the CEN standards mentioned in section 2, the proposed co
“Alternative cooling calculation . solar heat gains in an enclosure with different levels of inertia. 0 10 20 30 40 50 60 80 0 4 8 12 16 20 24 Excitación Respuesta Tao 5 h 1 2 3. Figure 2.- Solar heat gains released to the air of the space in room s with different thermal inertia Typically, the inertia of a space is obtained from the inertia of the elements of such space without .