Transcription
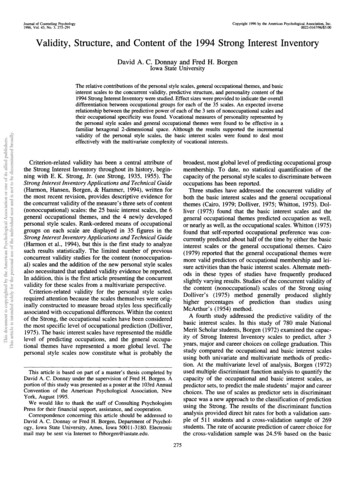
Copyright 1996 by the American Psychological Association, Inc.0022-0167/96/S3.00Journal of Counseling Psychology1996, Vol. 43, No. 3, 275-291Validity, Structure, and Content of the 1994 Strong Interest InventoryDavid A. C. Donnay and Fred H. BorgenThis document is copyrighted by the American Psychological Association or one of its allied publishers.This article is intended solely for the personal use of the individual user and is not to be disseminated broadly.Iowa State UniversityThe relative contributions of the personal style scales, general occupational themes, and basicinterest scales to the concurrent validity, predictive structure, and personality content of the1994 Strong Interest Inventory were studied. Effect sizes were provided to indicate the overalldifferentiation between occupational groups for each of the 35 scales. An expected inverserelationship between the predictive power of each of the 3 sets of nonoccupational scales andtheir occupational specificity was found. Vocational measures of personality represented bythe personal style scales and general occupational themes were found to be effective in afamiliar hexagonal 2-dimensional space. Although the results supported the incrementalvalidity of the personal style scales, the basic interest scales were found to deal mosteffectively with the multivariate complexity of vocational interests.Criterion-related validity has been a central attribute ofthe Strong Interest Inventory throughout its history, beginning with E. K. Strong, Jr. (see Strong, 1935, 1955). TheStrong Interest Inventory Applications and Technical Guide(Harmon, Hansen, Borgen, & Hammer, 1994), written forthe most recent revision, provides descriptive evidence forthe concurrent validity of the measure's three sets of content(nonoccupational) scales: the 25 basic interest scales, the 6general occupational themes, and the 4 newly developedpersonal style scales. Rank-ordered means of occupationalgroups on each scale are displayed in 35 figures in theStrong Interest Inventory Applications and Technical Guide(Harmon et al., 1994), but this is the first study to analyzesuch results statistically. The limited number of previousconcurrent validity studies for the content (nonoccupational) scales and the addition of the new personal style scalesalso necessitated that updated validity evidence be reported.In addition, this is the first article presenting the concurrentvalidity for these scales from a multivariate perspective.Criterion-related validity for the personal style scalesrequired attention because the scales themselves were originally constructed to measure broad styles less specificallyassociated with occupational differences. Within the contextof the Strong, the occupational scales have been consideredthe most specific level of occupational prediction (Dolliver,1975). The basic interest scales have represented the middlelevel of predicting occupations, and the general occupational themes have represented a more global level. Thepersonal style scales now constitute what is probably thebroadest, most global level of predicting occupational groupmembership. To date, no statistical quantification of thecapacity of the personal style scales to discriminate betweenoccupations has been reported.Three studies have addressed the concurrent validity ofboth the basic interest scales and the general occupationalthemes (Cairo, 1979; Dolliver, 1975; Whitton, 1975). Dolliver (1975) found that the basic interest scales and thegeneral occupational themes predicted occupation as well,or nearly as well, as the occupational scales. Whitton (1975)found that self-reported occupational preference was concurrently predicted about half of the time by either the basicinterest scales or the general occupational themes. Cairo(1979) reported that the general occupational themes weremore valid predictors of occupational membership and leisure activities than the basic interest scales. Alternate methods in these types of studies have frequently producedslightly varying results. Studies of the concurrent validity ofthe content (nonoccupational) scales of the Strong usingDolliver's (1975) method generally produced slightlyhigher percentages of prediction than studies usingMe Arthur's (1954) method.A fourth study addressed the predictive validity of thebasic interest scales. In this study of 780 male NationalMerit Scholar students, Borgen (1972) examined the capacity of Strong Interest Inventory scales to predict, after 3years, major and career choices on college graduation. Thisstudy compared the occupational and basic interest scalesusing both univariate and multivariate methods of prediction. At the multivariate level of analysis, Borgen (1972)used multiple discriminant function analysis to quantify thecapacity of the occupational and basic interest scales, aspredictor sets, to predict the male students' major and careerchoices. The use of scales as predictor sets in discriminantspace was a new approach to the classification of predictionusing the Strong. The results of the discriminant functionanalysis provided direct hit rates for both a validation sample of 511 students and a cross-validation sample of 269students. The rate of accurate prediction of career choice forthe cross-validation sample was 24.5% based on the basicThis article is based on part of a master's thesis completed byDavid A. C. Donnay under the supervision of Fred H. Borgen. Aportion of this study was presented as a poster at the 103rd AnnualConvention of the American Psychological Association, NewYork, August 1995.We would like to thank the staff of Consulting PsychologistsPress for their financial support, assistance, and cooperation.Correspondence concerning this article should be addressed toDavid A. C. Donnay or Fred H. Borgen, Department of Psychology, Iowa State University, Ames, Iowa 50011-3180. Electronicmail may be sent via Internet to fhborgen@iastate.edu.275
This document is copyrighted by the American Psychological Association or one of its allied publishers.This article is intended solely for the personal use of the individual user and is not to be disseminated broadly.276DONNAY AND BORGENinterest scales. When a broader classification criterion comparing science and nonscience career choices was used, therate of accurate prediction, based on the basic interestscales, increased to 72.5%. Borgen's (1972) findings supported the use of the basic interest scales in research andcounseling, indicating that they predicted both major andcareer choices as well as the occupational scales.In contrast to its criterion-related validity, the personalitycontent of the Strong is both a more recent and a moretheoretically based attribute. The merger of these two attributes (predictive validity and personality content) is historically marked by the application of Holland's theoreticalframework to Strong's empirical work (Campbell & Holland, 1972). Throughout his career, theorist John Hollandhas referred to vocational interest inventories as personalityinventories (Holland, 1985). More specifically, Holland's(1985) theory states that "the choice of a vocation is anexpression of personality" (p. 7). The new Strong is aparticularly relevant inventory for examination of this theory because it has recently included four scales recognizedas distinct measures of personal styles. Moreover, the introduction of the personal style scales suggests a movementtoward the overt recognition of relevant personality constructs beyond Holland's six types, as represented in theStrong by the general occupational themes (for a recentreview of the convergence between vocational interest andpersonality, see Borgen & Harmon, 1996).A major conceptual point to Holland's theory of vocational personality is that the six types form a hexagon intwo-dimensional space. The spatial relationships among thesix types represented by the hexagon serve important theoretical and functional purposes (Holland, 1985). Prediger(1982) has imposed two bipolar dimensions onto Holland'shexagon. These two dimensions, people-things and dataideas, are hypothesized to explain the functional structure ofthe hexagon. Hogan (1983) has proposed two alternativedimensions underlying the hexagon. The dimensions, sociability and conformity, appear to best explain the underlyingpersonality structure of the hexagon (Borgen & Harmon,1996). Figure 1 illustrates the dimensional models proposedby both Prediger and Hogan. In a structural analysis of thehexagon, Rounds and Tracey (1993) concluded that Prediger's and Hogan's dimensions are equally plausible and thateach contributes to an understanding of Holland's theory.The purpose of the present study was to provide statisticalindices (i.e., effect sizes) showing the overall differentiationbetween occupational groups for each of the 35 scales,particularly the 4 personal style scales. The Strong InterestInventory Applications and Technical Guide (Harmon et al.,1994) provides figures that graphically illustrate mean occupational differences for single scales. This article represents the first attempt at computing effect sizes for thosemean differences. It is also the first published presentationof a multivariate analysis of mean occupational differenceson the 1994 Strong scales.This study brought a multivariate approach (see Borgen,1972; Cooley & Lohnes, 1968) to the question of occupational group separation, comparing the overall capacity ofeach of the three sets of content (nonoccupational) scales topredict occupational group membership. In this manner, thestudy investigated an expected inverse relationship betweenthe capacity of each of the three sets of content (nonoccupational) scales to predict occupational group membershipand the scales' level of occupational prediction. This wasbased on Dolliver's (1975) observation that the sets ofscales on the Strong differ both in number and in occupational specificity. This study also examined the personalstyle scales as additional predictors of occupational groupmembership. Finally, the analyses of this study allowed forconsiderable examination of the Strong's underlying vocational personality content.R1Ideas1 c/1 \o\A\/DatasESociabilityPrediger's Two-Dimensional Modelfor Holland's HexagonHogan's Two-Dimensional Modelfor Holland's HexagonFigure 1. Two-dimensional models proposed by Prediger (1982) and Hogan (1983) to link toHolland's hexagonal model. R realistic; I investigative; A artistic; S social; E enterprising; C conventional.
277STRONG INTEREST INVENTORY STRUCTUREMethodThis document is copyrighted by the American Psychological Association or one of its allied publishers.This article is intended solely for the personal use of the individual user and is not to be disseminated broadly.ParticipantsMore than 55,000 individuals in 50 occupations completed aresearch version of the 1994 Strong Interest Inventory during 1992and 1993. The sample used for this study is referred to in theStrong Interest Inventory Applications and Technical Guide (Harmon et al., 1994) as the general reference sample. The generalreference sample consisted of 18,951 employed adults who wereselected on the basis of a set of criteria including job satisfaction,job experience, typicality of job description, and age. The percentage of women who reported being very satisfied in their occupation was 61.8%; the percentage of men was 58.7%. The remainderof the general reference sample reported being somewhat satisfied.The women in the sample averaged 13.8 years of experience intheir occupation, and the men averaged 18.2 years. In most of theoccupational samples, no more than 1% or 2% of the respondentsdescribed performing duties atypical of their occupation. Theaverage age of the women in the sample was 40.5 years; theaverage age of men was 44.6 years.The general reference sample was randomly constructed to bebalanced for gender and to be equally representative of the 50 newoccupations added to the Strong. When possible, 400 members ofeach occupational group were selected for use in this sample.Women and men were equally represented in the majority of the50 occupations, resulting in subgroups of 9,467 women and 9,484men. The specific occupational groups and the number of womenand men in each group are shown in Table 1. Two occupations (seeTable 1) in the general reference sample, along with their paralleloccupational scales, are represented by a single gender because ofthe pragmatic difficulties of collecting adequate data for somenontraditional occupations.The Strong Interest Inventory Applications and Technical Guide(Harmon et al., 1994) provides extensive details related to thegeneral reference sample (the sample used here). At the same time,some of the strategies in the revision need emphasis so that thereader can understand how the data reported here relate to thosereported in the manual. Although the sample for this study waslarge, it accounted for less than half of the data used in the 1994revision of the Strong. There are two major reasons, each relatingto the Strong's occupational scales. First, some of the 1994 occupational scales were based on data collected for the 1985 (Hansen& Campbell) revision, and none of these data were included in thegeneral reference sample; rather, the general reference sampleinvolved only data collected in the early 1990s. Second, eachoccupational scale was developed separately for women and menand used all of the data collected for that occupation. In contrast,no occupation in the general reference sample was represented bymore than 200 people of each gender. For example, the genderspecific occupational scales for speech pathologists were based on425 women and 334 men, but the general reference sample drew200 women and 200 men from these groups.Of the total general reference sample of 18,951 people, 18,789reported their ethnicity. Of these individuals, 1,424 (or 7.6%) werenon-Caucasian: 378 (2.0%) were African American, 363 (1.9%)were Asian American, 349 (1.9%) were Latino(a) or HispanicAmerican, 80 (0.4%) were Native American, and 254 (1.4%) wereof other ethnicity. Across the 50 occupations in the general reference sample, 26 had 5% to 10% ethnic minority representation, 9had more than 10% ethnic minority representation, and 15 had lessthan 5% ethnic minority representation. Within occupations, thehighest ethnic minority representations were for translators(26.7%), child care providers (20.3%), and flight attendantsTable 1Occupational Groups in General Reference Sample:Sample Sizes by SexOccupationAccountantActuaryAdvertising executiveArchitectAudiologistAuto mechanicBankerBiologistBookkeeperBusiness education teacherChemistChild care providerCommunity service organizationdirectorComputer programmer-systemsanalystCorporate trainerCredit managerDentistElementary school teacherEngineerFarmerFlight g-maintenancesupervisorHuman resources directorLawyerLibrarianLife insurance agentMarketing executiveMedical records technicianNurse, registeredNursing home administratorOccupational therapistParalegalParks and recreation coordinatorPharmacistPhysicistPhysical therapistPlumberPolice officerPublic relations directorRadiologic technologistSchool administratorSmall business ownerSocial workerSpecial education teacherSpeech pathologistTechnical writerTranslatorVeterinarianWomen(n 9,467)Men(n 19.5%); the lowest were for farmers (2.1%), veterinarians (2.3%),and accountants (2.3%). More details about ethnicity are providedin chapter 15 of the Strong Interest Inventory Applications andTechnical Guide (Harmon et al., 1994); it should be noted that, inthat chapter, all of the ethnic minorities (approximately 3,000)used in the 1994 occupational scales are described, whereas thematerial just described involves the subsample of ethnic minorities(n 1,424) contained in the general reference sample. Differences, although slight, are due to sampling variation.
278DONNAY AND BORGENThe entire sample of 18,951 was used in the univariate analyses.For the multivariate discriminant analyses, the sample was dividedinto validation and cross-validation groups (randomly setting asidehalf of the women and men within each occupational group forcross validation).This document is copyrighted by the American Psychological Association or one of its allied publishers.This article is intended solely for the personal use of the individual user and is not to be disseminated broadly.Predictive MeasuresStrong Interest Inventory. The 317 items of the 1994 StrongInterest Inventory (Harmon et al., 1994) were administered duringthe revision to assess participants' patterns of vocational interests.The Strong, in its revision, continued in the established traditionsof the Strong Vocational Interest Blank (Strong, 1927) and theStrong-Campbell Interest Inventory (Campbell & Hansen, 1981)while introducing several innovations. The Strong is an empirically based measure that is one of the most widely used psychological instruments in both research and practice (Hansen &Campbell, 1985). It is used to assess occupational interests, interests in different types of people and environments, and interests inleisure activities.The relevant components of the Strong for this study were thegeneral occupational themes, the basic interest scales, and thenewly introduced personal style scales. These scales have standardscores with means of 50 and standard deviations of 10. A uniquecharacteristic of the personal style scales is that they are constructed as bipolar scales with distinct and meaningful poles.Personal style scales. The personal style scales are the newestset of scales within the Strong. They are designed to measurepreferences for broad styles of living and working (Harmon et al.,1994) and to be used in examining individual differences withinoccupations. These scales assist individual exploration of educational and work settings by showing level of comfort with distinctive styles. The four scales are as follows: Work Style, LearningEnvironment, Leadership Style, and Risk Taking/Adventure.These four dimensions are not theoretically comprehensive; rather,they arose out of serendipity and empirical results during the 1994revision of the Strong (Borgen & Harmon, 1996).The Work Style scale measures the preferences of individuals towork either with people or with ideas, data, and things. Those whoscore high on the Work Style scale prefer to work with people andendorse a number of items that represent occupations and activitiesthat are people oriented. Women tend to score higher than men onthis scale. There are 51 items scored on the scale. Six of the itemsask the respondent to indicate preferences for working with peopleor for working with ideas, data, and things. In addition to the 6dichotomous items in the Preferences in the World of Worksection of the answer sheet, 45 items throughout the Strong arescored on this scale. These additional items were selected for theirability to differentiate between two known groups, based on thefirst 6 items, at the 16% level. The internal consistency of thisscale suggests high homogeneity, with a Cronbach's alpha of .91for the 51 items. Test-retest reliability is equally impressive. Infour independent samples of both college students and employedadults, the test-retest correlations ranged from .86 to .91 (Harmonet al., 1994). Although the Work Style scale appears to measure aunique construct, a high correlation (.52 for women and .61 formen) does exist between this scale and the Leadership Style scale.The Learning Environment scale distinguishes individuals whoprefer academic learning environments from those who prefermore applied learning activities (Harmon et al., 1994). A highscore on this scale reflects interests in cultural, verbal, and researchactivities, as well as teaching, rather than interests in clerical,technical, and physical activities. Individuals with higher scoresreport interests in activities and occupations that require extensiveacademic study and professional training. Scores for this scale areobtained from the 49 items throughout the Strong that best differentiate a liking for formal academic settings and a liking for moreapplied settings. The internal consistency of this scale is high, witha reported Cronbach's alpha of .86. The test-retest correlations infour independent samples ranged from .83 to .91, suggestingstability over time (Harmon et al., 1994). A modest correlationexists between the Learning Environment and Leadership Stylescales; however, the Learning Environment scale appears to measure a dimension independent from the Work Style and RiskTaking/Adventure scales.The Leadership Style scale assesses level of comfort in takingcharge of others. This scale differentiates between those whoprefer meeting, directing, and persuading others and those whoprefer to lead by example. A high score on this scale reflects aninterest in interpersonal and organizational activities and occupations. Twenty-three homogeneous items make up the LeadershipStyle scale. The internal consistency of the scale is high, with aCronbach's alpha of .86. The test-retest reliabilities for the scale infour independent samples ranged from .81 to .88 (Borgen, Donnay,Montross, Long, & Majors, 1994; Harmon et al., 1994). Modest tohigh correlations exist between the Leadership Style scale and thethree other personal style scales. Montross, Donnay, and Borgen(1995) provided evidence of the Leadership Style scale's constructvalidity through correlation with the Adjective Check List (Gough& Heilbrun, 1983) and the Leadership Index of the CaliforniaPsychological Inventory (Gough, 1969).The Risk Taking/Adventure scale has a 26-year history as abasic interest scale on the Strong. It was first constructed in 1968as the Adventure scale (Campbell, Borgen, Eastes, Johannson, &Peterson, 1968). The Risk Taking/Adventure scale has been renamed and slightly revised for the new Strong. This scale distinguishes between individuals who prefer risky and adventurousactivities and individuals who prefer safe and predictable activities. A high score on the scale indicates a willingness to actspontaneously and sometimes recklessly. Low scores reflect apreference for taking precautions. Women tend to score lower onthis scale than do men. Scores also tend to decrease with age; thus,the scale is said to be more predictive of current than futurebehavior (Harmon et al., 1994). Having an acceptable Cronbach'salpha for a scale of its length (.78 for the nine items), the RiskTaking/Adventure scale is consistent over time, with test-retestreliabilities between .85 and .89 (Harmon et al., 1994). The scaleappears to measure a unique construct of personality. Only a slightcorrelation exists between this scale and the Leadership Stylescale, and it is virtually uncorrelated with the Work Style andLearning Environment scales.General occupational themes. The general occupationalthemes represent Holland's topology within the Strong (Campbell& Holland, 1972). The six types are as follows: (a) realistic, (b)investigative, (c) artistic, (d) social, (e) enterprising, and (f) conventional. Scores on these scales represent a global view of anindividual's vocational and life-style interests. Item content withineach of the six general occupational themes is homogeneous. Thereliabilities were improved for the 1994 Strong Interest Inventory.The alpha reliabilities for the general occupational themes rangedfrom .90 for the Social scale to .94 for the Artistic scale (Harmonet al., 1994). The test-retest reliabilities for these six scales over3-6-month intervals ranged from .84 for Enterprising to .92 forRealistic (Harmon et al., 1994). The concurrent validity of thegeneral occupational themes has been evaluated against similarinterest measures such as the Vocational Preference Inventory(Hansen, 1986). The general occupational themes also appear to
279This document is copyrighted by the American Psychological Association or one of its allied publishers.This article is intended solely for the personal use of the individual user and is not to be disseminated broadly.STRONG INTEREST INVENTORY STRUCTUREseparate occupations in accordance with theoretical expectations(Harmon et al., 1994).Basic interest scales. The 25 basic interest scales of the Strongmeasure more specifically the homogeneous interest areas measured by the general occupational themes. The basic interest scalesare organized on the Strong profile under their correspondinggeneral occupational themes. In a manner similar to that of thegeneral occupational themes, scores on these 25 scales representindividuals' vocational and life-style interests but with greaterspecificity. The Cronbach alphas for these 25 scales ranged from.74 for the 6-item Agriculture scale to .94 for the 21-item Mechanical Activities scale, suggesting internal consistency and homogeneous item content; the test-retest reliabilities for the 25 scalesranged from .80 for the Culinary Arts and Teaching scales to .94for the Athletics scale (Harmon et al., 1994). The basic interestscales provide greater specificity of interests than do the generaloccupational themes and are, therefore, typically more predictiveof occupation (Hansen, 1986).general occupational themes, and the basic interest scales. Asmentioned earlier, discriminant function analysis is considered anappropriate method for the multivariate study of group differencesfor both explanatory and predictive purposes (Betz, 1987; Borgen& Seling, 1978). For the purposes of replication, the sample wasrandomly divided into validation and cross-validation groups forall of the multivariate analyses. Three distinct discriminant function analyses were used, and replicated, to compare the overallcapacity of each of the three predictor sets (the personal stylescales, the general occupational themes, and the basic interestscales) to predict occupational group membership. A hierarchicaldiscriminant function analysis, dictating the order in which variables were considered, was subsequently used to identify theadditional variance accounted for by the personal style scales afterthe general occupational themes and basic interest scales had beencontrolled. Effect sizes were reported for each of the three sets ofscales based on Wilks's lambda.Effect size. In evaluating the magnitude or strength of meandifferences for two groups, the usual measure of effect size is themean difference divided by the pooled standard deviations of theCriterion GroupsOccupational group membership was coded from the exact jobtitles provided by participants on the research version answersheet. Group membership is an appropriate criterion measure forvalidation research (Humphreys, Lubinski, & Lao, 1993). Fiftyoccupations were represented among the 18,951 satisfied employed adults involved in the study. The occupational groupsrepresented in the general reference sample and the number ofwomen and men in each group are shown in Table 1.Design and AnalysesThe multivariate approach of discriminant analysis developedby R. A. Fisher was heavily used in this study. Discriminantanalysis is considered an appropriate method for the study of groupdifferences (Betz, 1987). It is particularly appropriate when onewishes to predict group membership based on composites, or sets,of predictor variables. It is also helpful when used for explanatorypurposes because it is capable of determining both the underlyingdimensionality and the contribution of individual variables (Borgen & Seling, 1978). This study further capitalizes on the technique of discriminant analysis for use with multivariate data,following a broad data-analytic strategy suggested by Cooley andLohnes (1968). Similar in many respects to previous work byBorgen (1972), this study serves as an example for researchers invocational and counseling psychology because of the wide applicability of its multivariate method for studying criterion-relatedvalidity within specific groups.Univariate level of analysis. Each of the 4 personal stylescales, the 6 general occupational themes, and the 25 basic interestscales was examined for its capacity to separate occupationalgroups from one another. Thirty-five univariate analyses of variance (ANOVAs) were used to calculate F ratios reflecting thecontribution of each of the 35 original variables to occupationalgroup separation. The discriminant capacity of each scale wasfurther examined through use of Wilks's lambda as a descriptiveindex showing the overall differentiation between groups for eachscale. Wilks's lambda is the proportion of variance not explainedby group membership (Betz, 1987). Effect sizes were reported foreach of the 35 scales based on Wilks's lambda.Multivariate level of analysis. Both multivariate discriminantfunction analyses and hierarchical discriminant function analyseswere used to examine the validity of the personal style scales, theTable 2Univariate Analysis of Group Separation: Wilks'sLambda and F RatioVariableWilks's APersonal style scaleWork StyleLearning EnvironmentLeadership StyleRisk Taking/AdventureGeneral occupational ingConventionalBasic interest scaleAgricultureNatureMilitary activitiesAthleticsMechanical activitiesScienceMathematicsMedical scienceMusic/dramaticsArtApplied artsWritingCulinary artsTeachingSocial serviceMedical serviceReligious activitiesPublic almanagementData managementComputer activitiesOffice servicesNote. N 18,951. All Fs wereF(49,18901).71090.74397.85289.940
Validity, Structure, and Content of the 1994 Strong Interest Inventory David A. C. Donnay and Fred H. Borgen Iowa State University The relative contributions of the personal style scales, general occupational themes, and basic interest scales to the concurrent validity, predictive s