Transcription
PICS: A Public IaaS Cloud SimulatorIn Kee Kim, Wei Wang, and Marty HumphreyDepartment of Computer ScienceUniversity of VirginiaEmail: {ik2sb, wwang}@virginia.edu, humphrey@cs.virginia.edurequires significant changes to its architecture. Fourth, theevaluation is geared toward the present time, whereas longerterm issues/concerns are often more important than short-termissues of today’s cloud – there is little opportunity to ask whatif questions of performance, reliability or cost.There are a number of cloud simulators that exist (e.g.CloudSim [11], iCanCloud [18], GreenCloud [15]). They havethe potential to aid in this evaluation. However, in general,these simulators are designed to answer questions related todatacenter management (e.g., how many concurrent users canI support if I deploy a private cloud on my existing hardware?)Furthermore, typical tools [1, 2, 7, 8] provided by commercialcloud vendors only address a small part of the concerns, whichis an overall cost in the aggregate based on resource utilization(e.g., how much does it cost to run 100 small VMs for onemonth and to store 10 TB in long-term cloud storage for 1year?) These existing cloud simulators and vendor tools donot broader, end-to-end concerns such as:1) What is the average/worst response time for a particular application and a particular arrival pattern, whenservicing via a specific VM type and a specific set ofauto-scaling rules?2) Which public IaaS cloud provides the best cost efficiency for a particular application, given the differentVM configurations, storage services and pricing models?3) Which resource management and job scheduling policymaximize the cost efficiency and minimize the responsetime for a particular application?4) Above all, if a simulator can provide answers for abovequestions, another question the cloud users could haveis how reliable are the simulation results? or howaccurately can the simulator resemble actual clouds’behavior?To enable potential public IaaS cloud users to address theseand other challenging concerns without actually deployingthe cloud-application, we have create the PICS1 , a tracebased public IaaS cloud simulator. PICS provides followingcapabilities to address the potential cloud user’s concerns: Assessing a wide range of properties of cloud servicesand the cloud-applications, including the cloud cost, jobresponse time, and VM utilization. Allowing the simulation users to specify different workload types, including varying job arrival patterns and SLArequirements (e.g. deadline).Abstract—Public clouds become essential for many organizations to run their applications because they provide huge financialbenefits and great flexibility. However, it is very challenging toaccurately evaluate the performance and cost of applicationswithout actual deployment on the clouds. Existing cloud simulators are generally designed from the perspective of cloudservice providers, thus they can be under-developed for answering questions for the perspective of cloud users. To solve thisprediction and evaluation problem, we created a Public CloudIaaS Simulator (PICS). PICS enables the cloud user to evaluatethe cost and performance of public IaaS clouds along with suchdimensions like VM and storage service, resource scaling, jobscheduling, and diverse workload patterns. We extensively validated PICS by comparing its results with the data acquired fromreal public IaaS cloud using real cloud-applications. We showthat PICS provides highly accurate simulation results (less than5% of average errors) under a variety of use cases. Moreover, weevaluated PICS’ sensitivity with imprecise simulation parameters.The results show that PICS still provides very reliable simulationresults with imprecise simulation parameters and performanceuncertainty.Index Terms—Cloud Simulator, Cloud Performance Evaluation, Public IaaS Clouds, Cloud Applications, Cloud ResourceManagement.I. I NTRODUCTIONFor many organizations today, the issue is not whether to usepublic IaaS cloud computing (e.g. Amazon Web Services [1]or Microsoft Azure [2]) but rather how best to use public IaaScloud capabilities. The approach taken by many organizationsgetting started is that a few “super-human” users within theorganization deploy a small-scale test cloud-application onthe public cloud of choice. This cloud-application usually hastwo components: a resource manager and user-applications,where the resource manager is responsible for the effective andefficient execution of user-applications, such as web search,SNS, big data analytics, and scientific applications. Then, thenext steps are to scale-up the test cloud-application in orderto better assess the capabilities and viability in the context ofthe organization’s particular goals and requirements.The key limitation these potential cloud users are facingis that there does not appear to be a viable alternative forevaluating the cloud other than to actually use the cloud.This approach is problematic for a number of reasons. First,the time-consuming and sometimes tedious learning of idiosyncratic cloud APIs can distract from the real issue, whichcenters around specific application logic and requirements.Second, the evaluation tends to be specific to one cloud andnot readily generalizable to other clouds. Third, to evaluateat scale via this approach, the cloud-application typically1 Source code of PICS is publicly available on the PICS project web site –http://www.cs.virginia.edu/ ik2sb/PICS [6]1
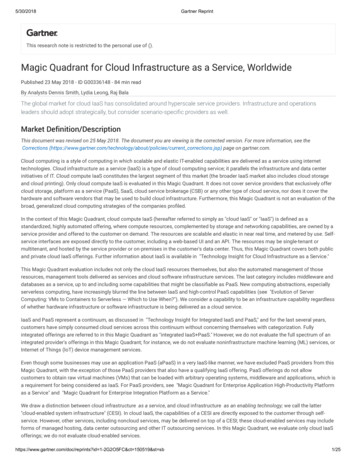
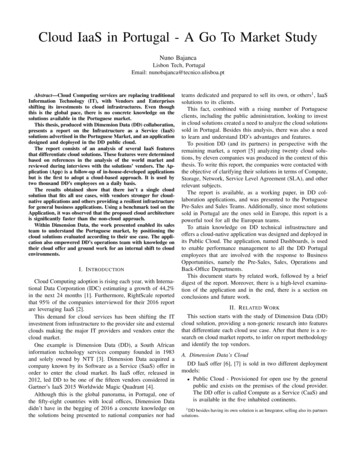
TABLE I: Simulation Capabilities of Existing Cloud Simulator and PICS.Datacenter IssuesCloud User IssuesSimulation CapabilitiesVM management (allocation, provisioning, scheduling, migration)Physical resource management and scalingNetwork resource managementPower consumption managementFederated cloud managementDatacenter workload managementHorizontal VM auto-scaling (scale-in/out)Vertical VM auto-scaling (scale-up/down)Storage service managementJob/Application schedulingBilling management (cost optimization)Application/Job failure managementIaaS performance uncertaintySimulating of a broad range of resource management policies: i.e., horizontal/vertical2 auto-scaling, jobscheduling and job failure policies. Enabling the users to evaluate the performance of different types of public IaaS cloud configurations such as avariety of resource types (VM and storage), unique billingmodels, and performance uncertainty [19–21].We validated the correctness of PICS by focusing on following capabilities: cloud cost, the number of created VMs, VMutilization, horizontal and vertical scaling of cloud resources,and job deadline satisfaction rate. We compare the simulationresults of PICS with the actual measurements from realworld cloud-applications on Amazon Web Services (AWS).The results show that PICS provides very accurate simulationresults (less than 5% of average errors) in every validationcases. Furthermore, we conduct a sensitivity test of PICSwith 10% and 20% of imprecise simulation parameter byconsidering of the performance uncertainty of IaaS clouds. Theresults show that PICS with imprecise simulation parametersstill provides very reliable simulation results.The contributions of this paper are:1) A public IaaS cloud simulator, PICS, which is versatileand satisfies cloud user’s various needs of cloud application and cloud service evaluations without actual clouddeployment. PICS is easy-to-configure and fast, allowinglarge design space exploration in short amount of time.2) A first simulator that supports both horizontal and vertical cloud resource scaling, to the best of our knowledge.3) A thorough validation of PICS against the results fromreal public IaaS (AWS), demonstrating that the PICSprovides accurate results that faithfully simulates realcloud services.4) An analysis to examine PICS’ sensitivity to the performance uncertainty of real cloud services. This analysisshows that PICS can still provide reliable simulation results even when user-provided parameters are imprecisedue to the unstable real cloud performance.The rest of this paper is organized as follows: Section IIcontains the related work. Section III describes the designand implementation of PICS. Section IV contains validationof PICS. Section V is discussion focusing on sensitivity ofsimulation parameters and Section VI provides the conclusion.CloudSim nCloud Cloud NoNoYesYesYesYesYesYesYesII. R ELATED W ORK CloudSim [11] is a well-known simulation framework forcloud computing and is designed to support various simulationtests across three major cloud service models (e.g. SaaS,PaaS, and IaaS). CloudSim is widely used in cloud computing research because of its various capabilities for cloudsimulations such as VM allocation and provisioning, energyconsumption, network management, and federated clouds. Italso has several extensions [10, 12, 14, 22] due to its extensiblesimulation architecture. These extensions support simulationsfor large-scale cloud applications according to the geographical distribution of users and datacenters [22], a network-basedapplication model [14], complex scientific workflows [12] andhomogeneity in the performance of computational resourcesand resource failure model during task executions [10].iCanCloud [18] is a holistic simulation platform for cloudcomputing and offers various simulation functionalities including resource provisioning, energy consumption, and userdefined resource broker model. The goal of iCanCloud is topredict tradeoffs between cost and performance of applicationsexecuted on virtualized environments. iCanCloud offers anunique feature to configure various storage systems and apre-defined IaaS model based on Amazon EC2. Moreover,iCanCloud supports large-scale simulation on distributed environments by employing MPI/POSIX-based API.GreenCloud [15] is a packet-level simulator for data centersfocusing on data communication and energy cost in cloudcomputing. This simulator is implemented based on NS-2 [5]and offers extensive network and communication capabilities(e.g. full implementation of TCP/IP reference model, variousworkload models) to simulate data center operations. However,due to its narrow focus of simulation for cloud system, itlacks many simulation capabilities in both cloud user- andinfrastructure-oriented resource management.Cloud providers [1, 2] and third-party cloud services [7, 8]provide a tool for calculating the overall cost in the aggregatebased on resource utilization. These services are only addressing a small part of the cloud user’s concern (cloud cost).They do not support any capability to evaluate performancesuch as response time and detailed VM utilizations. Moreover,they only support resource management policies offered bycommercial cloud services (e.g. AWS auto-scaling) to handlethe cloud resources, so it is impossible to evaluate the cost andperformance of the clouds via particular resource managementpolicies designed for the cloud user’s applications.2 Vertical scaling means “scale-up” or “scale-down” operations for the cloudresources. i.e., migrating the user-applications to higher (scale-up) or lower(scale-down) performance instances. [9]2
As discussed in this section, the capabilities of all existingsimulators more focus on datacenter issues such as powerconsumption and physical resource management. These capabilities are suitable to answer following questions: How many concurrent users can I support if I deploy aprivate cloud on my existing hardware? How can I effectively manage my existing hardwareresources if I deploy a private clouds on my hardware?However, the cloud users have different perspective on cloudsystems. The “super-human” users (mentioned in Section I) isresponsible for build cloud applications, which schedule jobssubmitted by end users and manage cloud resources (VM,storage, network, etc.) that execute these jobs. For these users,they are more interested in how best to use clouds ratherthan operating cloud systems. Their major concerns are costoptimization, VM usage, resource scaling, and storage servicefor their cloud-applications. Due to these disparities betweenexisting cloud simulators and the cloud users, the cloud usershave difficulties to have existing simulators to deal with theproblem that how to evaluate the cloud other than to actuallyuse the cloud by focusing on cloud user’s concerns. Thislimitation motivate us to conduct this research. The purposeof our work is to provide a viable simulation solution for thenormal cloud users.The VM configuration includes detailed specifications ofVMs, such as cost (including public cloud’s billing model),machine performance (CPU, RAM), network performance,and the range of startup delays [17] of cloud resources. Thisconfiguration is designed to simulate various VM types ofcurrent public clouds because public clouds have a diversity ofVM types based on performance, cost, and the VM’s purpose.The storage and network configuration has detailed information on storage and network service on public IaaS clouds. Wemodel storage services to reflect current public clouds’ actualcharacteristics based on Amazon S3 and Azure Storage. Tomodel network service, we collect data from actual networkI/O test by using various types of VM on real cloud services.We then reflect the data to simulator configurations.The workload information contains detailed configurationson job generation such as job arrival time, job execution time,job deadline, size of network I/O, etc. This input reflects endusers requests to a particular cloud-application.The job scheduling policy defines various cloud user jobscheduling policy for end users’ requests. PICS includes threetypes of job scheduling policies, i.e., EDF (Earliest DeadlineFirst), Round-Robin, and Greedy scheduling mechanisms. Inthe future, PICS will support more complicated job schedulingpolicies and APIs. Furthermore, the simulation users canconfigure recovery policies for job failures, which enable theusers to conduct realistic tests for public cloud services.The cloud resource management policy contains detailedspecifications for the cloud resource management. This inputsupports simulation configurations for maximum number ofconcurrent VMs, and horizontal and vertical scaling policies.Moreover, the simulator users can configure various ways tomonitor and analyze an end user’s job request patterns such aslinear and time-series methods. The simulator users are able toleverage this mechanism to design and test their own resourcemanagement mechanisms.Output: PICS provides three types of output: cost, resourceusage, and job processing results.Cost results provide overall cost for total cloud usage,cost trace at fine grained time interval, and usage cost percloud resource type. Overall cost means how much cost thesimulation users are expected to spend on servicing a particularcloud-application under a particular job arrival pattern. Costtrace provides fluctuation and accumulation of usage cost atfine grained time interval. For example, expected usage costfor time at t is 100 and 200 for time at t 1. The usagecost per cloud resource type provides a detailed cost based onresource types such as how much cost they spent on each typeof resources (e.g. VM, storage, network).Resource usage results provide detailed information onresource usage such as how many VMs created, how muchstorage space spent, and how many network data sent andreceived. Moreover, these results offer fine-grained traces forboth horizontal and vertical scaling. These traces help usersdetermine the number and types of VMs running at time t andt 1. The users also check when (time) and how (scalingup/down) the vertical scaling decisions are made.III. S IMULATOR D ESIGNA. Simulator Design OverviewGoal: The goal of PICS is to correctly simulate the behaviors of public clouds from the cloud users’ perspectives asif they deploy a particular cloud-application on public IaaScloud. From the potential cloud users’ perspective, the cloudcost, the job response time and the resource usages (VMutilization and size) are the most important criteria to evaluatecloud service for their cloud-applications. Key challenges todesign PICS are: How to correctly model the behavior of public clouds.More specifically, how to handle a variety of resources(e.g. VM, storage, and network). How to properly model the behavior of the cloudapplication. More specifically, how to handle varyingworkload patterns and performance uncertainty [19–21]. How to correctly model the behavior of cloud users’resource management policy.For the first challenge, we designed a convenient configuration interface for the simulation users to define diversetypes of cloud resources as an input of the simulator. Forthe second challenge, we collected data from real publicclouds, profile performance uncertainty, and leverage theseresults to design the simulator. For the last challenge, weprovided abundant configuration options to let user definevarious custom resource management policies.Input: PICS requires five types of inputs: VM configurations, storage and network configurations, workload information, job scheduling policies, and cloud resource managementpolicies.3
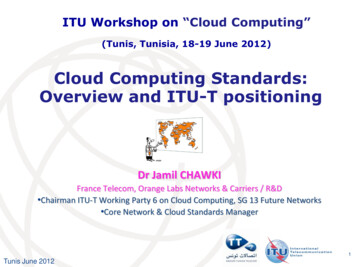
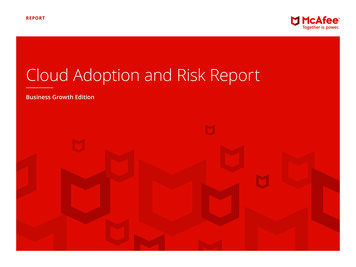
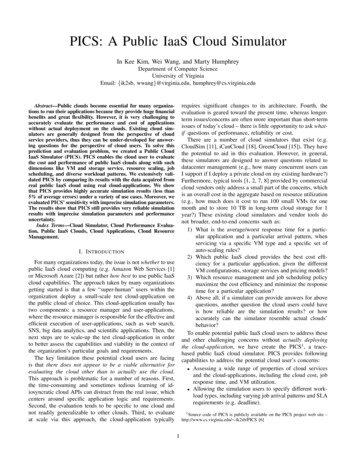
to simulation entities, which advance their simulation of thebehaviors of public cloud services and cloud-application tothe new clock cycle. This component also manages simulationtimer events. Simulation entities use these events to registertimers within Simulation Event Processor. This component isresponsible for notifying the corresponding simulation entitywhen a timer expires. Moreover, this component handlesall simulation command events, all invoked events betweensimulation entities, in order to validate the authentication ofthe command events. Because this component can monitor allevents in the simulation, this plays a main role to generatereal-time traces for the simulation.Simulation Report Generator is used to generate outputreports for the simulation results such as simulation trace andoverall reports. Reporting simulation results at fine-grainedtime interval is an important capability for simulators. Simulation Report Generator is responsible for generating realtime traces called simulation trace reports. These reportscontain simulation results at user-defined time interval for cost,resource scaling, and job processing information.2) Simulation Entity Layer: Simulation entity layer arecomposed of three entities, which are Workload GeneratorEntity, Cloud Application Management Entity, and IaaS CloudEntity. These entities reflect three main components of cloudapplications and public clouds.Workload Generator Entity generates jobs and sends themto the Cloud Application Management Entity to process, basedon the workload file from the simulation user. The workloadfile includes job arrival time, job execution time, job deadlines,I/O data specification, and data transfer specification to supportvarious types of possible end user’s job requests.Cloud Application Management Entity is designed toresemble the cloud-application’s behaviors. There are subcomponents in this entity: job management module, resourcemanagement module and workload monitoring module.The job management module is designed to simulate jobmanagement policies of a cloud-application. This moduleconducts three operations for the simulation; job scheduling,job response time estimation, and job failure management.Job scheduling is used to perform job scheduling policiesof the cloud users and assign an arrived job from WorkloadGenerator Entity to a selected VM from IaaS Cloud Entity. Jobresponse time estimation predicts the job response time, whichis defined as the clock time when a particular job finishes.The prediction of job response time is based on job executiontime and the current load of available cloud resources, and isused for the job scheduling. Job failure management is usedfor job failure simulation in the case of application failureor cloud infrastructure problem (e.g. VM down). Job failuremanagement supports four types of recovery policies for jobfailure simulations.The resource management module is designed to simulatethe resource management policies of a cloud-application. Ithandles three types of cloud resources of public IaaS clouds,i.e., VM, storage and network. For the VM management, thismodule enables the simulation users to examine their VM selection mechanisms (e.g. cost, performance, cost/performance-Fig. 1: Design overview of PICS.Job processing results provide specific information on jobprocessing, such as the job arrival/start/finish time, as wellas whether the job deadlines are satisfied (if specified). Theseresults are basic metrics to evaluate the user job scheduling andresource management policies. Moreover, these results includethe analysis of job arrival patterns (min, max, and average ofjob arrival time, as well as predictions for the next job arrivals)using linear and time-series methods.B. Simulator InternalsPICS is composed of three hierarchical layers: simulationconfiguration layer, simulation entity layer, and simulationcore layer as shown in Fig. 1. The simulation configurationlayer is responsible for accepting the user inputs which arepassed on to the simulation entity layer. The simulation entitylayer contains the simulation logic and is driven by the eventsgenerated from the simulation core layer. The simulation corelayer is also responsible for producing simulation reports.Because the simulation configuration layer has already beencovered by the previous section, we focus on the two remainlayers here.1) Simulation Core Layer: The simulation core layer consists of Simulation Wall Clock, Simulation Event Processorand Simulation Report Generator.Simulation Wall Clock is working as a heart for PICS bymanaging simulation clock. (Basic time unit is a second.) Tomanage the simulation clock, Simulation Wall Clock collaborates with Simulation Event Processor. When the simulationclock is updated, this component sends a clock update eventto Simulation Event Processor to notify an update of clock.Simulation Event Processor handles every event generatedin a simulation. After receiving the clock update event fromSimulation Wall Clock, this component passes on this event4
TABLE II: Validation Workloads for PICS. Poisson pattern has 30s of average job arrival rate and 29.63 of standard deviation. Bursty patternhas 15s of average job arrival rate and 11.50 of standard deviation. (WC: Word Count, PI: PI Calculation, TS: TeraSort)WorloadsWL #1WL #2WL #3WL #4WL #5WL #6WL #7WL #8WL #9WL #10WL #11WL #12WL #13WL #14WL #15WL #16ScalingJob Arr. PatternJob Type# of Concurr. VMsWCPoissonPITSHorizontal ScalingUnlimitedWCBurstyPITSPoissonVertical ScalingBurstyWCPIWCPI37510Used VM Typesm3.mediumAll Typesm3.largeAll Typesm3.xlargeAll Typesm3.mediumAll Typesm3.largeAll Typesm3.xlargeAll TypesAll Types# of JobsAvg. Job DL.Std. 8563.152005004) Deadline-based horizontal and vertical auto-scaling, and 5)Job Execution.The cloud-application starts with receiving jobs from theend users. It conducts job execution time prediction viarecent execution history for incoming jobs. The cloudapplication schedules them by the EDF job scheduling andsends them to the work queue in the VMs of choice. For VMselection, this cloud-application uses cost-based VM selectionthat selects the cheapest VM type that meets the deadline fora job. For the VM scaling, the cloud-application makes thescaling decision based on the deadline-based horizontal andvertical auto-scaling. The cloud-application first determinesthe fastest possible response time for the new job based onthe load of the job queues of active VMs. If the fastestpossible response time still misses the job deadline, horizontalor vertical scaling is engaged. In the case of horizontal scaling,a new VM is created for the new job. In the case of verticalscaling, an active VM is “scaled-up” to a higher performanceVM for the new job. Note that vertical scaling happenswhen there is a limit on the number of active VMs whichprevents the creation of new VMs. Additionally, after eachjob finishes, the cloud-application checks active VMs. If theactive VMs provide more than enough computation power tosatisfy deadline requirements, then a “scale-down” happensto improve the cost efficiency. Once the current VM type isdetermined, the job is assigned to that VM for job execution.For the validation of PICS, we use three types of MapReduce jobs (Word count, PI calculation, and Terasort) [4].Word count is an I/O- and memory-bound job, and it usesS3 storage to download input dataset and upload the finalresult. PI calculation is a fully-parallelized CPU-bound job.Terasort is a standard Hadoop benchmark application. Thesejobs were randomly generated based on two arrival patterns(Poisson and Bursty). Poisson arrival pattern has an averagejob arrival interval of 30 seconds with a standard deviation of29.63. Bursty pattern has an average job arrival interval of 15seconds with a standard deviation of 11.50.We deployed the cloud-application on AWS. The reasonsthat we use AWS for the PICS validation are as follows: 1)AWS is widely used public IaaS cloud; 2) according to recentworks [16, 19–21], AWS EC2 performance fluctuates a lot andAWS has less predictability (higher variance) than other publicbalanced) and VM scaling mechanisms (e.g. horizontal, vertical scaling). For storage and network resources, this modulecan simulate File Read/Write operations to cloud storage anddata transmissions by collaborating with IaaS Cloud Entity.The workload monitoring module is designed to analyzeworkload arrival patterns from Workload Generator Entity.The simulation users can leverage this module to improvetheir policies for job scheduling and resource management forvariable workload patterns.IaaS Cloud Entity is used to simulate the public cloud’sbehavior. It has sub-modules to simulate public clouds, whichinclude cost calculation, VM management, storage service andnetwork service module.The cost calculation module calculates all cloud cost usedby Cloud Application Management Entity. It generates the costtraces based on user-defined time interval and creates the finalresults when the simulation is completed.The VM repository module manages the configurations of allVM types defined by the users and resembles the on-demandVM service of IaaS clouds. This module stores VM information to correctly measure VM usage cost and simulate jobexecution on VMs. Moreover, this module generates startupdelay for new VM creations based on user input, and simulatesall operations of the VMs. This module also handles workloadson VM such as job execution and failure generation.Storage service and network service module simulates fileI/O and data transmission operations based on their configurations and the workload information. It generates the overalland real-time traces of the usage of storage and networkservices for the workloads.IV. S IMULATOR VALIDATIONA. Experiment SetupIn order to validate the simulation results of PICS, wecompared PICS results with a real cloud application on AWS.We design and implement a cloud-application that executesuser-applications with three different types of MapReduce[13] jobs and two job arrival patterns. The workflow ofthe cloud-application goes through the following five keysteps: 1) Job execution time prediction via recent executionhistory, 2) EDF job scheduling, 3) Cost-based VM selection,5
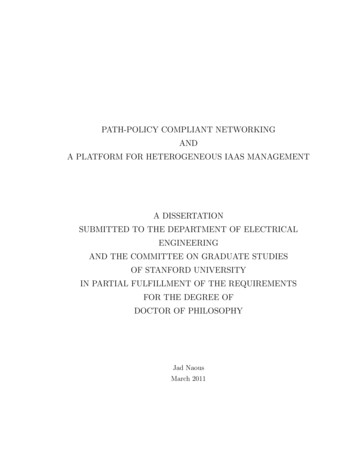
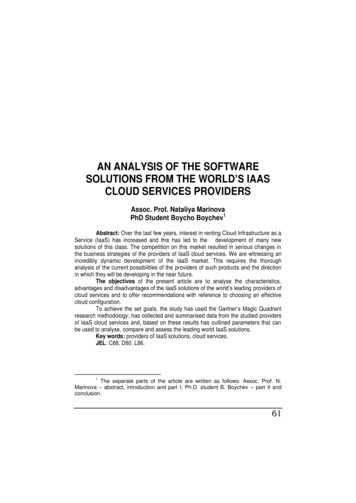
TABLE III: Simulation errors for horizontal scaling cases.# of .4%VM .3%1.3%Job %1.9%Normalized 0%6.1%2.6%PnT imeJobExec.,V MiPni 1i 1 T imeT otalRun.,V MiNiedJobsRate DeadlineSatisfNAllJobsJob DL Satisf actionSimulation Error Actual SimulationActualActualPICS020406080100(a) Cost Trace for WL #4IaaS clouds, therefore AWS is better than other IaaS cloudswhen evaluating the sensitivity of PICS to the performanceuncertainty of public clouds. Our cloud-application uses fourtypes of on-demand EC2 VM instances, which are m3.medium,m3.large, m3.xlarge, and m3.2xlarge. These four types of EC2on-demand instances are general purpose VMs and commonlyused by the cloud users.Based on the above experimental configurations, we created16 validation workloads as shown in Table II. These workloadsare categorized based on job arrival patterns (Poisson andbursty), job types, single or multiple VM types, and scalingpolicies. WL #1 – #6, #13, and #14 are for the tests underPoisson job arrival pattern, and others are for bursty arrivalpattern. WL #1, #2, #7, #8 and #13 process word count jobs,WL #3, #4, #9, #10 and #14 handles PI calculation jobs,and WL #5, #6, #11 and #12 deal with Terasort jobs. WL#1, #3, #5, #7, #9, and #11 only use a single VM type (e.g.m3.medium, m3.large, or m3.xlarge) in order to validate a casewhen a cloud-application uses a single type of VM. The othersuse all four types of general purpose EC2 instances. Thisis to test more complicated use cases for the VM resourcemanagement. For scaling validation, WL #1 – #12 are forhorizontal scaling and WL #13 – #16 are for vertical scalinguse cases. We submitted these 16 workloads to PICS and thecloud-application running on AWS, and measured the cloudcost, the total number of created VMs, VM utilization, andjob deadline satisfaction rate. These metrics are expressed asequation – (1), (2), and (3). We then measured the simulationerror by equation – (4)PnCost i 1 costV Mi(1)V M U tilization 10.80.60.40.20Time (min.)Normalized CostWorkloadsWL #1WL #2WL #3WL #4WL #5WL #6W
service providers, thus they can be under-developed for answer-ing questions for the perspective of cloud users. To solve this prediction and evaluation problem, we created a Public Cloud IaaS Simulator (PICS). PICS enables the cloud user to evaluate the cost and performance of public IaaS clouds along with such