Transcription
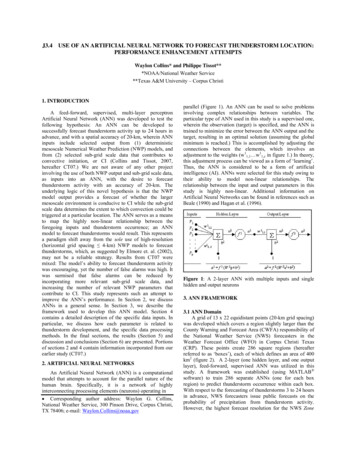
J3.4 USE OF AN ARTIFICIAL NEURAL NETWORK TO FORECAST THUNDERSTORM LOCATION:PERFORMANCE ENHANCEMENT ATTEMPTSWaylon Collins* and Philippe Tissot***NOAA/National Weather Service**Texas A&M University – Corpus Christi1. INTRODUCTIONA feed-forward, supervised, multi-layer perceptronArtificial Neural Network (ANN) was developed to test thefollowing hypothesis: An ANN can be developed tosuccessfully forecast thunderstorm activity up to 24 hours inadvance, and with a spatial accuracy of 20-km, wherein ANNinputs include selected output from (1) deterministicmesoscale Numerical Weather Prediction (NWP) models, andfrom (2) selected sub-grid scale data that contributes toconvective initiation, or CI (Collins and Tissot, 2007,hereafter CT07.) We are not aware of any other projectinvolving the use of both NWP output and sub-grid scale data,as inputs into an ANN, with the desire to forecastthunderstorm activity with an accuracy of 20-km. Theunderlying logic of this novel hypothesis is that the NWPmodel output provides a forecast of whether the largermesoscale environment is conducive to CI while the sub-gridscale data determines the extent to which convection could betriggered at a particular location. The ANN serves as a meansto map the highly non-linear relationship between theforegoing inputs and thunderstorm occurrence; an ANNmodel to forecast thunderstorms would result. This representsa paradigm shift away from the sole use of high-resolution(horizontal grid spacing 4-km) NWP models to forecastthunderstorms, which, as suggested by Elmore et. al. (2002),may not be a reliable strategy. Results from CT07 weremixed: The model’s ability to forecast thunderstorm activitywas encouraging, yet the number of false alarms was high. Itwas surmised that false alarms can be reduced byincorporating more relevant sub-grid scale data, andincreasing the number of relevant NWP parameters thatcontribute to CI. This study represents such an attempt toimprove the ANN’s performance. In Section 2, we discussANNs in a general sense. In Section 3, we describe theframework used to develop this ANN model. Section 4contains a detailed description of the specific data inputs. Inparticular, we discuss how each parameter is related tothunderstorm development, and the specific data processingmethods. In the final sections, the results (Section 5) anddiscussion and conclusions (Section 6) are presented. Portionsof sections 2 and 4 contain information incorporated from ourearlier study (CT07.)2. ARTIFICIAL NEURAL NETWORKSAn Artificial Neural Network (ANN) is a computationalmodel that attempts to account for the parallel nature of thehuman brain. Specifically, it is a network of highlyinterconnecting processing elements (neurons) operating in Corresponding author address: Waylon G. Collins,National Weather Service, 300 Pinson Drive, Corpus Christi,TX 78406; e-mail: Waylon.Collins@noaa.govparallel (Figure 1). An ANN can be used to solve problemsinvolving complex relationships between variables. Theparticular type of ANN used in this study is a supervised one,wherein the observation (target) is specified, and the ANN istrained to minimize the error between the ANN output and thetarget, resulting in an optimal solution (assuming the globalminimum is reached.) This is accomplished by adjusting theconnections between the elements, which involves anadjustment to the weights (w11,1 w11,z in figure 1.) In theory,this adjustment process can be viewed as a form of ‘learning’.Thus, the ANN is considered to be a form of artificialintelligence (AI). ANNs were selected for this study owing totheir ability to model non-linear relationships. Therelationship between the input and output parameters in thisstudy is highly non-linear. Additional information onArtificial Neural Networks can be found in references such asBeale (1990) and Hagan et al. (1996).Figure 1: A 2-layer ANN with multiple inputs and singlehidden and output neurons3. ANN FRAMEWORK3.1 ANN DomainA grid of 13 x 22 equidistant points (20-km grid spacing)was developed which covers a region slightly larger than theCounty Warning and Forecast Area (CWFA) responsibility ofthe National Weather Service (NWS) forecasters in theWeather Forecast Office (WFO) in Corpus Christi Texas(CRP). These points create 286 square regions (hereafterreferred to as ‘boxes’), each of which defines an area of 400km2 (figure 2). A 2-layer (one hidden layer, and one outputlayer), feed-forward, supervised ANN was utilized in thisstudy. A framework was established (using MATLAB software) to train 286 separate ANNs (one for each boxregion) to predict thunderstorm occurrence within each box.With respect to the forecasting of thunderstorms 3 to 24 hoursin advance, NWS forecasters issue public forecasts on theprobability of precipitation from thunderstorm activity.However, the highest forecast resolution for the NWS Zone
Figure 2: ANN Grid of 13 x 22 equidistant points. Northern (Southern) light blue box is labeled 238 (104).Forecast is the county level. The median surface area of the15 counties in the WFO CRP CWFA is approximately 2256km2. Thus an accuracy of 400 km2 would be a significantimprovement. For this study, only one box is examined – aninland region which includes Victoria, Texas (box 238 infigure 2).3.2 ANN Target and InputsThe model was developed based on data obtained from theperiod 1 June 2004 through 31 October 2007. Cloud-toground lightning data served as the proxy for thunderstormactivity and was also the target. The ANN input variableswere chosen based on their physical relationship tothunderstorm development/dissipation. With respect to NWPmodel output, before 20 June 2006, the hydrostatic Eta wasused as the NWP model. Afterward, the non-hydrostaticWRF-NMM (Janjic et. al. 2001) was used. We introduceadditional complexity by incorporating output from twounique NWP models. The Eta and WRF-NMM use differenttechniques to assimilate data, which will result in differentinitial conditions. Owing to the chaotic nature of theatmosphere, these initial condition differences can result indivergent deterministic solutions. Further, since one model ishydrostatic and the other non-hydrostatic, different solutionsare likely. However, based on NWP model simulations,Weisman et al (1997) found that nonhydrostatic simulationseffectively become hydrostatic with horizontal grid spacings 8-km. Since the horizontal grid spacing of the WRF-NMMis 12-km, non-hydrostatic phenomena are not resolved (exceptfor mountain waves) which may decrease solutiondifferences. Nevertheless, we assume that the modeldifferences are not detrimental to this study.Subgrid scale atmospheric processes that directly contributeto CI cannot be accounted for explicitly by the Eta or WRFNMM. Thus, as mentioned previously, we incorporate suchdata. The subgrid scale parameters utilized in this studyinclude proxies for soil moisture, wherein gradients of suchcontribute to local convergence which can trigger convection(e.g. Avissar and Liu, 1996). Further, the contribution ofaerosols are included which can influence convective clouddynamics (van den Heever, 2006).3.3 ANN Forecast StrategyIn this study, we tested the ability of the ANN model toforecast CTG lightning occurrence in box 238 6 and 9 hoursin advance. Figure 3 depicts the forecasting strategy. Theinputs to the ANN (see section 4 for more details) are asfollows:1: NAM Forecasts of parameters 1-19 from the 1200 UTCcycle valid at 1800 UTC (2100 UTC.)2: GOES AOD (parameter 39) observations at 1215, 1415,1615, or 1815 UTC (Assumed equal to value at 1200 UTC).3: NAM parameters 20-35 valid at 1200 UTC (output frommodel initialization)4: Soil moisture-related variables (parameters 36-38) valid at1200 UTC
1200 UTC (fcst hour 0) 1800 UTC (fcst hour 6) 2100 UTC (fcst hour 9)ANN INPUTS 1. NAM parameters 20-352. Soil moisture proxies(parameters 36-38)3. GOES AOD(parameter 39)6-hour forecast of NAMparameters 1-19ANN OUTPUTThunderstorm prediction[0 1]9-hour forecast of NAMparameters 1-19Thunderstorm prediction[0 1]TARGETCloud-to-ground lightning Cloud-to-ground lightningbinary output [0,1]binary output [0,1]AOD observations at 1215, 1415, 1615, or 1815 UTC; assumed equal to value at 1200 UTCParameter 37 (Ndry) valid for previous dayParameters 36 (API gradients) and 38 (MPE gradients) valid for the antecedent 10-day periodFigure 3: Thunderstorm ANN Forecast Strategy3.4 ANN Training and TestingThe ANN model for this study was developed, trained,validated, and tested within the MATLAB computationalenvironment utilizing the Neural Network Toolbox (TheMathWorks, Inc., 2006). The data set (1 June 2004 – 31October 2007) was divided into a training set (40%), avalidation set (20%), and a testing set (40%). All ANNmodels were trained using the automated regularizationalgorithm (trainbr) to improve generalization. The validationset served as a constraint on training, in order to minimizeoverfitting. The testing set was utilized to evaluateperformance. The ANN architecture for this study is a feedforward, supervised, multilayer perceptron (MLP) networkwith two (2) layers – one hidden layer and an output layer.Only one output neuron was used. The transfer function usedin both the hidden and output layers (f1 and f2 in figure 1) islog-sigmoid. One hidden neuron was used for this study.MATLAB requires that the ANN model contain a full inputset. Thus, cases missing an input or target value wereeliminated. In the following section, we provide a detaileddescription of the target (a2 in figure 1) and inputs (P1,P2, .Pzin figure 1) to the ANN.4. ANN TARGET AND INPUTS4.1 Target Data (a2)Cloud to ground (CTG) lightning data (written to netCDFformatted files) was obtained from the National LightningDetection Network (NLDN) (e.g. Orville 1991). Computerscripts were used to extract hourly lightning data for each ofthe 286 boxes, and to write the output to a series of text files.The MATLAB software was used to input the files thenoutput the data into a target matrix. This data was used as aproxy for thunderstorm activity. Thus only thunderstorms thatgenerate CTG lightning strikes detected by NLDN areincluded. The target is binary (lightning versus no-lightning.)Figure 4 reveals a 3-D display of the total number of CTGlightning strikes on the 13 x 22 ANN grid. Note that thegreater number of lightning strikes occurred over thenortheast region. This explains one reason for choosingnortheast region box 238 – to provide the maximum amountof target data to train this supervised ANN.4.2 Input Data (P1, P2, .Pz)4.2.1 NWP model outputThe first category consists of thirty-five (35) outputparameters from a hydrostatic mesoscale NWP model knownas the Eta (e.g. Rogers et. al. 1996) [1 June 2004 – 19 June2006] and a nonhydrostatic NWP model referred to as WRFNMM (Janjic et. al. 2001) [20 June 2006 – 31 October 2007].NCEP introduced the nomenclature NAM (North AmericanMesoscale), which does not refer to a model. Rather, the termNAM is simply a placeholder for the current operationalmesoscale model running on a North American domain. Thus,before 19 June 2006, the NAM was the placeholder for theEta model, and now is the placeholder for the WRF-NMM.Nevertheless, we will hereafter refer to WRF-NMM and Etacollectively as the NAM.We utilized NAM output written to AWIPS (AdvancedWeather Interactive Processing System) Grid 215 (Dey,1998), a Lambert Conformal grid, with a horizontal gridspacing of 12-km (meso-γ scale.) Software written by ArthurTaylor (http://www.weather.gov/mdl/degrib/) of NOAA wasused to extract the interpolated value of each parameter at thecenter of each box, which is assumed to be representative ofthe box. The output was written to a series of text files. Then,a MATLAB software script was written to input these filesto create a matrix containing the data.Number of CTG Lightning Strikes(04-01-2004 to 06-19-2006)The ANN output (thunderstorm forecast) is a value in therange [0.1], valid for 1800 UTC (2100 UTC.) The ANN wastrained using cloud-to-ground lightning binary output as thetarget [0 no lightning; 1 lightning] Lightning “occurs” whenat least 1 cloud-to-ground lightning strike occurs in box 238.15000100005000010105Grid Coordinate (South-North)005Grid Coordinate ( West-East)Figure 4: Total CTG Lightning Strikes (6-1-2004 to 6-192006) on the ANN grid. Point (0:0) represents the southwestcorner (box 1)CI requires sufficient moisture (to generate necessaryhydrometeors), atmospheric instability (to generate updraftsstrong enough to create a charge separation between the liquidand ice phases of water sufficient to generate lightning), and alifting mechanism (to lift air parcels to the level of freeconvection (LFC), above which an unstable equilibriumexists). The NAM output parameters were chosen based ontheir contribution to the foregoing. As mentioned before, a
NWP model with a 12-km horizontal grid spacing isinsufficient to explicitly forecast convection. However, thepurpose of the numerical output is to provide a prediction ofthose parameters that contribute to CI/convective dissipationin the larger mesoscale environment (the subgrid scaleprocesses that contribute to CI are accounted for in theparameters to be discussed later.) The following are theparameters and associated justifications.Parameter 1: Convective precipitation (CP)This is the precipitation that represents a byproduct of theCP process. This input is used because an objective of thisstudy is to provide an ANN that will forecast the timing andpositioning of convection more accurately than the NWPmodel. Ideally, the ANN will learn to correct CP schemebiases and generate more accurate forecasts.Parameters 2-4: Vertical Velocities at pressure levels 925,700, and 500 millibars (VV925, VV700, VV500)In hydrostatic models (e.g. Eta), the vertical velocity termis diagnosed from predicted horizontal motions, instead ofbeing predicted explicitly in non-hydrostatic models (e.g.WRF-NMM). VV925 and VV700 are used as proxies forlower level convergence (due to mesoscale phenomena suchas sea breezes, and synoptic scale features including fronts)based on the reasoning that the continuity of mass relationshiprequires upward vertical velocities resulting from surfaceconvergence. Surface convergence contributes to CI (e.g.Ulanski and Garstang 1978). However, due to its 12-km gridspacing, the Eta cannot resolve the storm scale divergenceresponsible for the initiation of individual convective cells.The purpose of VV700 and VV500 is to account for upperlevel disturbances. Operational experience at the NWSNational Centers for Environmental Prediction (NCEP) StormPrediction Center suggests that as many as 50% ofthunderstorms are of the elevated variety (Banacos andSchultz, 2005). In these instances, the triggering mechanismis not a surface convergent feature (e.g. surface frontalboundary) but rather mid-level (between 900 and 600 mb)convergence (Wilson and Roberts 2006). The subsequentvertical motions would likely be captured at least by VV500.The unstable equilibrium aloft would be captured by theLifted Index (LI), which will be discussed later.Parameters 5-8: U and V components of the wind at 10-mand 850 mb(u-10, v-10, u-850, v-850)Land surface heterogeneity contributes to micro-scale/meso-γ scale wind patterns that can trigger convection.However, strong wind can minimize the gradients generatedby land surface heterogeneity (Dalu et al. 1996; Wang et. al.1996). The lead author postulates that strong wind will thuspreclude thunderstorms that would otherwise be triggered bymesoscale gradients. Thus, it is important to include suchwind as input to the ANN model. Further, the lead author hasexperienced a positive correlation between south/southwestwind at the 850 mb level and atmospheric stability sufficientto preclude CI over deep South Texas. It is hypothesized thatsuch a stable equilibrium condition is caused by the advectionof a drier and warmer mid level air mass moving across theregion from Mexico.Parameter 9: Vertical wind shear between the surface (10-m)and 800 mb (sh0-8)Thunderstorm development within a particular 400 km2region can be influenced by phenomena in adjacent boxes.However, the ANN in this study does not explicitly accountfor such. The present ANN model predicts convection for aparticular box solely based on information for that box.Including the sh0-8 prediction is one way to account for theinfluence of conditions over a broader spatial area. Rotunnoet. al (1988) suggest that when a gust front (the leading edgeof negatively-buoyant air generated by thunderstorms) movesinto a environment with a certain shear profile in the lowest 2km, the subsequent updraft is maximized, which can triggeradditional convection. The sh0-8 parameter approximates the0-2km vertical wind shear. Inputs to the ANN do not includespecific information about the gust front. Thus, this parameteris only useful for cases wherein convection within a particularbox is generated by gust fronts that enter the box fromoutside.Parameter 10: Vertical wind shear between 800mb and 600mb (sh8-6)Crook (1996) has shown that convection initiation could beprevented by strong vertical wind shear above the planetaryboundary layer. Vertical wind shear can precludethunderstorm development if the updraft is weak (Colquhoun1987). The sh8-6 parameter is used as a proxy for the verticalshear encountered by a parcel moving just above theboundary layer.Parameters 11-14: Precipitable water (PW), 850 mb mixingratio, 850 mb relative humidity, and 2-m temperatureThunderstorms cannot develop without sufficientatmospheric moisture. PW is a proxy for atmosphericmoisture by representing rainfall measurement that wouldoccur if 100% of atmospheric moisture were to rain out. Yet,studies have shown the low level mixing ratio and relativehumidity (RH) values have predictive value. Véronique, et al.(1998) found that the combination of CAPE (mentionedbelow), and RH in the lower levels, can help identify regionswhere convection is possible, synoptic weather patternnotwithstanding. Khairoutdinov and Randall (2006) foundthat high CAPE and low CIN are not quite sufficient forconvective development. Rather, the horizontal scale ofconvective clouds must reach a threshold sufficient toovercome the dissipative effects of dry air entrainment, andthat clouds tend to grow from air with the greatest watervapor content. Hence, we include the 850mb mixing ratio.The surface temperature was included since the maximumamount of moisture the air can hold is constrained bytemperature.Parameter 15: Lifted Index (LI)The Lifted Index (LI) is simply the temperature differencebetween the environment and an ascending air parcel at the500mb pressure level. A negative value indicates a parcelwarmer than the surrounding environment, thus positivelybuoyant (unstable equilibrium). As such, it is a measure ofatmospheric stability. Haklander and Delden (2003) foundpredictive value in the use of LI to forecast thunderstorms.Another purpose for inclusion of LI is to account for elevated
convection. Elevated convection tends to occur when upperlevel disturbances move across unstable equilibriumenvironments aloft. As mentioned before, VV700 and VV550will serve as proxies for upper level disturbances, and the LIserves as a measure of upper level instability.Parameters 16-17: Convective Available Potential Energy(CAPE) and Convective Inhibition (CIN)CAPE measures the total energy available to generatethunderstorms. It is computed as the positive area on athermodynamic diagram (e.g. SkewT-LogP). The greater thisvalue, the greater the energy available for thunderstormgeneration. Further, parcel theory indicates that the maximumspeed of an updraft is a simple function of CAPE. However,updrafts in nature are generally weaker than what parcel theorysuggests owing to aerodynamic drag, entrainment, compensatingdownward motions, and the weight of condensed water (e.g.Rogers and Yau, 1989.) The CIN measures the negative area ona thermodynamic chart, which typically represents anatmospheric layer with base at the surface. For non-elevatedconvection to occur, air parcels must be forced from the surfaceto the top of the CIN layer. However, if CIN is too strong, theparcel cannot reach the LFC and thus CI will not occur.Parameter 18: Potential Temperature Drop-offCrook (1996) has shown that convection tends to occur overareas wherein the potential temperature (temperature achievedwhen an air parcel is brought dry adiabatically to 1000 mb) inthe boundary layer is lower than the value at the surface. Crookdefined this difference as the potential temperature drop-off.However in this study, the proxy for the boundary layerpotential temperature is the potential temperature at 900 mb.Parameter 19: Lifting Condensation Level (LCL)Although CAPE measures the total energy available for theconversion to upward vertical velocities, cloud base height(CBH) – according to Williams et. al (2005) – measures theefficiency of this process. A high CBH condition tends to becorrelated with an environment that is more efficient than lowCBH environments in the conversion to strong updraftssufficient for thunderstorm development. The LCL is used as aproxy for CH.Parameters 20-33: U and V components of the wind at thesurface, 900mb, 800mb, 700mb, 600mb, and 500mb at 12 UTCThis data depicts wind velocity behavior at both the lower (sfc700mb) and mid levels (700-500mb). The veering (backing) ofgeostrophic wind with height suggests warm (cold) air advection(e.g. Wallace and Hobbs 1977.) Although the wind is notgeostrophic below 500 mb, it’s assumed that the ageostrophiccomponent of the wind does not prevent a positive correlationbetween veering or backing geostrophic and non-geostrophicwind. Hence, warm air advection (WAA) in the lower levels, inresponse to veering wind, will likely provide additional positivebuoyancy to parcels below the LFC, with backing windproviding negative buoyancy. Yet, the opposite effects occur inthe 700-500mb layer: WAA will likely provide negativebuoyancy, while CAA in this layer will contribute to positivebuoyancy. Thus, veering winds in the lower levels, or backingwinds in the mid levels, will contribute to increased instability(or decreasing stability) and a greater chance for convection.Results from a study by Findell and Eltahir (2003) addedcredence to this reasoning. The ANN should capture theforegoing relationship, hence the inclusion of this data asANN inputs.Parameters 34-35: Low level humidity index and “ConvectiveTriggering Potential”Findell and Eltahir (2003) developed a framework toassess the atmospheric controls on the interaction betweensoil moisture and the boundary layer. In particular, they found(among other things) that the 1200 UTC lower level (900700mb) moisture and environmental lapse rates serve asconstraints on afternoon convective development. Theydefined the humidity index (HIlow) as the sum of the dewpoint depressions at 950 and 850mb. They further defined aConvective Triggering Potential (CTP) as the area (on athermodynamic diagram) between the moist adiabatic and theenvironmental temperature, in the 900-700mb layer.Essentially, the CTP measures the ambient environment’sdeparture from the moist adiabatic rate in the 900-700mblayer. For this study, we incorporate HIlow, yet compute theratio of the mean environmental lapse rate in the 900-700mblayer to the average moist adiabatic rate (assumed to be6.5C/km in every case) as a proxy for CTP.4.2.2 Subgrid scale dataThe second category of input data includes data not explicityaccounted for owing to the 12-km grid spacing of the NAM.We incorporate four (4) variables in this category. The first, isderived from high resolution (4-km grid spacing) rainfalloutput from the multi-sensor precipitation estimator (MPE)algorithm (e.g. Fulton et. al 1998). From this data, theantecedent precipitation index or API, a soil moisture proxy,was calculated. For each day in box 238, the maximumgradient of API (parameter 36) was calculated. A majorcontributor to land surface heterogeneity, soil moisturegradients contribute to differential surface heating andsubsequent microscale/meso-γ scale convergent wind patternswhich in turn contribute to CI (e.g. Avissar and Liu 1996).Taylor and Lebel (1998), hereafter TL98, found a positivecorrelation between daily convective rainfall gradients and thecorresponding 2 and 10-day antecedent gradients, over semiarid locations on convective scales 20-km. In particular, apositive feedback can occur whereby post convectiveevaporation contributes to soil moisture gradients resulting inareas favored for enhancement of subsequent convection/rainfall. According to TL98, this feedback occurs over 2 daysdue to strong soil moisture gradients that develop in responseto bare soil evaporation. The 10-day correlation is related toevaporation of deeper soil moisture, from accumulatedrainfall; yet this correlation was strongest when no rainfalloccurred over during the preceding 4 days (Ndry 4). Sincesoil moisture gradients also contribute to convective initiation(Avissar and Liu 1996; Emori 1998), we incorporate 10-dayantecedent MPE gradients and Ndry parameters, as the secondand third (Parameters 37-38) sub-grid scale inputs in theANN. The calculation of parameters 36-38 are explained inthe Appendix. The fourth subgrid scale data ingest is theAerosol Optical Depth or AOD (Parameter 39), which,according to van Den Heever (2006), may influence cloudmicrophysics, and subsequent storm updraft. We argue that astronger updraft, due to aerosols, could conceivably result in a
thunderstorm, that otherwise would exist only as a convectiveshower (no lightning), without aerosol influence. Further, intheir study of cloud-to-ground lightning over Houston, Texasfor the period 1989-2000, Steiger et. al (2002) postulated thatincreased aerosol concentration may enhance the density ofcloud-to-ground lightning strikes.The AOD data set contains a significant amount of missingdata. Thus, for each day of the time frame analyzed, data fromthe 1215, 1415, 1615, or 1815 UTC were used to increase thelikelihood of acquiring valid data. Further, we assume thatAOD is invariant during the 1200-1815 UTC period. Thisapproach is somewhat reasonable as Anderson et. al. (2003)have shown that AOD temporal variations at a given locationare not significant for time scales 6 hours. Each day, theearliest valid datum of the four was used to predict CI (seefigure 3).Figure 5a: Box 238 Histogram of maximum 10-dayAntecedent Precipitation Gradient -- Non Lightning Cases (11-2003 to 10-31-2007). Gradient refers to finite differences.Units in 10-2 mm (5000 x 10-2 mm 1.9685 in)magnitude for the lightning cases (ignoring zero frequency),consistent with the reasoning that a greater moisture gradientresults in a greater chance for CI (assuming atmosphericconditions are favorable.)Figure 6 depicts corresponding histograms of parameter NdryFor each day in the data set, the number of dry days (noprecipitation in box 238) for the previous 10 days wascalculated. Then, the cases were segregated into lightning andnon-lightning days for the creation of the histograms. Notethat for the lightning cases, the frequency is highest for day 5.Yet for non-lightning cases, the frequency is highest for 8 ofthe 10-day antecedent period. These results suggest that morerain occurred during the 10-day period preceding lightningcases, along with a sufficient number of dry days to generatestrong soil moisture gradients in response to the evaporationof deep soil moisture, consistent with TL98.Figure 6a: Histogram of Ndry -- Non Lightning Cases (1-12003 to 10-31-2007).Figure 6b: Same as 6a, except for Lightning CasesFigure 5b: Same as 5a, except for Lightning Cases.5. RESULTSThe utility of the ANN model in this study was evaluated usingsignal detection theory. In particular, we calculated the model’sFigure 5 depicts histograms of maximum 10-day antecedentROC (Relative Operating Characteristic) curves (Jolliffe andMPE gradients, both for lightning and non-lightning cases, forStephenson, 2003). The ROC graphs the probability of detectionthe 1 January 2003 to 31 October 2007 period in box 238.(POD), and the false alarm rate (FAR). The ROC curve isNote that the highest frequency occurs at a larger gradient
created by computing POD and FAR for varying ANN modelthresholds, then graphing the POD as ordinate and FAR asabscissa. By thresholds, we refer to the minimum value of ANNoutput that is considered an ANN model prediction of theoccurrence of a thunderstorm. We varied the threshold from0.01 to 1.00 using a 0.01 increment. The results are depicted infigure 7. Figures 7a through 7d are based on 6-hour forecasts(F06) valid at 1800 UTC. An accurate forecast occurs when themodel correctly predicts the target (for a given threshold) for the4-hour window (W04) between 1600 and 2000 UTC. Figures 7ethrough 7h are based on 9-hour forecasts (F09) valid at 2100UTC. An accurate forecast occurs when the model correctlypredicts the target (for a given threshold) for the 4-hour (W04)window between 1900 and 2300 UTC. Note that skill has beendemonstrated; the ROC curves for the testing sets are well abovethe diagonal for all thresholds. Thus, the ANN model developedin this study has demonstrated the ability to generalize.Figure 7a : ROC curve for 1st training set: F06 W04Figure 7b: ROC curve for 1st testing set: F06 W04Figure 7c: ROC curve for 2nd training set: F06 W04Figure 7d: ROC curve for 2nd testing set: F06 W04Figure 7e: ROC curve for 1st training set: F09 W04
6. DISCUSSION/CONCLUSIONSWe accessed the performance of an ANN modelingsystem, originally developed by CT07, after incorporating amore comprehensive set of inputs that contribute to CI. The39 inputs include both NWP and sub-grid scale data, much ofwhich possess a strong relationship to CI (not shown.) In thisstudy, the ANN model was used to forecast
environment utilizing the Neural Network Toolbox (The MathWorks, Inc., 2006). The data set (1 June 2004 – 31 October 2007) was divided into a training set (40%), a validation set (20%), and a testing set (40%). All ANN models were trained using the automated regularization algo