Transcription
Data Manipulationhttp://datascience.tntlab.orgModule 5
Today’s Agenda A couple of base-R notes Advanced data typing Relabeling text In depth with dplyr (part of tidyverse) tbl classdplyr grammarGroupingJoins and set operations A warning about dplyr (and packages broadly)
Advanced Data Typing There is no class that stores a single number. Even a -1 creates a vector. Data frames are lists of vectors that act like matrices. Do not try to memorize the coercion rules. Use local testing and use dplyr,which will warn you when it coerces. Be aware that coercion occurs and beon the lookout for situations where it looks like it might happen. Classes are vectors with special characteristics. You can create your ownclasses (e.g., tbl df). Factors will cause you nightmares. Try not to allow anything to be a factoruntil/unless you specifically need a factor.3
Relabeling Text (base R) Create a “lookup table” that is actually a named vector c(“A” “Experimental”, “B” “Control”) For each value in a target vector, get value from lookup table c(“A” “Experimental”, “B” ��B”)] Save this back wherever you want it my df condition - lookuptable[my df condition]4
Heart of Tidyverse Data: tbl class Tibbles are type of data frame with extra features in line with the tidyphilosophy Does not change types from what they obviously should be (don’t needstringsAsFactors FALSE) Easier to work with lists inside tbl documents than with df Does not arbitrarily change column names (e.g., no “my name” to “my.name”) Evaluates arguments sequentially by column Does not allow row names (because rows shouldn’t have names) When you display one, gives more useful information Subsetting consistently returns tbls (not true for a data.frame) Extraction requires complete column names as.tbl, as.tibble, as data frame and is.tbl, is.tibble Use tibble() instead of data.frame()5
Dataframe Pliers (dplyr): Verbs Data wrangling cheat sheet is really handy here Five common types Subset columns, use select() w/helper functions (esp., contains(), matches())Subset rows, use filter(), distinct(), and slice()Sort rows by variables, use arrange(), sometimes with desc()Create new columns, use mutate() and transmute() with window functionsCreate new summary df with summarize() and summary functions All use the standard tidy philosophy and tbls Always specify the tbl first, then verb parameters You are discouraged from subsetting the base-R way, e.g., [, 4:5] or [1:2, ] Try to maintain your data pipeline6
Common Problem at this Stage You will need to either remember or check which functions evaluate valuesand which functions evaluate variables is.character() evaluates a variable is.na() evaluates a value If you forget, dplyr will sometimes fail silently and you will be confused filter(my tbl, is.numeric(x)) What should this be? select(), filter(), arrange() and mutate() modify an existing dataset summarize() creates a new dataset; only variables you specify to be retainedwill be retained Some functions drop referenced variables after use (gather(), spread(),transmute()) and others don’t (mutate()) but you can change this.7
magrittr: Piped Functions Magrittr includes many different types of pipes beyond % %, but % % itself isincluded in all core tidyverse packages You can use magrittr in any code, not just when using dplyr, but they mustadhere to the format: take the output of the previous function and use it asthe first parameter in a second % % is pronounced “then” These are equivalent in final output a - c(1,2,3); mean(a) c(1, 2, 3) % % mean() “Create a vector, then calculate the mean of that vector”8
Best Practices with magrittr On the first line, include any variable assignment plus the source of the dataonly (e.g., could be a data frame itself or the result of a join) new tbl - old tbl % % Indent one tab for each additional verb; try not to nest verbs filter(x 1) % % summarize(mean(x)) Remember that you do not need to do variable assignment if you don’tneed that information later in your code Examples of good magrittr form:new tbl - old tbl % %filter(x 1) % %summarize(mean(x))old tbl % %filter(x 1) % %summarize(mean(x))9
Grouping To create explicit groups, use the group by() verb Does not subset; does not sort; does nothing but create grouping informationwhich is then used by other verbs Once you group by(), you can summarize() and then apply additional verbs Useful if you need within-group summary statistics Most useful for us in the context of exploring multi-level datasets10
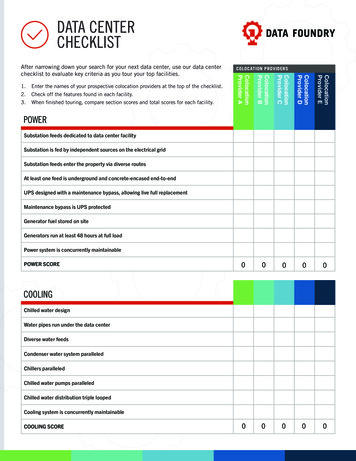
Databases Database logic is everywhere in data science, so it’s best if you learn thelanguage Keys are identifiers in datasetsPrimary keys are unique identifiers, e.g., participant numbersSecondary keys are non-unique identifiers, e.g., condition numbersAll tables should have primary keys, but these primary keys are not always useful respondent dfrIDrNamequestions dfqIDqTextqResponsesanswers dfqIDrIDresponse The above specifications are called a schema11
Schema Diagram(borrowed from stackoverflow.com)12
Joins The two differences between all joins are: what is treated as a key what is dropped Always think about joins as if there are literally two data files side by side: aleft-hand side dataset (LHS) and a right-hand-side datasets (RHS). All join functions take them in that order: join(LHS, RHS, ) Common mistake with joins! Although we’re in tidyverse, the by statement takes a character vector, notvariable quasi-notation13
Mutating Joins Left join: Take the LHS, and add columns to it from the RHS.For rows on the RHS where the LHS key is missing, drop those rows. Right join: Take the RHS, and add columns to it from the LHS.For rows on the LHS where the RHS key is missing, drop those rows. Inner join: Take the LHS, and add columns to it from the RHS.For rows on either side where the key is missing in the other, drop those rows. Full join (aka outer join): Take the LHS, and add columns to it from the RHS.Retain all rows.14
Filtering Joins Semi join: Perform a left join, but run only rows and columns from LHS thatmatch rows in RHS Anti join: Perform a left join, but return only the rows from LHS that did notmatch a row in RHS You can recreate all of these using different joins plus other dplyr functions15
Set Operations union(): Useful for combining observations across multiple identicallyformatted datasets Particularly useful if you have multiple data collection efforts (e.g., two identical orQualtrics surveys) Also useful in combination with other dplyr functions if slightly different Similar to rbind (or bind rows), but only returns unique rows intersect(): Identify rows identical between datasets; less useful for us setdiff(): Identify rows different between datasets; also less useful for us setequal(): Determine if two datasets contain the same data identical(): Determine if two datasets contain the same data in the sameorder16
Raw Data Manipluation bind rows() instead of rbind(), bind cols() instead of cbind() Can bind within lists Very useful when binding rows: Data source indicator variables bind rows(name1 one df, name2 two df, .id “identifier”) You generally want to join instead of bind cols Column binding is only useful when you are 100% certain two data files areformatted the same way This is most valuable as the middle step of several different operations17
Important Warning dplyr is the first package we’ve dived into deeply that is under activedevelopment with frequent updates. New versions can be released any time. Existing functions may be deprecated; this function works for now but maydisappear from the package in the future. Deprecation is generally used toprovide temporary backwards compatibility. New functions may be added that make things easier than they were before. The data wrangling cheat sheet we’ve been looking at is already out-of-date. Example: summarize each() is deprecated and should be replaced withsummarize all(), summarize at(), or summarize if() You can stay up-to-date on packages by reading changelogs or news R updates are accessible by calling news() You can also use news(package “packagename”) but a lot of package maintainersdon’t keep their news updated Google is your friend18
Data wrangling cheat sheet is really handy here Five common types Subset columns, use select() w/helper functions (esp., contains(), matches()) Subset rows, use filter(), distinct(), and slice() Sort rows by variables, use arrange(), sometimes with desc() Create new columns, use mutate() and transmute() with window functions Create new summary df with summarize() and summary functions All use .