Transcription
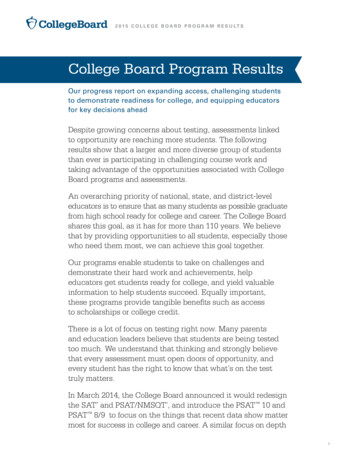
2 0 1 5 C O L L E G E B O A R D P R O G R A M R E S U LT SCollege Board Program ResultsOur progress report on expanding access, challenging studentsto demonstrate readiness for college, and equipping educatorsfor key decisions aheadDespite growing concerns about testing, assessments linkedto opportunity are reaching more students. The followingresults show that a larger and more diverse group of studentsthan ever is participating in challenging course work andtaking advantage of the opportunities associated with CollegeBoard programs and assessments.An overarching priority of national, state, and district-leveleducators is to ensure that as many students as possible graduatefrom high school ready for college and career. The College Boardshares this goal, as it has for more than 110 years. We believethat by providing opportunities to all students, especially thosewho need them most, we can achieve this goal together.Our programs enable students to take on challenges anddemonstrate their hard work and achievements, helpeducators get students ready for college, and yield valuableinformation to help students succeed. Equally important,these programs provide tangible benefits such as accessto scholarships or college credit.There is a lot of focus on testing right now. Many parentsand education leaders believe that students are being testedtoo much. We understand that thinking and strongly believethat every assessment must open doors of opportunity, andevery student has the right to know that what’s on the testtruly matters.In March 2014, the College Board announced it would redesignthe SAT and PSAT/NMSQT , and introduce the PSAT 10 andPSAT 8/9 to focus on the things that recent data show mattermost for success in college and career. A similar focus on depth 1
2 0 1 5 C O L L E G E B O A R D P R O G R A M R E S U LT Sover breadth is informing the redesign of Advanced Placement(AP ) course frameworks and exams so that teachers and studentscan take more time to practice the reasoning skills requiredfor college-level work. The SAT Suite of Assessments and APcourses share a foundational emphasis on evidence-basedreading and writing and real-world context and application. These redesigned courses and assessments will launch on arolling basis, with the first administration of the PSAT/NMSQTand PSAT 8/9 coming in October 2015 and the PSAT 10 andthe SAT in March 2016. Redesigned courses and exams in APArt History and AP European History, along with a new course,AP Research, part of the AP Capstone Program, will launchfor the 2015-16 school year.The following report presents outcomes from the CollegeBoard’s foundational programs for propelling students towardcollege and career. By focusing on these — the PSAT/NMSQT,the SAT, and AP — the 2015 College Board Program Resultshighlight student and state accomplishments and indicateareas for attention and improvement.PROGRAMS THAT CHALLENGE,ASSESS, AND INFORMThe PSAT/NMSQT measures a similar domain of knowledge asthe SAT, while featuring content that is appropriate to grades10 and 11.The PSAT/NMSQT plays a critical, unifying role amongCollege Board programs. In measuring the skills that researchshows are critical for college success, it is designed to ensurestudents’ successful transition to college. It opens doors forimproved instruction, identifies students who are ready forcollege-level course work, and provides access to over 180million in scholarships.2
2 0 1 5 C O L L E G E B O A R D P R O G R A M R E S U LT SPSAT/NMSQT results are the best predictor of a student’spotential to succeed in certain AP courses.1 From these results,educators can identify students with a 60% or higher likelihoodof succeeding in particular AP subjects. Using such data,schools, districts, and states can support access to AP for allacademically prepared students.The SAT is a proven and trusted indicator of college readinessand success for students from all backgrounds. It providesstudents and K–12 educators with a consistent, standardmeasure for assessing college readiness and a fair and validindicator of likely college success. Nearly all four-year collegesand universities use the SAT to evaluate their applicants.The SAT College and Career Readiness Benchmark indicates astudent’s readiness to enter college or career-training programsand to succeed in credit-bearing, entry-level college courses.In fact, high school graduates who reach the benchmark areboth more likely to enroll in a four-year college and graduateon time than those who do not meet the benchmark.2The Advanced Placement Program (AP), offers students theopportunity to pursue college-level course work while still inhigh school. In AP classrooms, students examine texts, data,and evidence; learn to analyze source material; develop andtest hypotheses; and craft effective arguments. They engagein intense discussions, solve problems together, and learn towrite and speak clearly and persuasively. AP Exams are a combination of multiple-choice and freeresponse questions that assess student learning across a rangeof learning objectives. The questions are developed, reviewed,1. Ewing, Camara, and Millsap (2006). The Relationship Between PSAT/NMSQT Scores and AP Examination Grades: A Follow-Up Study. (http://research.collegeboard.org)2. lege-readiness-college-completion.pdf3
2 0 1 5 C O L L E G E B O A R D P R O G R A M R E S U LT Sand approved by committees of subject-matter experts,including college faculty and AP teachers.Students who do well on AP Exams are more likely to graduatefrom college on time and have the potential to save time andmoney through placement and credit-granting policies.3By looking at the 2014-15 results from these three programsindividually and collectively, policymakers, educators, and theCollege Board can work together to identify and dismantle theobstacles that prevent students from realizing their full potential.UNDERSTANDING THE DATAAdministration DataThis refers to the results from a single administration ofan assessment or exam. This report includes three sets ofadministration data for the PSAT/NMSQT, which includes all ofthe test-takers in October 2010, 2013, and 2014. It also includesadministration data for AP from May 2011, 2014, and 2015.AP Potential This free, Web-based tool allows schools to generate rostersof students who are likely to score a 3 or higher on a givenAP Exam. Based on research that shows moderate to strongcorrelations between PSAT/NMSQT scores and AP Examresults, AP Potential is designed to help schools increaseaccess to AP and to ensure that no student who has thechance of succeeding in AP is overlooked.Cohort DataThis report also includes SAT results from the classes of2011, 2014, and 2015, reflecting the most recent resultsthose graduating students took over the course of their highschool career.3. Research Studies: Hargrove, Godin, and Dodd (2008); Mattern, Marini, and Shaw (2013); Morgan and Klaric (2007); Murphy and Dodd (2009).4
2 0 1 5 C O L L E G E B O A R D P R O G R A M R E S U LT SCalculating RatesIn order to calculate participation rates for the PSAT/NMSQTand SAT, a denominator had to be established. These arebased on the Western Interstate Commission for HigherEducation (WICHE) grade-level enrollment and graduateprojections, respectively.4 WICHE has been producing highschool graduate forecasts for over 30 years, for use by a wideand diverse audience of policymakers, enrollment managers,college counselors, schools and school districts, researchers,and the media.The SAT College and Career Readiness BenchmarkThe SAT Benchmark score of 1550 is associated with a 65%probability of obtaining a first-year GPA of B- or higher at afour-year college. It indicates a student’s readiness to entercollege or career-training programs and to succeed in creditbearing, entry-level college courses.PSAT/NMSQT BenchmarkOn the PSAT/NMSQT, benchmarks are section scores thatstudents should meet or exceed to be considered on track tobe college ready. These section scores in 10th or 11th gradepredict, with a 65% probability, a first-year college GPA of 2.67(B-) or higher. PSAT/NMSQT score reports are sent to schoolsand can help students and educators to understand how thestudents are doing relative to their path to college.Next YearWith the introduction of the redesigned SAT Suite ofAssessments, we will have new and different ways to trackand monitor student progress. We will be able to reportthese data beginning with the 2016 College Board ProgramResults. It is important to note that all scores from the SAT,PSAT/NMSQT, PSAT 10, and PSAT 8/9 will be reported on4. http://www.wiche.edu/knocking-8th5
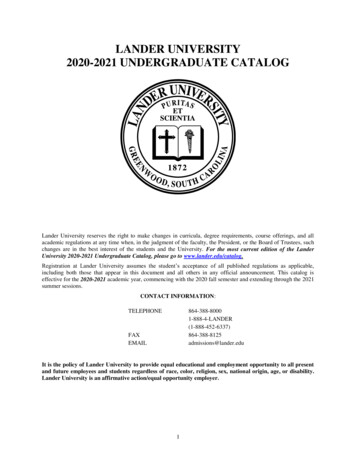
2 0 1 5 C O L L E G E B O A R D P R O G R A M R E S U LT Sa common scale so that students, families, and educatorscan easily track year-by-year progress of individuals, cohorts,and groups. We will also be updating the AP Potential tool toincorporate AP Potential data based on students’ PSAT 8/9,PSAT 10, and SAT results.ACCESS & PARTICIPATIONWithout access to challenging courses and assessments thatmeasure their progress, students will not be able to get the mostout of their opportunities to prepare for college and careers.But access is not a given. It requires that policymakers at alllevels take steps to make sure that challenging courses areavailable, that tests are administered when students can takethem, and that credit is granted when earned. Furthermore, feesmust be waived or reduced for all students with financial need.Results from all three programs show that progress is beingmade in expanding access. Today, a larger, more diverse groupof students than ever before is participating in challengingcourse work and taking actionable assessments.The largest percentage of underrepresented minoritiesàà In 2014-15, a record 3.8 millionstudents benefited fromtaking the PSAT/NMSQT, upfrom 3,654,158 in 2013-14 and3,558,270 in 2010-11.3.8 million 2014-153.7 million 2013-143.6 million 2010-11àà 35.1% were underrepresented minority students, compared to 34.0% in2013-14 and 33.0% in 2010-11.àà In October 2014, 43.6% of the nation’s 10th-graders and 41.5% of thenation’s 11th-graders took the PSAT/NMSQT.6
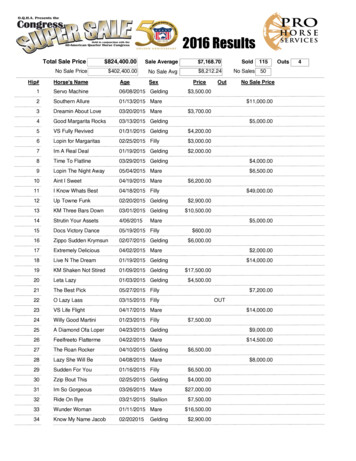
2 0 1 5 C O L L E G E B O A R D P R O G R A M R E S U LT SGrowing participation across all demographicsàà A record 1.70 million studentsfrom the class of 2015 took theSAT, compared to 1.67 millionstudents from the graduatingclass of 2014 and 1.65 millionin the class of 2011.1.70 million Class of 20151.67 million Class of 20141.65 million Class of 2011àà 32.5% were underrepresented minority students, compared to 31.3% inthe class of 2014 and 29.0% in the class of 2011.àà 25.1% of SAT takers in the class of 2015 took the exam using a feewaiver, compared to 23.6% from the class of 2014 and 21.3% from theclass of 2011.Record number of students gain access; record number of examsàà 2.5 million students took an APExam in 2015, compared to 2.3million in 2014 and just under2.0 million in 2011.2.5 million 20152.3 million 20142.0 million 2011àà 26.2% were underrepresented minority students, compared to 26.0% in2014 and 23.9% in 2011.àà 22.1% were low-income students, compared to 21.7% in 2014 and 18.7%in 2011.àà Schools administered a record4.5 million AP Exams in 2015,an increase from 4.2 million in2014 and 3.5 million in 2011.4.5 million 20154.2 million 20143.5 million 20117
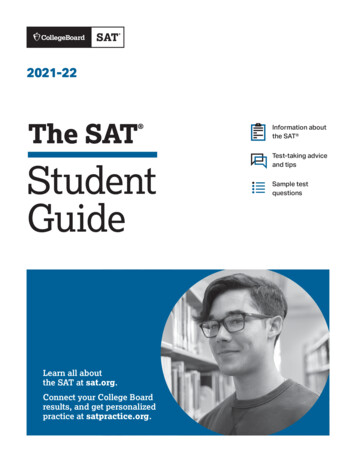
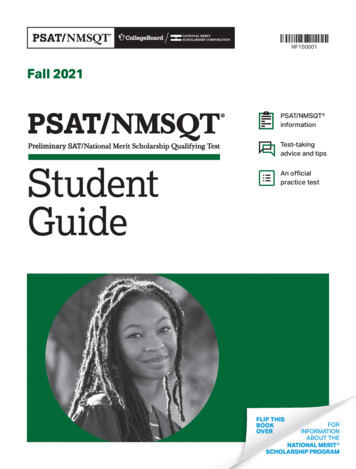
2 0 1 5 C O L L E G E B O A R D P R O G R A M R E S U LT SPERFORMANCE & SUCCESSBy monitoring student progress in high school, ourassessments can help educators to identify an individualstudent’s potential as well as students in need of additionalsupport. By making the benefits clear to students andfamilies, we can ensure that they are taking advantage of theopportunities they have earned through their hard work.Just as important, our assessments serve to alert state andlocal policymakers to trouble spots — including communitiesor groups in need of attention or course work in need ofimprovement. This information can serve as a powerfulleverage for school administrators and policymakers to gainand deploy educational resources.10TH-GRADERSOver 712,000 (39.3%) 10th-grade PSAT/NMSQT takers met thegrade-level benchmark, indicative of being on track for collegeand career readiness.àà 16.7% of 10th-grade African American PSAT NMSQT takers metthe benchmark.àà 61.5% of 10th-grade Asian PSAT/NMSQT takers met the benchmark.61.5%àà 19.8% of 10th-grade Hispanic PSAT/NMSQTtakers met the benchmark.54.7%39.3%àà 24.6% of 10th-grade Native AmericanPSAT/NMSQT takers met the benchmark.24.6%16.7%19.8%àà 54.7% of 10th-grade white PSAT/NMSQTtakers met the mericanOverall8
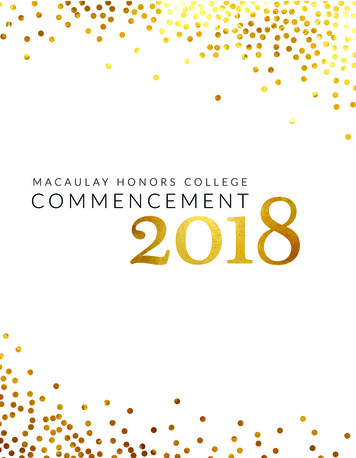
2 0 1 5 C O L L E G E B O A R D P R O G R A M R E S U LT SAP POTENTIAL IDENTIFIED IN THE 10TH GRADEàà Roughly 520,000 10th-grade PSAT/NMSQT takers overall showed highpotential to succeed in at least one AP course.àà Over 76,000 underrepresented minority 10th-grade test-takers showedhigh potential for AP success.11TH-GRADERSNearly 766,000 (48.0%) 11th-grade PSAT/NMSQT takers metthe grade-level benchmark, indicating that they are on trackfor college and career readiness.àà 21.9% of 11th-grade African American PSAT/NMSQT takers metthe benchmark.àà 65.0% of 11th-grade Asian PSAT/NMSQT takers met the benchmark.65.0%61.2%àà 25.3% of 11th-grade Hispanic PSAT/NMSQTtakers met the benchmark.àà 34.3% of 11th-grade Native AmericanPSAT/NMSQT takers met the benchmark.àà 61.2% of 11th-grade white PSAT/NMSQTtakers met the HispanicNativeWhiteAmericanOverallMore than 712,000 students (41.9% of SAT takers in the class of2015) met the SAT College and Career Readiness Benchmark.àà 16.1% of African American SAT takers met the benchmark.àà 61.3% of Asian SAT takers met the benchmark.61.3%52.8%àà 22.7% of Hispanic SAT takers metthe benchmark.41.9%32.7%àà 32.7% of Native American SAT takersmet the benchmark.àà 52.8% of white SAT takers met the tiveWhiteAmericanOverall9
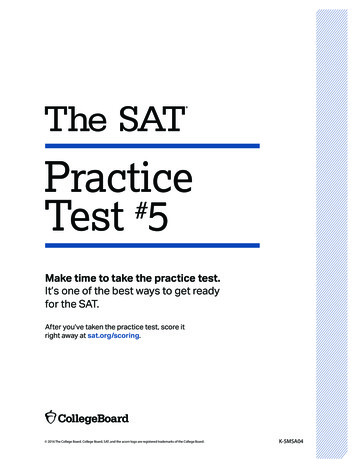
2 0 1 5 C O L L E G E B O A R D P R O G R A M R E S U LT SMore than 1.5 million students (60.5%) scored 3 or higher onan AP Exam in 2015, compared to 1.4 million in 2014 and 1.2million in 2011.àà 32.3% of African American examinees scored 3 or higher on at leastone AP Exam.àà 72.2% of Asian examinees scored 3 or higheron at least one AP Exam.72.2%66.0%60.5%50.0%àà 50.0% of Hispanic examinees scored 3 orhigher on at least one AP Exam.46.2%32.3%àà 46.2% of Native American examineesscored 3 or higher on at least one AP Exam.àà 66.0% of white examinees scored 3 orhigher on at least one AP anOverallThese data points are more than just numbers. They representthe hard work of high school students — and indicate theirlevel of readiness for college and future careers. Our students’efforts are worth celebrating, and their challenges must berecognized and systematically addressed and overcome.10
2 0 1 5 C O L L E G E B O A R D P R O G R A M R E S U LT SThree Areas ofStrategic ChallengeHow policymakers and the College Board can make a differencetogether to ensure that growth in access and performancecontinues to be benefit-driven for studentsThe College Board’s commitment and strategic initiatives aremaking a positive difference in these areas of urgent nationalimportance: Encouraging more students to think about higher educationby providing them with appropriate access to take criticalassessments to strengthen their readiness for college. Helping students to make the most of their collegeexperience and to graduate in four years. Inspiring and preparing more students to become thescience, technology, engineering, and math professionalsour nation needs.11
2 0 1 5 C O L L E G E B O A R D P R O G R A M R E S U LT S SAT SCHOOL DAY: Improving access,participation, and performance.InnovationIt’s a simple concept with profound implications: Let studentstake the SAT in their own school during normal school hours.That’s what the College Board’s SAT School Day program does.It enables states and districts to engender a college-goingculture in their schools by allowing their juniors and seniors totake the SAT in their school on a regular school day. Doing soeliminates many common complications of Saturday testing— such as part-time jobs, family responsibilities, or findingtransportation — and thereby encourages more students topursue a college education.BenefitsThe SAT School Day program provides tangible benefitsfor students and their families. Taking tests at school on aweekday enables students to attend to their weekend needs,events, and obligations. The program eliminates the obstacleof securing transportation or locating an out-of-school site fortesting and therefore increases the likelihood that a studentwill take this important step toward college and career. SATSchool Day also offers the benefit to all students of providinga credential to apply to any type of college. Additionally,taking the SAT in a familiar surrounding around familiar staffeliminates test-day stress and could improve students’ overallperformance.ImpactStatistics would suggest that when a state administers theSAT to all its students, we would witness a fall in performanceas participation increased. However, after establishing a newbaseline with the initial introduction of SAT School Day, all12
2 0 1 5 C O L L E G E B O A R D P R O G R A M R E S U LT Swho made this commitment to access are showing growth intheir results.As the data from Maine, Idaho, Washington, D.C., andDelaware show, SAT School Day is broadening opportunitiesfor all students and particularly for Hispanic/Latino and AfricanAmerican students. These results show significant increasesin performance with expanded access.MaineWashington, D.C.Since its commitment in 2007 toproviding college access to alljuniors, Maine has continued itsdrive to support all students, asis evident with 98.3% of Mainepublic school students from theclass of 2015 taking the SAT, upfrom 97.4% the prior year. In thatsame time period, performanceticked up 0.1% as well.The percentage of AfricanAmerican public school students inthe class of 2015 meeting the SATBenchmark has held steady evenas the number of students takingthe SAT has increased by 25%.IdahoIn 2013, 1,740 students metthe benchmark. In 2015 thatnumber of successful studentsmore than doubled, with 4,250meeting the benchmark.DelawareHispanic/Latino performancehas increased significantly sinceimplementing SAT School Day,starting from 8.1% in 2013 andimproving to 9.9% and 10.7% for2014 and 2015, respectively. Allwhile participation among thisgroup steadily increased.ConclusionAs policymakers and administrators seek additional ways tohelp students move toward college, scheduling the SAT on aschool day clearly works. It relieves students of a number ofthe conflicts and inconveniences of weekend testing. Evenbetter, this approach seems to benefit groups of traditionallyunderrepresented students. They are responding well to theencouragement of their own schools and the efforts to makeassessments more convenient and less daunting. That’s astrong incentive for policymakers and administrators to makeSAT School Day available in their districts.13
2 0 1 5 C O L L E G E B O A R D P R O G R A M R E S U LT S AP CREDIT POLICY: Granting college creditfor AP enhances the college experience andimproves four-year graduation rates.InnovationThe Advanced Placement Program (AP) is a collaboration amongcollege faculty and secondary school teachers, which providesexciting, in-depth classroom experiences and gives studentsthe opportunity to engage in challenging subject matter.Research shows that having a successful experience with APcourses and exams can give students an important edge towardgetting into college, staying in college, and graduating on time.Increasingly, states and state university and college systemsare recognizing the importance of clear, consistent AP creditpolicies, which encourage high school students to pursue thisrigorous course work. When colleges grant credit, placement,or both for a successful AP Exam, it gives students greaterflexibility in directing their college experience.Recently Virginia, Texas, and Illinois joined 14 other statesthat award college credit statewide or systemwide to studentsearning scores of 3 and higher on AP GALAAKFLHI*CaliforniaState University SystemState College & Universities†Minnesota14
2 0 1 5 C O L L E G E B O A R D P R O G R A M R E S U LT SBenefitsFirst and foremost, AP credit policies benefit students.Gaining credit for AP creates new opportunities and optionsfor college students, ranging from double majoring, earningadditional minors, spending a semester abroad, or workingduring college.Using AP credit allows students to advance more quickly intoadvanced course work. Research shows that AP students whotook at least one AP Exam take more — not fewer — collegeclasses in their chosen discipline. In a time when the majority ofstudents are taking six or more years to graduate, students whoearn a 3 or higher on an AP Exam are more likely to earn theircollege degree on time in four years. This can save studentsand their families a significant amount of time and money.There are also benefits to high schools, colleges, anduniversities. A strong AP credit and placement policyensures that universities and colleges recognize AP students’academic achievement and simultaneously provides theseinstitutions with an innovative solution to improve retentionand ensure on-time degree completion. Such policies alsoencourage participation across diverse groups. This gives highschools and districts a powerful tool to close the access andachievement gap.15
2 0 1 5 C O L L E G E B O A R D P R O G R A M R E S U LT SImpactHere’s a look at some of the AP participation and performancedata in states that have AP credit policies in place. Credit policyis not the only contributing factor to these outcomes, but what’simportant to consider are the benefits of helping this growinggroup of students.ArizonaKentuckyArizona has increased thenumber of successful AP Examtakers by almost 7,000 studentssince 2010.Almost 30,000 AP Exams takenin Kentucky in 2015 earned aqualifying score of 3 or higher,an increase of 59% since 2010when the legislation passed.IndianaNearly 24,000 AP examinees inIndiana scored a 3 or higher in2015 — an increase of 5% since2014 (up 57% since 2010).ConclusionResearch consistently shows that students who earn scores of3 or higher are more likely to earn higher GPAs in college, aremore likely to earn their college degree on time in four years,5and have higher graduation rates. Statewide AP credit policiesallow students to capitalize on their efforts in high school andearn the flexibility to make the most of their time in college.5. Research Studies: Hargrove, Godin, and Dodd (2008), Mattern, Marini, & Shaw (2013), Morgan & Klaric (2007), Murphy & Dodd (2009)16
2 0 1 5 C O L L E G E B O A R D P R O G R A M R E S U LT S AP STEM: How improvements in our highschool courses can help the United Statesdevelop professional talent for vitally neededSTEM careers.InnovationAccording to the Bureau of Labor Statistics, the need for jobsin science, technology, engineering, and math is expected toincrease by 13% between 2012 and 2022 (vs. 11% growth forall occupations).6 As a nation, we are not graduating nearlyenough STEM majors to meet this need.The shortages are noticeable beginning in high school: Notenough of our high school students are taking advancedclasses in the STEM disciplines. This is especially true ofqualified female and underrepresented minority students.In fact, national studies show that among students withcomparable levels of readiness for AP STEM course work,participation rates vary significantly across race and gender.AP courses in STEM subjects are a promising lever forimproving the nation’s readiness for competition in criticalprofessions.BenefitsResearch7 shows that students who do take AP mathand science are more likely than non-AP students to earndegrees in physical science, engineering, and life sciencedisciplines — fields leading to careers essential for the nation’scompetitive success and future prosperity. That’s why gettingmore students into AP STEM courses is one immediate way toproduce more candidates for college majors in the STEM fields.6. 2010/05/BLS-STEM-Jobs-report-spring-2014.pdf7. Mattern, K. D., Shaw, E. J., Ewing, M. (2011). Is AP exam participation and performance related to choice of college major? (College Board Research Report 2011-6). New York:The College Board. and-performance-related-choice17
2 0 1 5 C O L L E G E B O A R D P R O G R A M R E S U LT SImpactIn the 2014-15 school year, several new programs contributedto this effort. AP Physics B was split into two separate, full-yearcourses to give teachers the time they need to help studentsdevelop a deep understanding of foundational physicsprinciples through an inquiry-based instructional approach.Sustained attention on the importance of access to computerscience education, and the support of programs and partnerslike AP STEM Access and Code.org, have also shown results.In their inaugural year, AP Physics 1 and 2 showed the largestgrowth of any courses in the history of AP. The diversity ofthe class is also worth noting. Female, African American,Hispanic, and Native American students made significantparticipation gains with the introduction of the redesigned APPhysics 1 and 2 Exams, but remain underrepresented:àà The number of female students taking AP Physics 1 or 2 in 2015 (70,994)more than doubled compared to the number who took AP Physics B in2014 (32,497).àà 39.5% of AP Physics 1 or 2 examinees were female in 2015, up from34.7% of AP Physics B examinees in 2014.àà The number of underrepresented minority students taking AP Physics 1or 2 in 2015 (36,953) more than doubled compared to the number whotook AP Physics B in 2014 (15,920).àà 20.5% of AP Physics 1 or 2 examinees were underrepresented minoritystudents in 2015, up from 17.0% of AP Physics B examinees in 2014.Another STEM course showing the benefits of increasedattention is AP Computer Science A. It grew 18% from 2011to 2012, 19% from 2012 to 2013, 26% from 2013 to 2014, and25% from 2014 to 2015. Female students made noticeableparticipation gains in AP Computer Science A, but remainunderrepresented.18
2 0 1 5 C O L L E G E B O A R D P R O G R A M R E S U LT Sàà 22.0% of AP Computer Science A examinees were female in 2015, upfrom 20.0% in 2014.àà 10,778 female students took Computer Science A in 2015, up from 7,846in 2014.The AP STEM Access program was the result of acollaboration among Google, DonorsChoose.org, and theCollege Board. Using a 5 million grant from Google, 320 highschools offered 527 AP STEM courses for the first time.àà The most popular course adopted was Environmental Science, followedby Computer Science A.àà In the first year of the program, almost 10,000 students took an APSTEM Exam — for 47% of these, it was their first AP STEM experience.àà More than half of these exam takers were females and/or traditionallyunderrepresented minorities.àà The AP STEM Access program helped drive an 11.3% growth in thenumber of female students taking AP STEM exams.ConclusionThe College Board recognizes that further action should betaken to adequately prepare students for STEM careers.Accordingly, the AP Program has expanded its offeringsin this subject area. The AP Computer Science Principlescourse was designed with the goal of creating leaders incomputer science fields and attracting students who aretraditionally underrepresented with real-world applicationsand multidisciplinary opportunities. Schools and districtscan do their part by ensuring these classes are available, andthat they are using resources like AP Potential to identify andencourage qualified students to try these fields.19
2 0 1 5 C O L L E G E B O A R D P R O G R A M R E S U LT SLooking ForwardAs this report demonstrates, access to challenging coursesand assessments is increasing — and that’s a clear andhopeful sign. However, assessments can no longer stand alonein American education. They must also create opportunitiesfor all students.In the coming years, student results reflected in this reportwill evolve as data, information, and opportunities build on thefoundation of our redesigned courses and assessments. We willwork to examine additional facets of the educational landscape,including a closer look at students attending rural schools.Practice will become an integral tool for all students throughKhan Academy and other resources. Since its launch in June2015, 70,000 visitors went onto the site on the first day alone,with more than 2 million hits and 750,000 questions similar tothose on the SAT completed by 150,000 students. This is only the beginning. Together with our partners andengaged policymakers, we will also offer students careerexploration opportunities through partnerships with ProjectLead The Way, Code.org, the National Math and ScienceInitiative, and more.We will connect students to institutional aid, scholarships,and free resources to help them plan for college and careers.Most important, we will continue to ensure that studentsleverage their hard work and earn the opportunities theydeserve. 2015 The Colle
rolling basis, with the fi rst administration of the PSAT/NMSQT and PSAT 8/9 coming in October 2015 and the PSAT 10 and the SAT in March 2016. Redesigned courses and exams in AP Art History and AP European History, along with a new course, AP Research, part of the AP Capstone Program,