Transcription
Non-GAAP Supplemental Materials
Non-GAAP Supplemental MaterialsIn an effort to provide investors with additional information regarding the company's results as determined by generally accepted accountingprinciples (GAAP), the company also discusses, in its Investor Briefing materials and presentations, the following Non-GAAP information whichmanagement believes provides useful information to investors.Operating (Non-GAAP) Earnings Per Share and Related Income Statement ItemsManagement presents certain financial measures excluding the effects of certain acquisition-related charges, non-operating retirement-related costs,and any related tax impacts. Management uses the term "operating" to describe this view of the company's financial results and other financialinformation. For acquisitions, these measures exclude the amortization of purchased intangible assets and acquisition-related charges such as inprocess research and development, transaction costs, applicable restructuring and related expenses, and tax charges related to acquisitionintegration. For retirement-related costs, the company has characterized certain items as operating and others as non-operating. The companyincludes service cost, amortization of prior service cost and the cost of defined contribution plans in its operating results. Non-operating retirementrelated costs include interest cost, expected return on plan assets, amortized actuarial gains/losses, the impacts of any plancurtailments/settlements, multi-employer plan costs, pension insolvency costs, and other costs. Non-operating costs primarily relate to changes inpension plan assets and liabilities which are tied to market performance, and management considers these costs to be outside the operationalperformance of the business. Management’s calculation of these operating measures, as presented, may differ from similarly titled measuresreported by other companies.Overall, management believes that providing investors with an operating view as described above provides increased transparency and clarity intoboth the operational results of the business and the performance of the company’s pension plans, improves visibility to management decisions andtheir impacts on operational performance, enables better comparison to peer companies, and allows the company to provide a long term strategicview of the business going forward. For the 2015 earnings per share roadmap, the company is utilizing an operating view to establish its objectivesand track its progress. The company’s segment financial results and performance reflect operating earnings, consistent with the company’smanagement and measurement system. 2013 International Business Machines Corporation
Non-GAAP Supplemental MaterialsConstant CurrencyManagement refers to growth rates at constant currency or adjusting for currency so that certain financial results can be viewed without the impact offluctuations in foreign currency exchange rates, thereby facilitating period-to-period comparisons of the company's business performance. Financialresults adjusted for currency are calculated by translating current period activity in local currency using the comparable prior year period’s currencyconversion rate. This approach is used for countries where the functional currency is the local currency. Generally, when the dollar eitherstrengthens or weakens against other currencies, the growth at constant currency rates or adjusting for currency will be higher or lower than growthreported at actual exchange rates.Cash FlowManagement uses a free cash flow measure to evaluate the company’s operating results, plan share repurchase levels, evaluate strategicinvestments and assess the company’s ability and need to incur and service debt. The entire free cash flow amount is not necessarily available fordiscretionary expenditures. The company defines free cash flow as net cash from operating activities less the change in Global Financingreceivables and net capital expenditures, including the investment in software. A key objective of the Global Financing business is to generate strongreturns on equity, and increasing receivables is the basis for growth. Accordingly, management considers Global Financing receivables as a profitgenerating investment, not as working capital that should be minimized for efficiency. Therefore, management includes presentations of both freecash flow and cash flow from operations that exclude the effect of Global Financing receivables.PCD and PrintersManagement presents certain financial results excluding the effects of the divestitures of the printer business and the personal computer (PCD orPC) business. In June 2007, the company divested 51 percent of its printer business and divested the remaining 49 percent quarterly over thefollowing 3 years. In April 2005, the company completed the sale of its PCD business. Management believes that presenting certain revenuemeasures without these items is more representative of the company’s operational performance and provides additional insight into, and clarifies thebasis for, historical and/or future performance, which may be more useful for investors. 2013 International Business Machines Corporation
Non-GAAP Supplemental MaterialsPLM GainManagement presents certain financial results excluding the effects of the PLM divestiture. In 2010, the company completed the sale of its activitiesassociated with the sales and support of Dassault Systemes’ (Dassault) product lifecycle management (PLM) software, including customer contractsand related assets to Dassault. Given this sale, management believes that presenting financial information regarding revenue and software segmentrevenue without this item is more representative of operational performance and provides additional insight into, and clarifies the basis for, historicaland/or future performance, which may be more useful for investors. 2013 International Business Machines Corporation
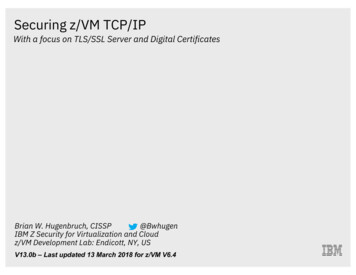
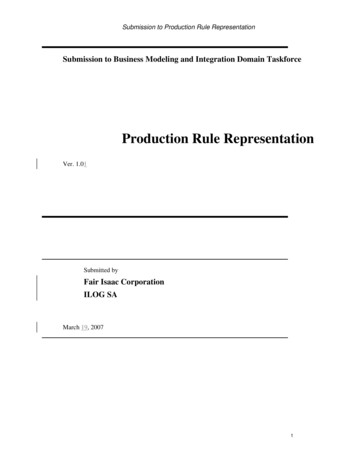
Non-GAAP Supplemental MaterialsGAAP and Operating (Non-GAAP) – FY 2000 and FY 2012Operating Pre-Tax Income in billions2000GAAPOperating(Non-GAAP)PTI Total IBM 10.2 8.62012GAAPOperating(Non-GAAP)PTI Total IBM 21.9 23.2The above serves to reconcile the Non-GAAP financial information contained in Ginni Rometty’s remarks. See slide two in these supplemental materials for additional information on the use of these Non-GAAPfinancial measures. 2013 International Business Machines Corporation
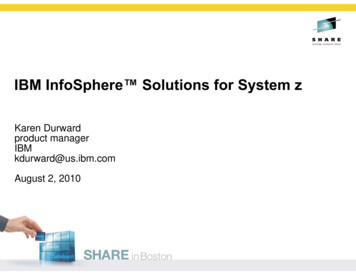
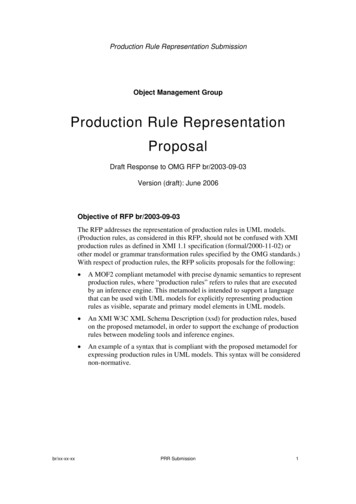
Non-GAAP Supplemental MaterialsReconciliation of Free Cash Flow (excluding GF Receivables) in Billions20002001200220032004200520062007Net Cash from Operations 8.6 13.7 13.8 14.5 15.3 14.9 15.0 12 18.8 20.8 19.5 19.8 (3.7)(4.0)(4.1)(4.3)14.315.116.316.618.2Less: Global Financing ReceivablesNet Cash from Operations (excluding GF Receivables)Net Capital ExpendituresFree Cash Flow (excluding GF Receivables)Net Cash from OperationsLess: Global Financing ReceivablesNet Cash from Operations (excluding GF Receivables)Net Capital ExpendituresFree Cash Flow (excluding GF Receivables)The above serves to reconcile the Non-GAAP financial information contained in “Cash Generation and Usage” contain in the “Financial Model” presentation. See the third slide inthese supplemental materials for additional information on the use of these Non-GAAP financial measures. 2013 International Business Machines Corporation
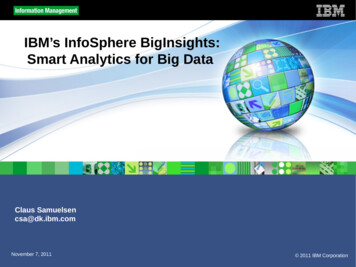
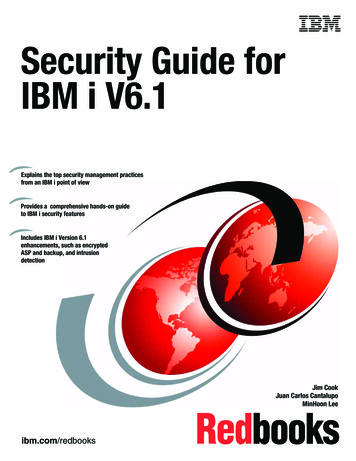
Non-GAAP Supplemental MaterialsReconciliation of Major Markets Revenue Growth20082009201020112012As ReportedYr/Yr@ Constant Currency5%(8%)1%5%(4%)2%(6%)1%2%(1%)Reconciliation of Growth Markets Revenue Growth20082009201020112012As ReportedYr/Yr@ Constant Currency10%(3%)16%16%4%10%1%11%11%7%The above serves to reconcile the Non-GAAP financial information contained in the slides entitled “Growth Markets” in the “Financial Model” presentation.See the third slide in these supplemental materials for additional information on the use of these Non-GAAP financial measures. 2013 International Business Machines Corporation
Non-GAAP Supplemental MaterialsReconciliation of Growth Markets Revenue Mix20002006AsReportedExcluding Divestitures(PCD and Printers)13%16%11%16%The above serves to reconcile the Non-GAAP financial information contained in the slide entitled “Growth Markets” and “IBM presence in Growth Markets” inthe “Financial Model” and “Sales and Distribution” presentations. See the third slide in these supplemental materials for additional information on the use ofthese Non-GAAP financial measures. 2013 International Business Machines Corporation
Non-GAAP Supplemental MaterialsGAAP to Operating (Non-GAAP) Bridge – FY 2000 and FY 2006Operating Segments Pre-Tax Income *2000**GAAPAcquisitionrelatedAdjustments***PTI Margin -Software20.8%(2.0) pts0.4 pts19.1%PTI Margin -Services12.7%(2.3) pts0.0 pts10.4%PTI Margin –Hardware/Financing9.4%(1.6) pts0.2 pts8.0%PTI Margin –Software26.9%0.3 pts0.9 pts28.1%PTI Margin –Services9.7%0.3 pts0.3 pts10.3%PTI Margin –Hardware/Financing11.8%0.3 pts0.0 pts12.1%Retirement-relatedAdjustments ****Operating(Non-GAAP)2006*Sum of operating segment pre-tax income not equal to IBM operating pre-tax income. **Stock-based compensation expense was not recorded at the segment level and excludes Enterprise Investments PTI( 297) million. *** Includes amortization of purchased Intangibles, in process R&D, severance cost for acquired employees, vacant space for acquired companies, deal costs and acquisition integration taxcharges. **** Includes retirement related interest cost, expected return on plan assets, recognized actuarial losses or gains, amortization of transition assets, other settlements, curtailments, multi-employerplans and insolvency insurance.The above serves to reconcile the Non-GAAP financial information contained in the slide entitled “Operating Leverage” in the “Financial Model” presentation. See the third slide in these supplemental materialsfor additional information on the use of these Non-GAAP financial measures. 2013 International Business Machines Corporation
Non-GAAP Supplemental MaterialsGAAP to Operating (Non-GAAP) Bridge – FY 2000, FY 2006 and FY 2012Operating Pre-Tax Income2000GAAPAcquisitionrelatedAdjustments*PTI Total IBM12.0%(2.1) pts0.2 pts10.1%14.6%0.3 pts0.4 pts15.3%21.0%0.7 pts0.5 pts22.2%Retirement-relatedAdjustments **Operating(Non-GAAP)2006PTI Total IBM2012PTI Total IBM* Includes amortization of purchased Intangibles, in process R&D, severance cost for acquired employees, vacant space for acquired companies, deal costs and acquisition integration tax charges. ** Includesretirement related interest cost, expected return on plan assets, recognized actuarial losses or gains, amortization of transition assets, other settlements, curtailments, multi-employer plans and insolvencyinsurance.The above serves to reconcile the Non-GAAP financial information contained in the slide entitled “Operating Leverage” in the “Financial Model” presentation. See the third slide in these supplemental materialsfor additional information on the use of these Non-GAAP financial measures. 2013 International Business Machines Corporation
Non-GAAP Supplemental MaterialsGAAP and Operating (Non-GAAP) - FY 2000 and FY 2006Operating Pre –Tax Income*GAAPOperating(Non-GAAP)PTI Mix –Software25%27%PTI Mix -Services40%38%35%35%PTI Mix –Software40%40%PTI Mix –Services37%37%23%23%2000**PTI Mix - Hardware/Financing2006PTI Mix–Hardware/Financing*Sum of operating segment pre-tax income mix does not equal to IBM operating pre-tax income. **Stock-based compensation expense was not recorded at the segment level and excludes EnterpriseInvestments.The above serves to reconcile the Non-GAAP financial information contained in the slide entitled “Operating Leverage” in the “Financial Model” presentation. See the third slide in these supplemental materialsfor additional information on the use of these Non-GAAP financial measures. 2013 International Business Machines Corporation
Non-GAAP Supplemental MaterialsReconciliation of Revenue GrowthFY12 Yr/YrGlobal Technology Services - Growth MarketsAsReported@Constant Currency5%9%The above serves to reconcile the Non-GAAP financial information contained in the slide entitled “Growth Markets” in the “Making Markets through Services:Global Technology Services” presentation. See the third slide in these supplemental materials for additional information on the use of these Non-GAAPfinancial measures. 2013 International Business Machines Corporation
2013 International Business Machines Corporation
Free Cash Flow (excluding GF Receivables) 14.3 15.1 16.3 16.6 18.2 Reconciliation of Free Cash Flow (excluding GF Receivables) The above serves to reconcile the Non-GAAP financial information contained in “Cash Generation and Usage” contain in t