Transcription
Understanding the Momentum Risk Premium:An In-Depth Journey ThroughTrend-Following Strategies Paul JusselinQuantitative ResearchAmundi Asset Management, Parispaul.jusselin@amundi.comEdmond LezmiQuantitative ResearchAmundi Asset Management, Parisedmond.lezmi@amundi.comHassan MalongoQuantitative ResearchAmundi Asset Management, Parishassan.malongo@amundi.comCôme MasselinQuantitative ResearchAmundi Asset Management, Pariscome.masselin@amundi.comThierry RoncalliQuantitative ResearchAmundi Asset Management, Paristhierry.roncalli@amundi.comTung-Lam DaoIndependent ResearcherParisdaotunglam2001@gmail.comSeptember 2017AbstractMomentum risk premium is one of the most important alternative risk premia. Sinceit is considered a market anomaly, it is not always well understood. Many publicationson this topic are therefore based on backtesting and empirical results. However, someacademic studies have developed a theoretical framework that allows us to understandthe behavior of such strategies. In this paper, we extend the model of Bruder andGaussel (2011) to the multivariate case. We can find the main properties found inacademic literature, and obtain new theoretical findings on the momentum risk premium. In particular, we revisit the payoff of trend-following strategies, and analyzethe impact of the asset universe on the risk/return profile. We also compare empiricalstylized facts with the theoretical results obtained from our model. Finally, we studythe hedging properties of trend-following strategies.Keywords: Momentum risk premium, trend-following strategy, cross-section momentum,time-series momentum, alternative risk premium, market anomaly, diversification, correlation, payoff, trading impact, hedging, skewness, Gaussian quadratic forms, Kalman filter,EWMA.JEL classification: C50, C60, G11. The authors are very grateful to Alexandre Burgues, Edouard Knockaert, Didier Maillard, RaphaëlSobotka and Bruno Taillardat for their helpful comments. Thierry Roncalli would like to thank BenjaminBruder and Nicolas Gaussel who first developed the theoretical framework in the univariate case. He is alsovery grateful to Tung-Lam Dao, who worked on the multivariate case during his internship in 2011 andobtained some of the formulas presented in this working paper. It was logical that Tung-Lam should be ourco-author. Corresponding author: thierry.roncalli@amundi.com1Electronic copy available at: https://ssrn.com/abstract 3042173
Understanding the Momentum Risk Premium1IntroductionMomentum is one of the oldest and most popular trading strategies in the investment industry. For instance, momentum strategies are crucial to commodity trading advisors (CTAs)and managed futures (MFs) in the hedge funds industry. They also represent the basic trading rules that are described in the famous Turtle trading experiment held by Richard Dennisand William Eckhardt in the nineteen-eighties1 . Momentum strategies are also highly popular among asset managers. By analyzing the quarterly portfolio holdings of 155 equitymutual funds between 1974 and 1984, Grinblatt et al. (1995) found that “77% of thesemutual funds were momentum investors”. Another important fact concerns the relationship between options and momentum. Indeed, it is well-known that the manufacturing ofstructured products is based on momentum strategies. Hedging demand from retail andinstitutional investors is therefore an important factor explaining the momentum style.In practice, momentum encompasses different types of management strategies. However,trend-following strategies are certainly the main component. There is strong evidence thattrend-following investing is one of the more profitable styles, generating positive excessreturns for a very long time. Thus, Lempérière et al. (2014b) and Hurst et al. (2014)backtest this strategy over more than a century, and establish the existence of trends acrossdifferent asset classes and different study periods. This is particularly true for equities andcommodities. For these two asset classes, the momentum risk factor has been extensivelydocumented by academics since the end of nineteen-eighties. Jegadeesh and Titman (1993)showed evidence of return predictability based on past returns in the equity market. Theyfound that buying stocks that have performed well over the past three to twelve monthsand selling stocks that have performed poorly produces abnormal positive returns. Sincethis publication, many academic works have confirmed the pertinence of this momentumstrategy (e.g. Carhart, 1997; Rouwenhorst, 1998; Grundy and Martin, 2001; Fama andFrench, 2012). In the case of commodities, there is an even larger number of studies2 .However, the nature of momentum strategies in commodity markets is different than inequity markets, because of backwardation and contango effects (Miffre and Rallis, 2007).More recently, academics have investigated momentum investing in other asset classes andalso found evidence in fixed-income and currency markets (Moskowitz et al., 2012; Asnesset al., 2013).The recent development of alternative risk premia impacts the place of momentum investing for institutional investors, such as pension funds and sovereign wealth funds (Ang,2014; Hamdan et al., 2016). Since they are typically long-term and contrarian investors,momentum strategies were relatively rare among these institutions. However, the significantgrowth of factor investing in equities has changed their view of momentum investing. Today,many institutional investors build their strategic asset allocation (SAA) using a multi-factorportfolio that is exposed to size, value, momentum, low beta and quality risk factors (Cazalet and Roncalli, 2014). This framework has been extended to multi-asset classes, includingrates, credit, currencies and commodities. In particular, carry, momentum and value arenow considered as three risk premia that must be included in a strategic allocation in orderto improve the diversification of traditional risk premia portfolios (Roncalli, 2017). However,the correlation diversification approach, which consists in optimizing the portfolio’s volatility (Markowitz, 1952), is inadequate for managing a universe of traditional and alternativerisk premia, because the relationships between these risk premia are non-linear. Moreover,carry, momentum and value exhibit different skewness patterns (Lempérière et al., 2014).1 /turtle-trading.aspexample, we can cite Elton et al. (1987), Likac et al. (1988), Taylor and Tari (1989), Erb andHarvey (2006), Szakmary et al. (2010) and Gorton et al (2013).2 For2Electronic copy available at: https://ssrn.com/abstract 3042173
Understanding the Momentum Risk PremiumThis is why carry and value are generally considered as skewness risk premia3 , whereasmomentum is a market anomaly4 . In this context, the payoff approach is more appropriatefor understanding the diversification of SAA portfolios. More precisely, mixing concave andconvex strategies is crucial for managing the skewness risk of diversified portfolios.Since momentum investing may now be part of a long-term asset allocation, institutionalinvestors need to better understand the behavior of such strategies. However, the investmentindustry is generally dominated by the syndrome of backtesting. Backtests focus on thepast performance of trend-following strategies. Analyzing the risk and understanding thebehavior of such strategies is more challenging. However, the existence of academic andtheoretical literature on this topic may help these institutional investors to investigate thesetopics. We notably think that some research studies are essential to understand the dynamicsof these strategies beyond the overall performance of momentum investing. These researchworks are Fung and Hsieh (2001), Potters and Bouchaud (2006), Bruder and Gaussel (2011)and Dao et al. (2016).Fung and Hsieh (2001) developed a general methodology to show that “trend followershave nonlinear, option-like trading strategies”. In particular, they showed that a trendfollowing strategy is similar to a lookback straddle option, and exhibits a convex payoff.They then deduced that it has a positive skewness. Moreover, they noticed a relationshipbetween a trend-following strategy and a long volatility strategy. By developing a theoreticalframework and connecting their results to empirical facts, this research marks a break withprevious academic studies, and has strongly influenced later research on the momentum riskpremium.Potters and Bouchaud (2006) published another important paper on this topic. In particular, they derived the analytical shape of the corresponding probability distribution function.The P&L of trend-following strategies has an asymmetric right-skewed distribution. Theyalso focused on the hit ratio (or the fraction of winning trades), and showed that the bestcase is obtained when the asset volatility is low. In this situation, the hit ratio is equal to50%. However, the hit ratio decreases rapidly when volatility increases. This is why theyconcluded that “trend followers lose more often than they gain”. Since the average P&Lper trade is equal to zero in their model, Potters and Bouchaud (2006) also showed that theaverage gain is larger than the average loss. Therefore, they confirmed the convex optionprofile of the momentum risk premium.The paper of Bruder and Gaussel (2011) is not focused on momentum, but is concernedmore generally with dynamic investment strategies, including stop-loss, contrarian, averaging and trend-following strategies. They adopted an option-like approach and developed ageneral framework, where the P&L of a dynamic strategy is decomposed into an option profile and a trading impact. The option profile can be seen as the intrinsic value of the option,whereas the trading impact is equivalent to its time value. By applying this framework toa continuous-time trend-following model, Bruder and Gaussel (2011) confirmed the resultsfound by Fung and Hsieh (2001) and Potters and Bouchaud (2006): the option profile isconvex, the skewness is positive, the hit ratio is lower than 50% and the average gain islarger than the average loss. They also highlight the important role of the Sharpe ratio andthe moving average duration in order to understand the P&L. In particular, a necessarycondition to obtain a positive return is that the absolute value of the Sharpe ratio is greaterthan the inverse of the moving average duration. Another important result is the behaviorof the trading impact, which has a negative vega. Moreover, the loss of the trend-followingstrategy is bounded, and is proportional to the square of the volatility.3Askewness risk premium is rewarded for taking a systematic risk in bad times (Ang, 2014).performance of a market anomaly is explained by behavioral theories, not by a systematic risk.4 The3Electronic copy available at: https://ssrn.com/abstract 3042173
Understanding the Momentum Risk PremiumThe paper of Dao et al. (2016) goes one step further by establishing the relationshipbetween trend-following strategies and the term structure of realized volatility. More specifically, the authors showed that “the performance of the trend is positive when the long-termvolatility is larger than the short-term volatility”. Therefore, trend followers have to riskmanage the short-term volatility in order to exhibit a positive skewness and a positiveconvexity. Another interesting result is that the authors are able to replicate the cumulative performance of the SGA CTA Index, which is the benchmark used by professionals foranalyzing CTA hedge funds. Another major contribution by Dao et al. (2016) concernsthe hedging properties of trend-following strategies. They demonstrated that the payoff ofthe trend-following strategy is similar to the payoff of an equally-weighted portfolio of ATMstrangles. They then compared the two approaches for hedging a long-only exposure. Theynoticed that the strangle portfolio paid a fixed price for the short-term volatility, whereasthe trend-following strategy is directly exposed to the short-term volatility. On the contrary,the premium paid on options markets is high. The authors finally concluded that “even ifoptions provide a better hedge, trend-following is a much cheaper way to hedge long-onlyexposures”.Our research is based on the original model of Bruder and Gaussel (2011). The idea is toconfirm the statistical results cited above using a unique framework in terms of convexity,probability distribution, hit ratio, skewness, etc. Since it is a continuous-time model, wecan extend the analysis to the multivariate case, and derive the corresponding statisticalproperties of the trend-following strategy applied to a multi-asset universe. Contrary tothe previous studies, we can analyze the impact of asset correlations on the performanceof trend-following strategies. It appears that the concept of diversification in a long/shortapproach is different and more complex than for a long-only portfolio. Therefore, threeparameters are important to understand the behavior of the momentum risk premium: thevector of Sharpe ratios, the covariance matrix of asset returns, and the frequency matrix ofthe moving average estimator. The sensitivity of the P&L to these three key parameters isof particular interest for investors and professionals.Today, a significant part of investments in CTAs and trend-following programs is motivated by a risk management approach, and not only by performance considerations. Inparticular, some investors are tempted to use CTAs as a hedging program without paying ahedging premium (Dao et al., 2016). Therefore, we extend the model by mixing long-onlyand trend-following exposures in order to measure the hedging quality of the momentumstrategy, and to see if it can be a tool for tail risk management and downside protection.This paper is organized as follows. In Section Two, we present the model of Bruder andGaussel (2011). We derive new results concerning the statistical properties of the tradingimpact. We also analyze the impact of leverage on the ruin probability. Then, we extend themodel to the multivariate case. This allows us to measure the impact of asset correlations,and the influence of the choice of the moving average. Using the multivariate model, we canalso draw a distinction between time-series and cross-section momentum. In Section Three,we study the empirical properties of trend-following strategies. We show how to decomposethe P&L of the strategy into low- and high-frequency components. We then study theoptimal estimation of the trend frequency, and the relationship between trends and riskpremia. We also replicate the cumulative performance of the SG CTA Index by using ourtheoretical model. Section Four deals with downside protection and the hedging propertiesof the trend-following strategy. We analyze the single asset case, and calculate the analyticalprobability distribution and the value-at-risk of the hedged portfolio. The multivariate caseis also considered, and particularly the cross-hedging strategy, when we hedge one asset byanother asset. Then, we illustrate the behavior of the trend-following strategy in presenceof skewness events. Finally, Section Five summarizes the different results of the paper.4
Understanding the Momentum Risk Premium22.12.1.1A model of a trend-following strategyThe Bruder-Gaussel frameworkEstimating the trend with an exponential weighted moving averageBruder and Gaussel (2011) assume that the asset price St follows a geometric Brownianmotion with constant volatility, but with a time-varying trend: dSt µt St dt σSt dWtdµt γ dWt?where µt is the unobservable trend. By introducing the notation dyt dSt /St , we obtain:dyt µt dt σ dWtWe denote µ̂t E [ µt Ft ] the estimator of the trend µt with respect to the filtration Ft .Bruder and Gaussel (2011) show that µ̂t is an exponential weighted moving average (EWMA)estimator:Z tµ̂t λe λ(t u) dyu e λt µ̂00where λ σ 1 γ is the EWMA parameter. λ is related to the average duration of the movingaverage filter and control the measurement noise filtering (Potters and Bouchaud, 2006).2.1.2P&L of the trend-following strategyBruder and Gaussel (2011) assume that the exposure of the trading strategy is proportionalto the estimated trend of the asset:et αµ̂tTherefore, the dynamics of the investor’s P&L Vt are given by:dVtVtdStSt αµ̂t dyt etBruder and Gaussel (2011) show that: αVT µ̂2 µ̂20 ασ 2lnV02λ TZ0T µ̂2tσ2 λασ 2 dt1 22Remark 1 An alternative specification of the exposure is:et λµ̂tσ2where is the standardized exposure. In this case, the exposure is normalized such thatdVt /Vt is of order one and has approximatively the same volatility. This specification is aspecial case of the general model where α σ 2 λ.5
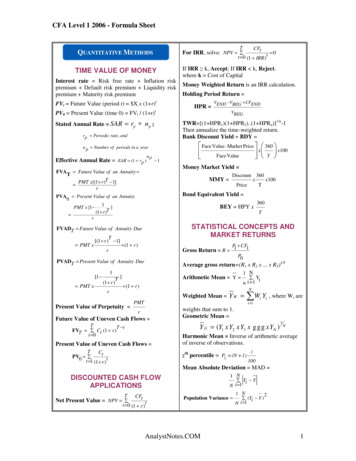
Understanding the Momentum Risk Premium2.1.3Relationship with option tradingThe return of the trend-following strategy is composed of two terms:Z TVT G0,T gt dtlnV00where the short-run component is:G0,T αµ̂2T µ̂202λand the long-run component is5 :gt ασ2 µ̂2tσ2 ασ 21 2 λ 2 Bruder and Gaussel (2011) interpret G0,T as the option profile and gt as the trading impact.This result relates to the robustness of the Black-Scholes formula. El Karoui et al. (1998)assume that the underlying price process is given by:dSt µt St dt σt St dWtwhereas the trader hedges the European option with the implied volatility Σ, meaning thatthe risk-neutral process is:dSt rSt dt ΣSt dWtQThey show that the value of the delta-hedging strategy is equal to:Z 1 T r(T t)VT G0,T eΓt Σ2 σt2 St2 dt2 0where G0,T is the payoff of the European option and Γt is the gamma sensitivity coefficient.It follows that a positive P&L is achieved by overestimating the realized volatility if thegamma is positive, and underestimating the realized volatility if the gamma is negative.In Figure 1, we have reported the option profile G0,T of the trend-following strategy withrespect to the final trend µ̂T when the parameters are the following: α 25 and µ̂0 30%.In Appendix A.4.4 on page 72, we show that λ is related to the average duration τ of theEWMA estimator:1λ τFor instance, if the average duration of the moving average is equal to three months, λ isequal to 4. Figure 1 illustrates that the option profile of the trend-following strategy isconvex. This confirms the result found by Fung and Hsieh (2001), who suggested that thepayoff of trend followers is similar to a long exposure on a straddle. However, the convexityof the payoff depends highly on the average duration of the moving average. In particular,short-term strategies exhibit less convexity than long-term strategies. To understand thisresult, we recall that τ is the ratio between the asset volatility and the trend volatility:στ γIt follows that a high value of τ implies that the volatility of the asset dominates the volatilityof the trend. This means that the observed trend is relatively less noisy. In this case, it isrational to use a longer period for estimating the trend.5 Wenotice that the Markowitz solution α σ 2 is equivalent to use the normalized exposure:! ! µ̂2t λλgt λ1 σ2226
Understanding the Momentum Risk PremiumFigure 1: Option profile of the trend-following 4-0.5-1-1.5Figure 2: Impact of the initial trend when τ is equal to one year70.5
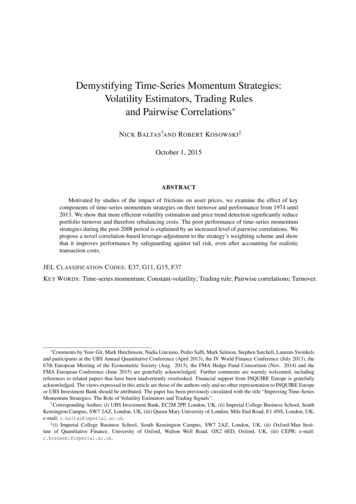
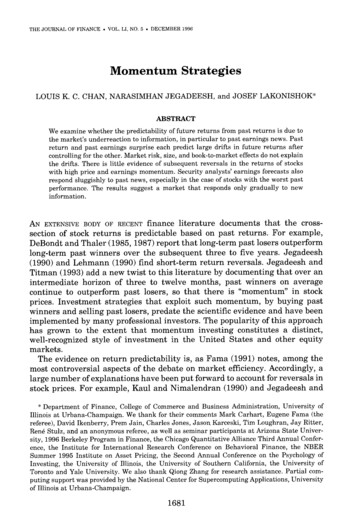
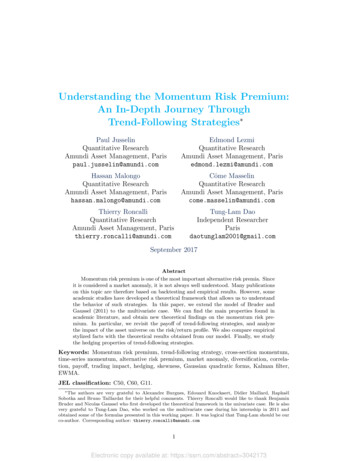
Understanding the Momentum Risk PremiumIt is remarkable that only the magnitude of the trend, and not the direction, is important. This symmetry property holds because the trend-following strategy makes sense in along/short framework. We also notice that the option profile of the trend-following strategyalso depends on the relative position between the initial trend µ̂0 and the final trend µ̂T .When the initial trend is equal to zero, the option profile is always positive. This is also thecase when the final trend is larger than the initial trend in absolute value. The worst casescenario appears when the final trend is equal to zero. In this case, the loss is bounded:G0,T α 2µ̂2λ 0Figure 2 summarizes these different results6 . We also notice that the maximum loss is adecreasing function of λ, or equivalently an increasing function of the average duration ofthe moving average. This implies that short-term momentum is less risky than long-termmomentum. This result is obvious since long-term momentum is more sensitive to reversaltrends, and short-term momentum is better to capture a break in the trend.2.1.4Statistical properties of the trend-following strategyIn Appendix A.4.3 on page 71, we show that gt is a linear transformation of a noncentral chisquare random variable, where the degree of freedom is 1 and the noncentrality parameteris ζ s2t /λ: s2t2g λασ 2; 1,Pr {gt g} Fλασ 2 (2 ασ 2 )λwhere st is the Sharpe ratio of the asset at time t. In Figures 3 and 4, we report the cumulative distribution function of the trading impact gt for different moving average windowswhen the parameters are σ 30% and α 1. In the first figure, we set the Sharpe ratioequal to zero. In this case, the probability of loss is larger than the probability of gain.However, the expected value of gain is larger than the expected value of loss. Here we facea trade-off between loss/gain frequency and loss/gain magnitude. As explained by Pottersand Bouchaud (2006), the trend-following strategy loses more frequently than it gains, butthe magnitude of gain is more important than the magnitude of loss. This theoretical resultis backed by practice. Most of the time, there are noisy trends or false signals. Duringthese periods, the trend-following strategy posts zero or negative returns. Sometimes, thefinancial market exhibits a big trend. In this case, the return of the trend-following strategymay be very large, but the probability of observing a big trend is low.In Appendix A.4.5 on page 73, we derive the hit ratio of the strategy:H Pr {gt 0}We have reported the relationship between H and the Sharpe ratio st in Figure 5 usingthe previous parameters (σ 30% and α 1) and a one-year moving average. It followsthat when the Sharpe ratio is lower than 0.35, the hit ratio of the trend-following strategyis lower than 50%. If we consider the expected loss and the expected gain7 , we obtain theresults given in Figure 6. We confirm that the average loss is limited. The expected gain isan increasing concave function of the absolute value of the Sharpe ratio, meaning that theeffect of the Sharpe ratio is amplified by the trend-following strategy.6 Weuse the same parameter values as for Figure 1.formulas are given in Appendix A.4.6 on page 73.7 Analytical8
Understanding the Momentum Risk PremiumFigure 3: Cumulative distribution function of gt (st 0)10.80.60.40.2-30-150153045607590Figure 4: Cumulative distribution function of gt ( st 2)10.80.60.40.2-3003060990120150
Understanding the Momentum Risk PremiumFigure 5: Hit ratio H of the trend-following strategy10080604020000.511.522.53Figure 6: Expected loss and gain of the trend-following strategy7550250-2500.511.51022.53
Understanding the Momentum Risk PremiumWe show here the statistical moments of gt computed by Hamdan et al. (2016): ασ 2 2 ασ 2 2 λασ 2st 1 ασ 222 rλασ 2 2 ασ 22λ 4s2t2λs 2λ2λ 6s2t3(λ 2s2t )µ (gt ) σ (gt ) γ1 (gt ) γ2 (gt ) λ12λ 48s2t2(λ 2s2t )These statistical moments8 are reported in Figure 7. Generally, we have ασ 2 1, implyingthat: λµ (gt ) ασ 2 s2t 2This explains that µ (gt ) depends on the frequency parameter λ as illustrated in the firstpanel in Figure 7. We also notice that the volatility and the kurtosis coefficients are adecreasing function of the moving-average duration (second and fourth panels). This meansthat a short-term trend-following strategy is more risky than a long-term trend-followingstrategy. In contrast, the skewness is positive and not negative (third panel). This is due tothe convex payoff of the strategy.Figure 7: Statistical moments of 22.5300.511.522.53261.5310.5008 We0.511.522.53again consider the previous parameters σ 30% and α 1.11
Understanding the Momentum Risk PremiumRemark 2 The Sharpe ratio of the trend-following strategy is represented in Figure 8. Whenthe Sharpe ratio of the asset is low (lower than 0.40), the Sharpe ratio of the strategy ishigher. However, it is lower than a buy-and-hold portfolio when the Sharpe ratio of the assetis high. Moreover, we note that long-term momentum strategies have a higher Sharpe ratiothan short-term momentum strategies.Figure 8: Sharpe ratio of gt1.210.80.60.40.2002.1.50.511.522.53The importance of the realized Sharpe ratioThe previous analysis highlights the role of the Sharpe ratio st . In this paragraph, we focuson the estimated Sharpe ratio, which can be viewed as the realized Sharpe ratio thanks toKalman filtering.We have seen that the P&L of the trend-following strategy can be decomposed in asimilar way to the robustness formula of the Black-Scholes model. In this case, we have thefollowing correspondence between the parameters:Γt St2ασ 2Delta-hedgingTrend-followingΣ2ŝ2tσt2λAt first sight, the parameters of the trend-following strategies seem to be non-homogenouswith respect to those of the delta-hedging strategy. However, there is a strong correspondence. For instance, Γt St2 measures the residual nominal exposure of the delta-hedgingstrategy while ασ 2 measures the normalized nominal exposure once the trend has beennormalized by the variance of asset return. Indeed, we have:et α0 µ̂0t12
Understanding the Momentum Risk Premiumwhere α0 ασ 2 and µ̂0t σ 2 µ̂t . We will see later what the rationale of such formulationmay be. The Sharpe ratio ŝt plays the role of the implied volatility. It is the main risk factorof the trend-following strategy, exactly like volatility is the main risk factor of the deltahedging strategy. Therefore, the trade-off between implied volatility and realized volatilitytakes an original form in the case of the trend-following strategy9 : 1222gt ' ασ ŝt var ŝt21 22 2 ασ var (ŝt ) ασ ŝt2{z} {z }Gamma gainGamma costThe trade-off is now between the squared Sharpe ratio and its half-variance. This resultmust be related to Equation (8) found by Dao et al. (2016), who show that the performanceof the trend-following strategy depends on the difference between the long-term volatility(gamma gain) and the short-term volatility (gamma cost).The robustness formula also tells us a very simple rule. If we want to obtain a positiveP&L, we must hedge the European option using an implied volatility that is higher than therealized volatility if the gamma of the option is positive. In the case of the trend-followingstrategy, this rule becomes: ασ 2λgt 0 ασ 2 ŝ2t 1 022 1/2 1 ŝt 1 ασ 2 /22τ1 ŝt 2τWe obtain the result of Bruder and Gaussel (2011). In Figure 9, we report the admissibleregion in order to obtain a positive trading impact. We notice that a low duration impliesa high Sharpe ratio. For instance, if we use a three-month EWMA estimator, the absolutevalue of the Sharpe ratio must be larger than 1.41 in order to observe a positive tradingimpact. In the case of a one-year moving average, the bound is 0.71 (see Table 1).Table 1: Upper and lower bounds of the admissible regionDurationBounds1W 5.101M 2.453M 1.416M 1.001Y 0.71The reason is that the estimator depends on the duration. In Figure 10, we have reportedthe probability density function of the Sharpe ratio estimator ŝt when the true value of st isequal to 0.5. We observe that the standard deviation is wide, even if we consider a ten-yearperiod. This is why the Sharpe ratio estimate must be significant in order to generate apositive P&L. Since gamma costs increase with the frequency of the moving average, it isperfectly normal that the estimate must be higher for low duration than for high duration.Remark 3 All these results confirm that short-term momentum strategies must exhibit morecross-section variance than long-term momentum strategies. Another implication is the importance of trading costs induced by gamma trading in particular for short-term momentumstrategies.9 Weassume that ασ 2 1.13
Understanding the Momentum Risk PremiumFigure 9: Admissible region for positive trading impactFigure 10: Probability density function of the Sharpe ratio estimator1.210.80.60.40.20-1-0.500.51411.52
Understanding the Momentum Risk Premium2.1.6The leverage effect and the ruin probabilityBruder and Gaussel (2011) propose using the optimal Markowitz allocation:α mσ2Since this rule is simple and seems to be natural, it is not obvious that it is the optimalleverage. In Figure 11, we have reported the relationship between the leverage α and thetrading impact gt when the Sharpe ratio is equal to 2. We notice that gt is concave functionof α (panel 1). In particular, the P&L decreases when α is higher than a certain value α? .The maximization of the trading impact implies that the optimal leverage α? is equal to10 : 22ŝt λ 2,,0α? max minσ2σ2We have reported the value of α? and also the corresponding exposure e? in the third andfourth panels. These results show that the exposure must be an increasing function of theSharpe ratio and also a decreasing function of the asset volatility. However, this conclusionmust be contrasted, because too high an exposure can destroy the strategy. In the previousparagraphs, we have always assumed that ασ 2 1. Otherwise, we obtain:gt ασ 2 ŝ2t {z }Gamma gain 11 2ασ var (ŝt ) α2 σ 4 ŝ2t22 {z}Gamma costIt follows that gamma costs can be prohibitive in this case.Figure 11: The leverage 0501001502000010 This010203040500result is valid if we assume that ŝ2t is relatively constant
try. For instance, momentum strategies are crucial to commodity trading advisors (CTAs) and managed futures (MFs) in the hedge funds industry. They also represent the basic trad-ing rules that are described in the famous Turtle trading experiment held by Richard Dennis and William Eckhardt in