Transcription
COST ESTIMATE FOR THE CONSTRUCTION OFRESIDENTIAL-COMMERCIAL BUILDINGSNeven Martinec, B.C.E.INSTITUT IGH, d.d., Sector IGH Institut, Department for Construction Supervision,Building Engineering Division, Zagreb, HRneven.martinec@igh.hrNevena Hrnjak Ajduković, Spec.Eng.Aedif.INSTITUT IGH, d.d., Sector IGH Institut, Department for Construction Supervision,Building Engineering Division, Zagreb, HRnevena.hrnjak@igh.hrStjepan Bezak, PhD.Civ.Eng.University of Zagreb, Faculty of Civil Engineering, Zagreb, HRsbezak@grad.hrThis paper analyzes a cost estimate for construction works within the scope of execution ofinvestment projects, i.e. residential-commercial buildings. The proposed estimate is based onprevious experience with the constructed residential-commercial buildings and it allows us toapproximately estimate construction costs of future residential-commercial buildings. Anestimate model consists of the cost analysis of completed construction projects, statisticaldata processing, and the definition of construction cost structure. The model can also be usedin various phases of execution of other investment projects.KEY WORDS: cost estimate, construction costs, bills of quantities, cost structure.INTRODUCTIONHigh-rise buildings have always been very significant for the development of eachcommunity. When it comes to the construction of buildings, i.e. various projects, theyaccumulate good ideas, technologies and resources.Based on one classification, buildings can be divided according to their purpose into publicbuildings (kindergartens, schools, gymnasiums, hospitals), infrastructure buildings (telephoneexchanges, telecommunications, water storage facilities, industrial facilities), commercialbuildings (for production, services, trade), and residential-commercial buildings (RCBs),Table 3). Accordingly, each such successfully completed project also generates a number ofmedium-sized and smaller projects, both on local and strategic national level, giving adevelopment cycle an optimum impact. Construction of buildings represents an investment ofown resources, but nowadays increasingly of foreign creditors’ resources.The Republic of Croatia experienced extensive construction activities with high investmentvalues in the last few years.The construction of motorways, which are of enormous strategic importance for the country,was accompanied by the construction of buildings, which is illustrated in Table 1. Buildingsin the total value of HRK 35,861,146 were constructed in the period from 2004 to 2008.233
Table 1: Value of executed works, in thousand kunaYEARTOTAL THERFACILITIES[HRK]DEC 200414,369,78731.404,512,11368.609,857,674DEC 200514,996,79735.705,353,85764.309,642,940DEC 200618,451,58439.307,251,47360.7011,200,111DEC 200719,663,27541.508,160,25958.5011,503,016DEC 0,741,76235,861,14654,880,616If we focus only on residential-commercial buildings (RCBs) quoted in areas, approvals wereissued for construction of 14.506.648 m2 in the same period, with an apparent annual growthtrend (Croatian Central Bureau of Statistics, 2009).Table 2: Area of r esidential-commercial b uildings ( RCBs) f or which c onstruction a pprovals wereissuedNON-RESIDENTIALBUILDINGS [m2]YEARTOTAL [m2]RCBs [m2]DEC 20044,202,9422,434,4881,768,454DEC 20054,773,2362,840,2361,933,000DEC 20065,155,4453,167,9921,987,453DEC 20075,524,9363,009,7032,515,233DEC 06,64810,306,080The mentioned construction helped accumulate quite a lot of knowledge and experiencethrough preparation, designing, execution, supervision etc. This will make an estimate ofsome future costs, in our case for residential-commercial buildings, easier and more accurate.Cost estimate is a demanding task, which is especially true at the early stage of investmentrealization, when the technical documentation is at the level of conceptual design or the like.It is very important to make use of experience from the projects completed up to that point.According to the available references, a few cost estimate models are used around the world,such as: parametric models, element models, bills of quantities, etc., but the most frequentlyused model relies on a bill of quantities (Marenjak, El-Haram, Horner, 2002). The bill-ofquantity model is based on detailed descriptions of construction works and has to bestructured so as to provide the contractors with a good and clear basis for bid preparation andexecution of works, and an investor with a possibility of simple planning, analyzing andmonitoring of construction costs.234
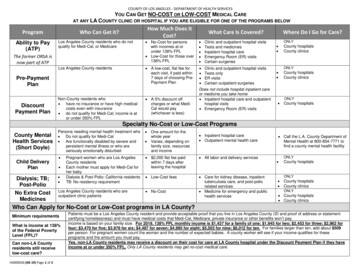
The bill-of-quantity model has its advantages in the early phase of investment projectrealization because it allows one to apply previous experience from similar projects in thestructure of construction works. It is important that the given structure always contains thesame elements, to allow a comparison. This enables a cost estimate for certain facilities,buildings, groups of works, or simply types of works (Building Cost Information Service,1999). The total construction costs can be quoted in various units, such as: pieces, km, m, m2,m3, etc. The very same approach was used in the cost estimate model below.Cost estimate modelThe theoretical model arises from an assumption that the construction costs of a certainbuilding can be presented by the structure of construction works, which is a result of afamiliar construction technology, and by certain groups of works making up the total costs offacility construction. Another significant element is description of works that have to bestandardized in a way to make them comparable and CTIONyesDECISIONTYPEOF BUILDINGSELECTIONnoENDGROUPSOF WORKSCONSTRUCTIONTECHNOLOGYSELECTEDGROUPSOF WORKSnoDESCRIPTIONOF igure 1: Flow chart of facility selection (Martinec, Bezak, Čaklović, 2004),( Martinec, Bezak, Linarić,2006)The flow chart in Figure 1 illustrates that the facility selection is connected with the selectionof a building as a type of facility, in our case a residential-commercial building, or a group ofworks. The criterion for selection of a certain group of works is how they fit into the235
respective construction technology and their share in the total construction costs. Should theanalyzed building prove not to possess the characteristic elements, according to the setcriteria, the procedure should be terminated and repeated for another building from theselected facility or repeated for another one. Once we have chosen a group of works andconstruction technology, we analyze the selected building further through the descriptions ofworks, and we establish the quantities of works. A criterion for selection of the quantity ofworks is the existing documentation or previous experience with the same or similar types ofbuildings (Martinec, Bezak, Linarić, 2006).Application of the modelThe theoretical model of selecting a facility for which we want to estimate costs starts withthe selection of building we want to build and ends with the comparative analysis. Accordingly,the research basis includes the construction costs, while the selection of building as a wholerelies on the theoretical model. The building we chose is a residential-commercial building as atype of facility.Table 3: Classification of facilitiesNo.BUILDINGS1.PUBLIC BUILDINGSKindergartensSchoolsSports hallsHospitals2.INFRASTRUCTURE FACILITIESTelephone exchangesTelecommunicationsWater storage facilitiesIndustrial buildings3.COMMERCIAL BUILDINGSProduction facilitiesService-providing facilitiesShops4.RESIDENTIAL-COMMERCIALBUILDINGS (RCBs)The theoretical model was tested by analyzing the quantities of works from five bills ofquantities for various residential-commercial buildings, approximately at the same locationsand with the same geomorphological conditions in the north-west Croatia. The gross areas ofselected residential-commercial buildings ranged from 6,741 to 15,000 m2 , number of storeysfrom 2 underground levels (UG2) to 5 loft, while their bearing structure was made ofreinforced concrete.236
Table 4: Overview of basic data of the analyzed residential-commercial buildingsBASIC DATALoad carryingstructureStoreysGross area eReinforced- Reinforced- testructurestructurestructurestructureUG2 GF 5 UG2 GF 4 UG GF 4 loftUG GF 5 loft UG GF 5 loftloftloft10,61510,1476,74111,49015,000The analysis has shown that most bills of quantities had the same or very similar structurewith average shares of specific groups of works in the total value (Đukan, 1986).Table 5: Overview of the bills of quantities structure with averages sharesNo.STRUCTURE OF THE BILL OFQUANTITIESAVERAGE SHARE [%]1.Construction works52.362.Craftworks21.973.Mechanical installations8.804.Electrical installations6.685.Water pipeline and 0Table 5 also illustrates that construction works and craftworks together account for 75% ofconstruction costs on average and are therefore most interesting to be considered further.Comparing and analyzing the bills of quantities for the respective residential-commercialbuildings, we discovered differences in the number, description, type and executiontechnology of residential-commercial buildings, their outfit and functionality, all this withrespect to a unit of measure. We have extracted and presented the structure of constructionworks and craftworks as the most interesting. We have focused our further analysis on theprocessing of the construction work group because of its uniformity and comparability, andthe share level. The structure of construction works was identical in all studied bills ofquantities and it comprised eight groups of works, as presented in Table 6, which we called atypical structure.The craftwork group is more extensive, diverse, and largely connected to the choice offinishing materials, which of course depends on the investor’s wishes and buyers’ needs.This, more complex group of works can be a subject of another analysis.237
Table 6: Typical structure of construction worksNo.CONSTRUCTION WORKS1.Earthworks2.Concrete works3.Reinforced-concrete works4.Steel bending works5.Carpenter’s works and scaffold6.Masonry works7.Miscellaneous construction works8.Insulation works9.External plasteringComparative analysisThe studied typical structure of construction works has been broken down into groups ofworks in Table 7. It is obvious that the largest portion, as much as 60 %, refers to reinforcedconcrete works, steel bending works and masonry work, which indicates that these threegroups of construction works account for 32% of the total construction price. These groups ofworks contain most items constituting the largest share within the construction works group,and consequently of construction costs, with respect to the total value.Different percentages of individual groups of works point out to differences in prices, whichis understandable if we take into account various contractors, different terrain configuration,and construction technology applied.Table 7: Comparative overview with shares of the group of works in the bills of quantities (Institut IGH)TYPE OF WORKRCB1 [%] RCB2 [%] RCB3 [%] RCB4 [%] RCB5 [%] AVERAGE [%]Earthworks1.986.161.683.982.003.16Concrete rks15.6916.1020.1918.0522.4518.50Steel bending works26.0217.8920.0619.5218.3720.37Carpenter’s work andscaffold14.7910.7314.2312.048.7612.11Masonry nstruction works5.1410.513.9216.8414.3510.15Insulation works5.666.176.494.773.285.27External 00100.00100.00100.00TOTAL238
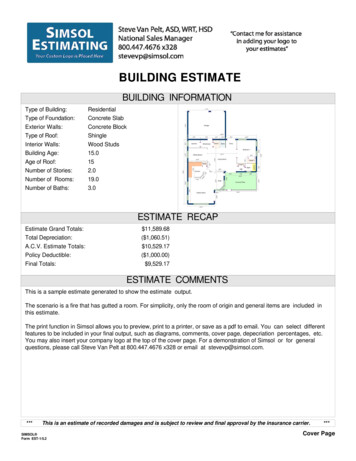
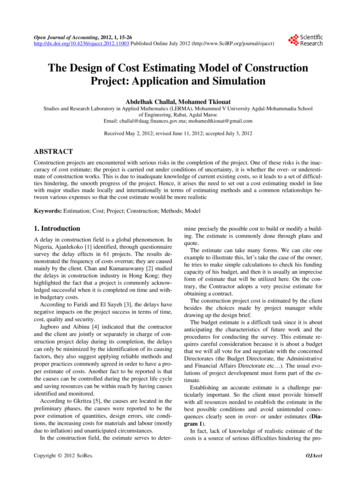
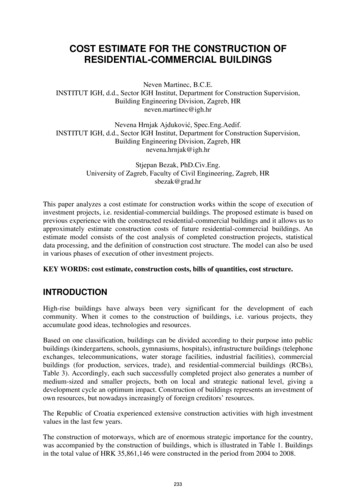
Values in Table 8 are classified according to the minimum, mean and maximum value. It isindicative that deviations from the average prices in all five bills of quantities toward theextreme values were almost completely identical, and they amounted to 6% maximum.Differences in percentages among the bills of quantities regarding the share of work groups inthe total value reached up to 8% for reinforced-concrete works and steel bending works, andthe maximum of 13% for various construction works having a very small, negligible share inthe total value. We can see that percentages of specific groups of works in the total value arevery similar, if we disregard the minimum and maximum percentage.Table 8: Overview of characteristic valuesTYPE OF WORKmin [%]average [%]max [%]Earthworks1.683.166.16Concrete works0.851.582.67Reinforced concrete works15.6918.5022.45Steel bending works17.8920.3726.02Carpenter’s work and scaffold8.7612.1114.79Masonry works19.6622.5524.92Miscellaneous constructionworks3.9210.1516.84Insulation works3.285.276.49External plastering4.296.307.67TOTAL100.00Figure 2 comparatively shows the average and the five studied residential-commercialbuildings according to a group of construction works. Findings of the analysis indicate to thebiggest deviations in the reinforced concrete works, steel bending works and masonry works.239
Figure 2: Overview of deviations of construction works from the averageAs already mentioned, the group of construction works accounts for 52% of the totalconstruction value, whereas reinforced-concrete works, steel bending works and masonrywork account for 60% of construction works on average and 32 % of total construction costsof residential-commercial buildings.If we want to get more accurate forecasts of future construction costs for residentialcommercial buildings using a cost estimate, we definitely have to focus on the constructionworks group and the three above groups of works in the order of their appearance. Deviationsamong the considered residential-commercial buildings amo
estimate model consists of the cost analysis of completed construction projects, statistical data processing, and the definition of construction cost structure. The model can also be used in various phases of execution of other investment projects. KEY WORDS: cost estimate, construction costs, bills of quantities, cost structure. INTRODUCTION