Transcription
Glencoe ScienceChapter ResourcesPlate TectonicsIncludes:Reproducible Student PagesASSESSMENTTRANSPARENCY ACTIVITIES Chapter Tests Section Focus Transparency Activities Chapter Review Teaching Transparency ActivityHANDS-ON ACTIVITIES Assessment Transparency Activity Lab Worksheets for each Student Edition ActivityTeacher Support and Planning Laboratory Activities Content Outline for Teaching Foldables–Reading and Study Skills activity sheet Spanish Resources Teacher Guide and AnswersMEETING INDIVIDUAL NEEDS Directed Reading for Content Mastery Directed Reading for Content Mastery in Spanish Reinforcement Enrichment Note-taking Worksheets
Glencoe SciencePhoto CreditsSection Focus Transparency 1: Ron Watts/CORBIS; Section Focus Transparency 2: Museum of Paleontology,University of CA, Berkeley; Section Focus Transparency 3: Jeremy Stafford-Deitsch/ENPCopyright by The McGraw-Hill Companies, Inc. All rights reserved.Permission is granted to reproduce the material contained herein on the conditionthat such material be reproduced only for classroom use; be provided to students,teachers, and families without charge; and be used solely in conjunction with thePlate Tectonics program. Any other reproduction, for use or sale, is prohibitedwithout prior written permission of the publisher.Send all inquiries to:Glencoe/McGraw-Hill8787 Orion PlaceColumbus, OH 43240-4027ISBN 0-07-866947-2Printed in the United States of America.4 5 6 7 8 9 10 009 09 08 07 06
Table of ContentsTo the TeacherReproducible Student Pages ivHands-On ActivitiesMiniLAB: Try at Home Interpreting Fossil Data . . . . . . . . . . . . . . . . . . . . . . . . . . . . . . . . . . . . . . . . . 3MiniLAB: Modeling Convection Currents. . . . . . . . . . . . . . . . . . . . . . . . . . . . . . . . . . . . . . . . . . . . . . . 4Lab: Seafloor Spreading Rates . . . . . . . . . . . . . . . . . . . . . . . . . . . . . . . . . . . . . . . . . . . . . . . . . . . . . . . . 5Lab: Use the Internet Predicting Tectonic Activity . . . . . . . . . . . . . . . . . . . . . . . . . . . . . . . . . . . . . . . . 7Laboratory Activity 1: Paleogeographic Mapping . . . . . . . . . . . . . . . . . . . . . . . . . . . . . . . . . . . . . . . . . 9Laboratory Activity 2: How do continental plates move? . . . . . . . . . . . . . . . . . . . . . . . . . . . . . . . . . . 13Foldables: Reading and Study Skills . . . . . . . . . . . . . . . . . . . . . . . . . . . . . . . . . . . . . . . . . . . . . . . . . 17 Meeting Individual NeedsExtension and InterventionDirected Reading for Content Mastery . . . . . . . . . . . . . . . . . . . . . . . . . . . . . . . . . . . . . . . . . . . . . . . 19Directed Reading for Content Mastery in Spanish . . . . . . . . . . . . . . . . . . . . . . . . . . . . . . . . . . . . . . 23Reinforcement . . . . . . . . . . . . . . . . . . . . . . . . . . . . . . . . . . . . . . . . . . . . . . . . . . . . . . . . . . . . . . . . . . 27Enrichment . . . . . . . . . . . . . . . . . . . . . . . . . . . . . . . . . . . . . . . . . . . . . . . . . . . . . . . . . . . . . . . . . . . . 30Note-taking Worksheet . . . . . . . . . . . . . . . . . . . . . . . . . . . . . . . . . . . . . . . . . . . . . . . . . . . . . . . . . . . 33 AssessmentChapter Review . . . . . . . . . . . . . . . . . . . . . . . . . . . . . . . . . . . . . . . . . . . . . . . . . . . . . . . . . . . . . . . . . 37Chapter Test . . . . . . . . . . . . . . . . . . . . . . . . . . . . . . . . . . . . . . . . . . . . . . . . . . . . . . . . . . . . . . . . . . . . 39 Transparency ActivitiesSection Focus Transparency Activities. . . . . . . . . . . . . . . . . . . . . . . . . . . . . . . . . . . . . . . . . . . . . . . . 44Teaching Transparency Activity . . . . . . . . . . . . . . . . . . . . . . . . . . . . . . . . . . . . . . . . . . . . . . . . . . . . . 47Assessment Transparency Activity . . . . . . . . . . . . . . . . . . . . . . . . . . . . . . . . . . . . . . . . . . . . . . . . . . . 49Teacher Support and PlanningContent Outline for Teaching . . . . . . . . . . . . . . . . . . . . . . . . . . . . . . . . . . . . . . . . . . . . . . . . . . . . . . T2Spanish Resources . . . . . . . . . . . . . . . . . . . . . . . . . . . . . . . . . . . . . . . . . . . . . . . . . . . . . . . . . . . . . . T5Teacher Guide and Answers . . . . . . . . . . . . . . . . . . . . . . . . . . . . . . . . . . . . . . . . . . . . . . . . . . . . . . . T9Additional Assessment Resources available with Glencoe Science: ExamView Pro TestmakerAssessment TransparenciesPerformance Assessment in the Science ClassroomStandardized Test Practice BookletMindJogger VideoquizzesVocabulary PuzzleMaker at msscience.comInteractive ChalkboardThe Glencoe Science Web site at: msscience.comAn interactive version of this textbook along with assessment resources are availableonline at: mhln.comiii
To the TeacherThis chapter-based booklet contains all of the resource materials to help you teachthis chapter more effectively. Within you will find:Reproducible pages for Student Assessment Hands-on Activities Meeting Individual Needs (Extension and Intervention) Transparency ActivitiesA teacher support and planning section including Content Outline of the chapter Spanish Resources Answers and teacher notes for the worksheetsHands-On ActivitiesLaboratory Activities: These activities do not require elaborate supplies or extensive pre-labpreparations. These student-oriented labs are designed to explore science through a stimulating yet simple and relaxed approach to each topic. Helpful comments, suggestions, andanswers to all questions are provided in the Teacher Guide and Answers section.Foldables: At the beginning of each chapter there is a Foldables: Reading & Study Skillsactivity written by renowned educator, Dinah Zike, that provides students with a tool thatthey can make themselves to organize some of the information in the chapter. Students maymake an organizational study fold, a cause and effect study fold, or a compare and contraststudy fold, to name a few. The accompanying Foldables worksheet found in this resourcebooklet provides an additional resource to help students demonstrate their grasp of theconcepts. The worksheet may contain titles, subtitles, text, or graphics students need tocomplete the study fold.Meeting Individual Needs (Extension and Intervention)Directed Reading for Content Mastery: These worksheets are designed to provide studentswith learning difficulties with an aid to learning and understanding the vocabulary andmajor concepts of each chapter. The Content Mastery worksheets contain a variety of formatsto engage students as they master the basics of the chapter. Answers are provided in theTeacher Guide and Answers section.ivCopyright Glencoe/McGraw-Hill, a division of the McGraw-Hill Companies, Inc.MiniLAB and Lab Worksheets: Each of these worksheets is an expanded version of each laband MiniLAB found in the Student Edition. The materials lists, procedures, and questionsare repeated so that students do not need their texts open during the lab. Write-on rules areincluded for any questions. Tables/charts/graphs are often included for students to recordtheir observations. Additional lab preparation information is provided in the Teacher Guideand Answers section.
Directed Reading for Content Mastery (in Spanish): A Spanish version of the DirectedReading for Content Mastery is provided for those Spanish-speaking students who arelearning English.Reinforcement: These worksheets provide an additional resource for reviewing the concepts of the chapter. There is one worksheet for each section, or lesson, of the chapter.The Reinforcement worksheets are designed to focus primarily on science content and lesson vocabulary, although knowledge of the section vocabulary supports understanding ofthe content. The worksheets are designed for the full range of students; however, they willbe more challenging for your lower-ability students. Answers are provided in the TeacherGuide and Answers section.Enrichment: These worksheets are directed toward above-average students and allow themto explore further the information and concepts introduced in the section. A variety offormats are used for these worksheets: readings to analyze; problems to solve; diagramsto examine and analyze; or a simple activity or lab which students can complete in theclassroom or at home. Answers are provided in the Teacher Guide and Answers section.Note-taking Worksheet: The Note-taking Worksheet mirrors the content contained in theteacher version—Content Outline for Teaching. They can be used to allow students to takenotes during class, as an additional review of the material in the chapter, or as study notesfor students who have been absent.Copyright Glencoe/McGraw-Hill, a division of the McGraw-Hill Companies, Inc.AssessmentChapter Review: These worksheets prepare students for the chapter test. TheChapter Review worksheets cover all major vocabulary, concepts, and objectivesof the chapter. The first part is a vocabulary review and the second part is a concept review.Answers and objective correlations are provided in the Teacher Guide and Answers section.Chapter Test: The Chapter Test requires students to use process skills and understand content.Although all questions involve memory to some degree, you will find that your students willneed to discover relationships among facts and concepts in some questions, and to use higherlevels of critical thinking to apply concepts in other questions. Each chapter test normallyconsists of four parts: Testing Concepts measures recall and recognition of vocabulary andfacts in the chapter; Understanding Concepts requires interpreting information and morecomprehension than recognition and recall—students will interpret basic information anddemonstrate their ability to determine relationships among facts, generalizations, definitions,and skills; Applying Concepts calls for the highest level of comprehension and inference;Writing Skills requires students to define or describe concepts in multiple sentence answers.Answers and objective correlations are provided in the Teacher Guide and Answers section.Transparency ActivitiesSection Focus Transparencies: These transparencies are designed to generate interestand focus students’ attention on the topics presented in the sections and/or to assessprior knowledge. There is a transparency for each section, or lesson, in the Student Edition.The reproducible student masters are located in the Transparency Activities section. Theteacher material, located in the Teacher Guide and Answers section, includes TransparencyTeaching Tips, a Content Background section, and Answers for each transparency.v
Teaching Transparencies: These transparencies relate to major concepts that will benefitfrom an extra visual learning aid. Most of these transparencies contain diagrams/photosfrom the Student Edition. There is one Teaching Transparency for each chapter. The TeachingTransparency Activity includes a black-and-white reproducible master of the transparencyaccompanied by a student worksheet that reviews the concept shown in the transparency.These masters are found in the Transparency Activities section. The teacher material includesTransparency Teaching Tips, a Reteaching Suggestion, Extensions, and Answers to StudentWorksheet. This teacher material is located in the Teacher Guide and Answers section.Assessment Transparencies: An Assessment Transparency extends the chapter content andgives students the opportunity to practice interpreting and analyzing data presented incharts, graphs, and tables. Test-taking tips that help prepare students for success on standardized tests and answers to questions on the transparencies are provided in the TeacherGuide and Answers section.Teacher Support and PlanningContent Outline for Teaching: These pages provide a synopsis of the chapter by section,including suggested discussion questions. Also included are the terms that fill in the blanksin the students’ Note-taking Worksheets.Copyright Glencoe/McGraw-Hill, a division of the McGraw-Hill Companies, Inc.Spanish Resources: A Spanish version of the following chapter features are included in thissection: objectives, vocabulary words and definitions, a chapter purpose, the chapter Activities, and content overviews for each section of the chapter.vi
ReproducibleStudent PagesReproducible Student Pages Hands-On ActivitiesMiniLAB: Try at Home Interpreting Fossil Data . . . . . . . . . . . . . . . . . 3MiniLAB: Modeling Convection Currents . . . . . . . . . . . . . . . . . . . . . . . 4Lab: Seafloor Spreading Rates . . . . . . . . . . . . . . . . . . . . . . . . . . . . . . . . 5Lab: Use the Internet Predicting Tectonic Activity . . . . . . . . . . . . . . . . 7Laboratory Activity 1: Paleogeographic Mapping . . . . . . . . . . . . . . . . . 9Laboratory Activity 2: How do continental plates move? . . . . . . . . . . 13Foldables: Reading and Study Skills. . . . . . . . . . . . . . . . . . . . . . . . . . 17 Meeting Individual NeedsExtension and InterventionDirected Reading for Content Mastery . . . . . . . . . . . . . . . . . . . . . . . 19Directed Reading for Content Mastery in Spanish . . . . . . . . . . . . . . 23Reinforcement . . . . . . . . . . . . . . . . . . . . . . . . . . . . . . . . . . . . . . . . . . 27Enrichment. . . . . . . . . . . . . . . . . . . . . . . . . . . . . . . . . . . . . . . . . . . . . 30Note-taking Worksheet . . . . . . . . . . . . . . . . . . . . . . . . . . . . . . . . . . . 33 AssessmentChapter Review . . . . . . . . . . . . . . . . . . . . . . . . . . . . . . . . . . . . . . . . . 37Chapter Test . . . . . . . . . . . . . . . . . . . . . . . . . . . . . . . . . . . . . . . . . . . . 39 Transparency ActivitiesSection Focus Transparency Activities . . . . . . . . . . . . . . . . . . . . . . . . 44Teaching Transparency Activity . . . . . . . . . . . . . . . . . . . . . . . . . . . . . 47Assessment Transparency Activity . . . . . . . . . . . . . . . . . . . . . . . . . . . 49Plate Tectonics1
Hands-On ActivitiesHands-OnActivities2 Plate Tectonics
DateClassHands-On ActivitiesNameInterpreting Fossil DataProcedure1. Build a three-layer landmass using clay or modeling dough.2. Mold the clay into mountain ranges.3. Place similar “fossils” into the clay at various locations aroundthe landmass.4. Form five continents from the one landmass. Also, form two smallerlandmasses out of different clay with different mountain ranges and fossils.5. Place the five continents and two smaller landmasses around the room.6. Have someone who did not make or place the landmasses make a modelthat shows how they once were positioned.7. Return the clay to its container so it can be used again.AnalysisCopyright Glencoe/McGraw-Hill, a division of the McGraw-Hill Companies, Inc.What clues were useful in reconstructing the original landmass?Plate Tectonics3
NameDateClassProcedure1. Pour water into a clear, colorless casserole dish until it is 5 cmfrom the top.2. Center the dish on a hot plate and heat it.WARNING: Wear thermal mitts to protect your hands.3. Add a few drops of food coloring to the water above the center of thehot plate.4. Looking from the side of the dish, observe what happens in the water.5. In the space below, illustrate your observations.Analysis1. Determine whether any currents form in the water.2. Infer what causes the currents to form.4 Plate TectonicsCopyright Glencoe/McGraw-Hill, a division of the McGraw-Hill Companies, Inc.Hands-On ActivitiesModeling Convection Currents
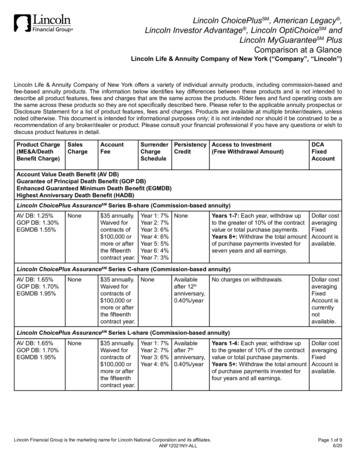
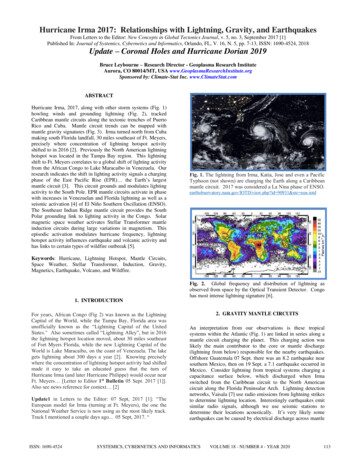
NameDateClassHands-On ActivitiesSeafloor Spreading RatesLab PreviewDirections: Answer these questions before you begin the Lab.1. Where can you find the data about each peak that you need for this lab?2. What formula do you use to calculate the rate of movement in this lab?How did scientists use their knowledge of seafloor spreading and magneticfield reversals to reconstruct Pangaea? Try this lab to see how you can determine where a continent may have been located in the past.Real-World QuestionProcedureCan you use clues, such as magneticfield reversals on Earth, to helpreconstruct Pangaea?1. Study the magnetic field graph below. Youwill be working only with normal polarityreadings, which are the peaks above thebaseline in the top half of the graph.2. Place the long edge of a ruler verticallyon the graph. Slide the ruler so that it linesup with the center of peak 1 west of theMid-Atlantic Ridge.3. Determine and record the distance and agethat line up with the center of peak 1 west.Repeat this process for peak 1 east of the ridge.4. Calculate the average distance and age forthis pair of peaks.5. Repeat steps 2 through 4 for each remaining pair of normal-polarity peaks.6. Calculate the rate of movement in cm peryear for the six pairs of peaks. Use theformula rate distance/time. Convertkilometers to centimeters. For example,to calculate a rate using normal-polaritypeak 5, west of the ridge:MaterialspencilGoals Interpret data about magnetic fieldreversals. Use these magnetic clues toreconstruct Pangaea.Normalpolarity61165 432645231Mid-Atlantic RidgeCopyright Glencoe/McGraw-Hill, a division of the McGraw-Hill Companies, Inc.metric ruler23 4 54 52163150 125 100 75 50 25 0 25 50 75 100 125 150Distance (km)West from ridgeEast from ridge12 1086421 2 3 4 5 6 7 8 9 101112rate 12.5 km125 km million years10 million yearsAge (millions of years) 1,250,000 cm1,000,000 years 1.25 cm/yearPlate Tectonics5
NameDateClass(continued)PeaksPeak 1Peak 2Peak 3Peak 4Peak 5Peak 6Distance west normal polarity (km)Distance east normal polarity (km)Average distance (km)Average age from scale(millions of years )Rate of movement (cm /year)Conclude and Apply1. Compare the age of igneous rock found near the mid-ocean ridge with that of igneous rockfound farther away from the ridge.2. If the distance from a point on the coast of Africa to the Mid-Atlantic Ridge is approximately2,400 km, calculate how long ago that point in Africa was at or near the Mid-Atlantic Ridge.3. How could you use this method to reconstruct Pangaea?6 Plate TectonicsCopyright Glencoe/McGraw-Hill, a division of the McGraw-Hill Companies, Inc.Hands-On ActivitiesData and Observations
NameDateClassUse the InternetHands-On ActivitiesPredicting Tectonic ActivityThe movement of plates on Earth causes forces that build up energy in rocks.The release of this energy can produce vibrations in Earth that you knowas earthquakes. Earthquakes occur every day. Many of them are too smallto be felt by humans, but each event tells scientists something more about theplanet. Active volcanoes can do the same, and volcanoes often form at plateboundaries.Think about where earthquakes and volcanoes have occurred in the past.Make a hypothesis about whether the locations of earthquake epicenters andactive volcanoes can be used to predict tectonically active areas.Real-World QuestionData SourcesCan you predict tectonically active areas byplotting locations of earthquake epicentersand volcanic eruptions?Visit msscience.com/internet lab for moreinformation about earthquake and volcanosites and data from other students.Goals Copyright Glencoe/McGraw-Hill, a division of the McGraw-Hill Companies, Inc. Research the locations of earthquakes andvolcanic eruptions around the world.Plot earthquake epicenters and the locationsof volcanic eruptions obtained frommsscience.com site.Predict locations that are tectonically activebased on a plot of the locations of earthquake epicenters and active volcanoes.Make a Plan1. Study the data table shown below. Use it torecord your data.2. Collect data for earthquake epicenters andvolcanic eruptions for at least the past twoweeks. Your data should include the longitude and latitude for each location. Forhelp, refer to the data sources given above.Locations of Epicenters and EruptionsEarthquake Epicenter / Volcanic EruptionLongitudeLatitudePlate Tectonics7
NameDateClass(continued)1. Make sure your teacher approves your planbefore you start.2. Plot the locations of earthquake epicentersand volcanic eruptions on a map of theworld. Use an overlay of tissue paperor plastic.3. After you have collected the necessary data,predict where the tectonically active areason Earth are.4. Compare and contrast the areas that youpredicted to be tectonically active with theplate boundary map shown in Figure 9 inyour textbook.Analyze Your Data1. What areas on Earth do you predict to be the locations of tectonic activity?2. How close did your prediction come to the actual location of tectonically active areas?Conclude and Apply1. How could you make your predictions closer to the locations of actual tectonic activity?2. Would data from a longer period of time help? Explain.3. What types of plate boundaries were close to your locations of earthquake epicenters? Volcaniceruptions?4. Explain which types of plate boundaries produce volcanic eruptions. Be specific.Communicating Your DataFind this lab using the link below. Post your data in the table provided. Compare your datawith those of other students. Combine your data with those of other students, and plotthese combined data on map to recognize the relationship between plate coundaries, volcanic eruptions, and earthquake epicenters.msscience.com/internet lab8 Plate TectonicsCopyright Glencoe/McGraw-Hill, a division of the McGraw-Hill Companies, Inc.Hands-On ActivitiesFollow Your Plan
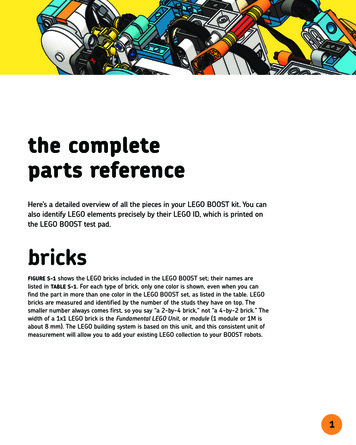
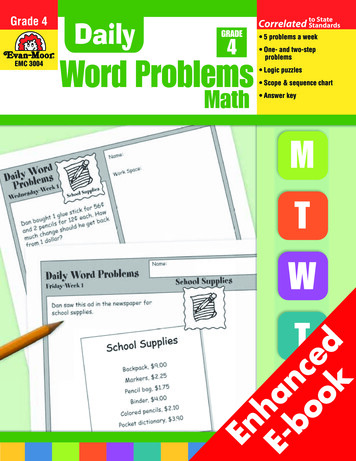
Date1LaboratoryActivityClassPaleogeographic MappingPaleo- means old as in paleontology, the study of old life (fossils). Geo- means Earth, as in geology,the study of Earth. Graphic refers to a drawing or painting. Therefore, paleogeographic could betranslated as “Old Earth Picture.” Scientists often use fossil evidence to help them develop a picture ofhow Earth was long ago. By examining and dating rock formations and fossils of various plants andanimals, scientists are able to formulate hypotheses about what Earth’s surface might have looked likeduring a particular period in history. For example, similar rock formations and certain types of plantand animal fossils of a particular age could indicate whether two, now separate, land areas might havebeen connected during that period. Further analysis of the samples and data could also provide cluesto the climate of that area or whether it was dry land or covered by an ocean. To classify events in thegeologic past, scientists have divided the millions of years of Earth’s history into segments, called eras.In this activity, you will examine evidence from the fossil record relative to a current map of animaginary continent and develop a map of what the continent and the surrounding area might havelooked like during the Mesozoic Era (248 million to 65 million years ago).StrategyYou will determine how fossil evidence can be used to infer information about a continent duringthe geologic past.You will interpret fossil evidence to draw a map showing how a continent appeared during theMesozoic Era.MaterialsCopyright Glencoe/McGraw-Hill, a division of the McGraw-Hill Companies, Inc.colored pencils or markersProcedure1. Figure 1 shows a map of a present-dayimaginary continent. Locations A throughI are places where fossils have been foundin rocks dating to the Mesozoic Era. Studythe map and look at the fossils key belowthe map.2. From the locations of the different fossils,infer where the land areas were at the timethe fossil organisms lived. Keep in mindthat the way the modern continent looksmay have no relationship to where theland/ocean boundaries were during theMesozoic Era.3. Use one color of pencil or marker to colorin the land areas on the map in Figure 1.Fill in the block labeled Land with thesame color. Use a different color of pencilor marker to color in the ocean areas onthe map in Figure 1. Fill in the blocklabeled Ocean with this color.4. In the space provided under Data andObservations, draw a map showing landand water areas during the Mesozoic Era.Use the color boundaries you added to Figure 1 as your guideline. Based on theseboundaries, add all of the symbols fromthe map key in Figure 1 to your map.5. Color all the areas around and between thelabeled areas on your map as either land orocean. Fill in the blocks labeled Land andOcean with the colors you used.Plate Tectonics9Hands-On ActivitiesName
NameDateClassLaboratory Activity 1 (continued)ACBEFXDYHGILandOceanFossils found in Mesozoic rocksA (shark teeth)F (teeth/bones of small mammals)B (petrified wood)G (dinosaur bones)C (sea stars)H (corals)D (leaf and fern imprints)I (dinosaur footprints)E (seashell fragments)X, Y (Areas to be identified after completing your map)10 Plate TectonicsCopyright Glencoe/McGraw-Hill, a division of the McGraw-Hill Companies, Inc.Hands-On ActivitiesFigure 1
NameDateClassHands-On ActivitiesLaboratory Activity 1 (continued)Data and ObservationsCopyright Glencoe/McGraw-Hill, a division of the McGraw-Hill Companies, Inc.Mesozoic Map Land OceanQuestions and Conclusions1. According to your map, was location Y land or water during the Mesozoic Era? Explain howyou decided.2. According to your map, was location X land or water during the Mesozoic Era? Explain howyou decided.3. Compare your map with those of other students. Why do you think that not everyone agreedon whether location X was land or water? How could you find out which interpretation wascorrect?Plate Tectonics11
NameDateClassLaboratory Activity 1 (continued)5. Suppose the modern continent shown in Figure 1 was located in an area that is extremely cold.Using the evidence you have, plus the information in Question 4, what could you infer aboutthe continent?Strategy CheckCan you determine how fossil evidence can be used to infer information about acontinent during the geologic past?Can you interpret fossil evidence to draw a map showing how a continent appearedduring the Mesozoic Era?Copyright Glencoe/McGraw-Hill, a division of the McGraw-Hill Companies, Inc.Hands-On Activities4. Corals grow only in warm, shallow oceans near the coastlines of continents that are relativelynear the equator. Would knowing this fact make you revise your map? Why or why not?12 Plate Tectonics
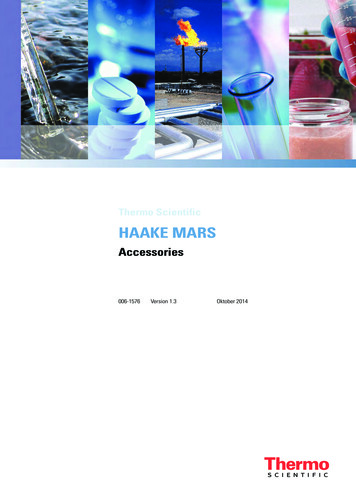
Date2LaboratoryActivityClassHow do continentalplates move?One of the models that helps explain how tectonic plates move is the convection model. In thishypothesis, the molten magma of the mantle boils like water in a pot. The pattern of the movingwater forms a circular wave or current as hot water rises to the top and cooler surface water isforced to the side of the pot and back down to be heated again. Inside the Earth it is believed thereare many convection cells, or regions in the mantle, that boil like this. The different cells have theirown currents and constantly move independently of one another. The crust of the Earth has amuch lighter mass and density than the magma. As a result, the plates of crust are moved byconvection currents and broken up on the boiling surface of the mantle.StrategyYou will model convection currents and the movement of tectonic plates.You will predict what will happen to tectonic plates at the margins of convection cells.Materialshot platescissorstongswatermedium to large–mouthed potsheets of plastic foam wrap for padding packages (not made from corn or organic materials)Copyright Glencoe/McGraw-Hill, a division of the McGraw-Hill Companies, Inc.Procedure1. The hot plates should be turned on high.Carefully fill the pot 2/3 full of water andplace it on the hot plate. It will take a whilefor the water to boil.2. Obtain a piece of flat plastic foam wrap.Use scissors to cut several shapes that represent tectonic plates. If you are working ina group you may mark your tectonic plateswith a pencil or pen if you wish so that youcan recognize it when the water boils.3. Carefully place your pieces of foam on thesurface of the water. If the water has anysteam or tiny bubbles at the bottom of thepan, ask your teacher to place the foam inthe pot for you.4. As the water heats, watch the action ofthe bubbles as they rise from the bottom ofthe pot. Observe everything you can aboutwhat happens to them when they rise undera piece of foam. Record your observation inthe table provided.5. Once the water begins to boil, watch yourpieces of foam. How do they move? Inwhat direction do they go? Do they stay inone place in the pot or do they move ? Dothey crash into other pieces of foam?Record the answers to these observations inthe data table. Be sure to observe the boilingpot for a while. It may first seem there is nopattern to the action in the pot, but carefulobservation will reveal certain movementsin the boiling water.Figure 1FoamPlate Tectonics13Hands-On ActivitiesName
NameDateClassLaboratory Activity 2 (continued)7. In your data table write down any observedchanges in your foam. Does it still havewater in it? Have any of the corners beenmelted or damaged? Write down any otherobservations in your table.Data and Observations1.Action ofbubbles2.Movement offoam pieces inboiling water3.Condition offoam afterexperimentQuestions and Conclusions1. How did you describe what happened to the bubbles as they gathered under the foam? Whathappened at the sides of the foam?14 Plate TectonicsCopyright Glencoe/McGraw-Hill, a division of the McGraw-Hill Companies, Inc.Hands-On Activities6. When the experiment is over, your teacherwill turn off the hot plates and remove thefoam with tongs for cooling. DO NOTremove the pieces yourself. They will coolquickly. When they are cooled, find yourpieces and return to your lab station or seat.
NameDateClass2. What type of natural feature is similar to the action of the bubbles? Explain your answer.3. Describe the movement of the plastic pieces when the water started to boil. Could you see a pattern?4. How does this experiment model the moving tectonic plates?Copyright G
comprehension than recognition and recall—students will interpret basic information and demonstrate their ability to determine relationships among facts, generalizations, definitions, and skills; Applying Concepts calls for the highe