Transcription
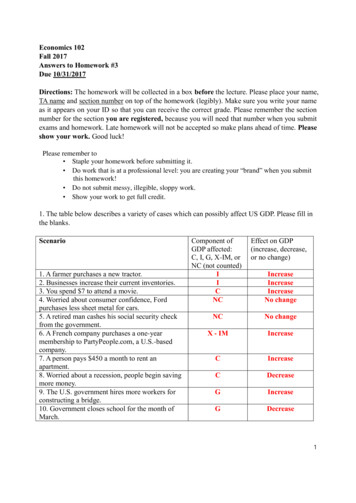
Economics 102Fall 2017Answers to Homework #3Due 10/31/2017Directions: The homework will be collected in a box before the lecture. Please place your name,TA name and section number on top of the homework (legibly). Make sure you write your nameas it appears on your ID so that you can receive the correct grade. Please remember the sectionnumber for the section you are registered, because you will need that number when you submitexams and homework. Late homework will not be accepted so make plans ahead of time. Pleaseshow your work. Good luck!Please remember to Staple your homework before submitting it. Do work that is at a professional level: you are creating your “brand” when you submitthis homework! Do not submit messy, illegible, sloppy work. Show your work to get full credit.1. The table below describes a variety of cases which can possibly affect US GDP. Please fill inthe blanks.Scenario1. A farmer purchases a new tractor.2. Businesses increase their current inventories.3. You spend 7 to attend a movie.4. Worried about consumer confidence, Fordpurchases less sheet metal for cars.5. A retired man cashes his social security checkfrom the government.6. A French company purchases a one-yearmembership to PartyPeople.com, a U.S.-basedcompany.7. A person pays 450 a month to rent anapartment.8. Worried about a recession, people begin savingmore money.9. The U.S. government hires more workers forconstructing a bridge.10. Government closes school for the month ofMarch.Component ofGDP affected:C, I, G, X-IM, orNC (not counted)IICNCEffect on GDP(increase, decrease,or no change)NCNo changeX - easeIncreaseIncreaseNo change1
2. Suppose nominal GDP in 2012 increased by 7% (over its level in 2011). Based on thisinformation, what happened to the rate of inflation (as measured by the GDP deflator) and realGDP between 2011 and 2012? Provide a full analysis given this information and holdingeverything else constant.SOLUTION:Without more information, we can say nothing about inflation as measured by the GDP deflatorand real GDP. Nominal GDP can increase because of changes in the price level and/or changesin real output. All that we know from the given information is that nominal GDP rose from 2011to 2012 by 7%: this may mean that this economy is actually producing more, producing thesame, or even producing less.3. National income accounting deals with the aggregate measure of the outcome of economicactivities. The most common measure of the aggregate production in an economy is GrossDomestic Product (GDP). In this problem consider a nation known as “Cocoland.” The tablebelow provides Cocoland’s national income accounting. Use this data to answer the followingquestions.Transfer PaymentsInterest IncomeDepreciationWagesGross Private InvestmentBusiness ProfitsIndirect Business TaxesRental IncomeNet ExportsNet Foreign Factor IncomeGovernment PurchasesHousehold Consumption 54 186 36 67 124 274 74 75 18 12 156 304a. Calculate the GDP using the expenditure approach (Method 2 in your class notes). Show yourwork and explain your work.SOLUTION:As you can see, the table contains more data than is necessary to measure GDP using theexpenditure approach. You will need to determine which parts of the table you need to use thisapproach. The necessary data is highlighted within the table.Transfer PaymentsInterest IncomeDepreciationWagesGross Private Investment (I) 54 186 36 67 1242
Business ProfitsIndirect Business TaxesRental IncomeNet Exports (X-M)Net Foreign Factor IncomeGovernment Purchases (G)Household Consumption (C)Remember: 274 74 75 18 12 156 304𝐆𝐃𝐏 𝐂 𝐆 𝐈 (𝐗 𝐌)C is the household consumption represented by 304.G is the government spending represented by 156.I is the gross private investment represented by 124.(X - M) is the net exports represented by 18.Therefore:GDP 304 156 124 18 602b. Calculate GDP using the factor payment approach (Method 3 from your class notes) or theincome approach. Show your work and explain your work.SOLUTION:The table also contains the data necessary to calculate GDP using the factor payment approach.Transfer PaymentsInterest Income (i)DepreciationWages (W)Gross Private InvestmentBusiness Profits (PR)Indirect Business TaxesRental Income (R)Net ExportsNet Foreign Factor IncomeGovernment PurchasesHousehold Consumption 54 186 36 67 124 274 74 75 18 12 156 304In this case we use the formula: GDP W i R PRW is the wages represented by 67.R is the rental income represented by 75.i is the interest income represented by 186.PR is the business profits represented by 274.Therefore:GDP 67 186 75 274 602As you can see, in this case, both approaches to calculating GDP will give the same value forGDP.3
4. Suppose you are provided with the following information about an economy comprised ofjust two firms, a shrimp farm that produces raw shrimp and a seafood restaurant:SHRIMP FARMRevenues (shrimp)Sales to HouseholdsSales to ForeignersSales to Seafood RestaurantExpensesWages 10,000 10,000 10,000Profits 20,000 10,000SEAFOOD RESTAURANTRevenues (fried shrimp)Sales to Household 50,000ExpensesWagesShrimpProfits 15,000 10,000 25,000a. Calculate GDP using the final goods approach. Show work.SOLUTION:Final Goods:shrimp to households ( 10,000) shrimp to foreigners ( 10,000) fried shrimp ( 50,000) 70,000b. Calculate GDP using the value-added approach. Show each step of your calculations.SOLUTION:Value Added: The value added at the shrimp farm is equal to 30,000, which is the sum of thesales to the households, the foreigners, and the seafood restaurants. The value added at theseafood restaurant is 40,000, which is the value of all sales ( 50,000) minus the cost of thegoods entering the seafood restaurant “stage” ( 10,000). Thus, total value added is:Value added in shrimp ( 30,000) Value added in fried shrimp ( 40,000) 70,000c. Calculate GDP using the factor payment approach. Show each step of your calculations.SOLUTION:Factor Payment: GDP wages interest rent profits. At the shrimp farm there are onlywages and profits of 30,000; at the seafood restaurant there are only wages and profits of 40,000. Thus: GDP 30,000 40,000 70,000.4
5. The table below gives some labor statistics (from the Bureau of Labor Statistics) for years1995, 2000 and 2005. Use these data to answer the following questions. Express your answers inpercentage terms to two places past the decimal.a. Define labor force. For each year find the labor force.SOLUTION:The labor force covers everyone who is employed and unemployed. Note however, thatthe unemployed refers only to people without jobs, actively looking for jobs, and available tostart a new job.Accordingly, the labor force in 1995 is 14,000,000 1,000,000 15,000,000. Similarlyit is 16,000,000 in 2000, and 17,500,000 in 2005.b. Define the term "discouraged workers". For each year find the number of discouragedworkers.SOLUTION:Discouraged workers are the people who tried to find a job, but have given up after anunsuccessful search. Since they are no longer looking for jobs they are not consideredas unemployed. Therefore, they are not part of the labor force.Discouraged labor is able to work, and they want to work. But they are discouraged intheir job search, so that they are no longer looking for jobs. So, the part of the adultpopulation who is able to work and who wants to work, but who are not in the laborforce are discouraged workers.For example, in 1995, 15,700,000 adults were able and wanted to work, but some werenot part of the labor force (15,000,000), therefore they were discouraged workers. So,5
there were 700,000 discouraged workers in 1995. Similarly, in 2000 out of 16,500,000adults able to work, and wanting to work, only 16,000,000 are in the labor force. So,there are 500,000 discouraged workers. The number of discouraged workers remainedthe same, at 500,000 in 2005.c. Define the labor-force participation rate. Calculate it for each year.SOLUTION:The labor-force participation rate is the percentage of the adult population thatparticipates in the labor force, either employed or unemployed.This rate in 1995 is therefore, (15,000,000/18,000,000)(100%) 83.3%. Similarly, it is(16/19)(100%) 84.2% in 2000, and (17.5/20.5)(100%) 85.4% in 2005.d. Calculate the unemployment rate for each year.SOLUTION:The unemployment rate gives the percentage of the labor force that is unemployed. Theunemployment rate is [(number of unemployed)/(number in the labor force)](100%).Accordingly, it is (1,000,000/15,000,000)(100%) 6.67% in 1995. The unemployment rate is(1,500,000/16,000,000)(100%) 9.38% in 2000, and it is (2,500,000/17,500,000)(100%) 14.29% in 2005.6. Which of the following people is considered unemployed by the Bureau of Labor Statistics?Explain your answer in each case.a. A housewife or househusband.b. An inmate in the state prison.c. A college student who is not looking for work.d. A college student who has just graduated and is looking for a job.e. A person who was fired 3 months ago and has been looking for a job ever since.f. A person who was fired 3 months ago and unsuccessfully looked for a job for 1 month,but has not looked for a job recently.SOLUTION:a. A housewife or househusband is probably not actively engaged in searching for ajob, so they would not be counted as part of the labor force and would not be counted asunemployed.b. Because an inmate is not actively looking for a job, he or she is not counted asunemployed. (Note that inmates might do some work in prison, but this is not consideredpart of the "market," and prisoners are not counted as part of the labor force.)6
c. This college student is not unemployed because he or she is not looking for a job.d. A recent graduate who is looking for a job but has not found one will be counted asunemployed.e. A person who was fired and is looking for a job would be counted as unemployed.f. If jobless people stop actively seeking work they will not be counted as unemployed-even if they once held a job and would like to have one again.7. Suppose that Wisconsin economy produces just one kind of output, a bubbler. Thetable below gives the economy's output of bubblers and the corresponding prices for 2014, 2015,and 2016. Use these data to answer the questions below. For parts b. through d., show the detailsof your calculations and express your answers in percentage terms to two places past the decimal.Year201420152016Units of Bubblers Produced500520560Price of a Bubbler 20 21 24a. Calculate nominal GDP for each year. Because the structure of this economy is so simple, it iseasy to calculate the GDP deflator. Calculate the GDP deflator (a type of price index) on a 100point scale for each year using 2015 as the base year. Then, calculate real GDP for each year.SOLUTION:Nominal GDP (Units of Produced in a Year) (Price in a Year)GDP deflator {[Product of (Price in current year)(Quantity in current year) for all final goodsand services]/[Product of (Price in base year)Quantity in current year) for all final goods andservices]}(scale factor)GDP deflator in this example can therefore be simplified to:GDP deflator Price in a Year 100Price in the Base Year(Note: The GDP deflator for the base year is given to be 100.0)Real GDP (Nominal GDP for a Year) Deflator in the Base YearDeflator in a Year7
Year201420152016Nominal GDP 10,000 10,920 13,440GDP Deflator95.2100.0114.3Real GDP 10,504 10,920 11,759b. What is the growth rate in nominal GDP between 2015 and 2016?SOLUTION:To calculate the growth rate in nominal GDP use the standard percentage change formula:[(New value – initial value)/(Initial value)](100%). Thus,13,440 10,920 0.230810,920Therefore, 23.08 %c. What is the inflation rate between 2014 and 2015 based upon the GDP deflator?SOLUTION:To find the inflation rate use the standard percentage change formula:Inflation rate [(GDP deflator in year 2015 – GDP deflator in 2014)/(GDP deflator in2014)](100%). Thus,100.0 95.2 0.050495.2Therefore, 5.04 %8. Suppose that Mr. Badger spends his money just for buying pizzas, cellphones, turkeys, andcheese. The table below shows Mr. Badger’s spending on each commodity for 2010 and 2011.Use this data to answer the following question. What is the inflation rate between 2010 and 2011?Express your answers in percentage terms to two places past the decimal. Assume that 2010 isthe base year and that you are using a CPI to compute the rate of inflation. Also, assume that forpurposes of this CPI the market basket is defined as the amounts of the goods consumed in thebase year.GoodPizzasCellphonesTurkeysCheeseYear 2010QuantityConsumed20111Price 10 600 100 50Year 2011QuantityConsumed30240.5Price 11 640 120 408
SOLUTION:It is easy to compute the nominal spending in each year: multiply prices and quantities and addthem up.Nominal spending of Year 2010 (this is just the cost of the market basket where we are definingthe market basket as the quantities consumed in 2010, our base year):Expenditure on pizza 200Expenditure on cellphones 600Expenditure on turkeys 100Expenditure on cheeses 50Total nominal expenditure in 2010 950Nominal spending of Year 2011 (this is not the cost of the market basket since we have differentquantities and not the quantities of the defined market basket):Expenditure on pizza 330Expenditure on cellphones 1,280Expenditure on turkeys 480Expenditure on cheeses 20Total nominal expenditure in 2011 2,110To compute a CPI, we must first choose a base year. Let's assume Year 2010 is the base year.1. Find the price of the consumption basket in the base year.2. Multiply the prices and BASE YEAR quantities in the next year and add them up:GoodPizzasCellphonesTurkeysCheesesCost of market basket in2011Quantity (Base Price (Year 2011)Year)20 111 6401 1201 40Expenditure 220 640 120 40 1,020The CPI for any year is given by the formula:Cost of consumption basket in current year(Scale Factor)Cost of consumption basket in the base yearApplying this formula to the second year (Year 2011), we get9
CPI 1,020 1.0737 950Note that the inflation rate is the percent change in the CPI. Here, it would be 7.37 %.9. Suppose people consume 3 different goods. The following table shows theprices and quantities of each good consumed in 2006, 2007, and 2008. Express your answers inpercentage terms to one place past the decimal.Year200620072008Price ofFish 7/fish 8/fish 9/fishQuantity ofFish400 fish550 fish900 fishPrice ofPork 8/pound 7/pound 6/poundQuantity ofPork225 pounds250 pounds275 poundsPrice of Beef 10/pound 12/pound 15/poundQuantity ofBeef175 pounds275 pounds275 poundsa. Calculate nominal GDP in each of the three years.SOLUTION:Nominal GDP is simply equal to the sum of the current year price current year quantity of allthe goods.2006: (7 400) (8 225) (10 175) 2,800 1,800 1,750 6,350.2007: (8 550) (7 250) (12 275) 4,400 1,750 3,300 9,450.2008: (9 900) (6 275) (15 275) 8,100 1,650 4,125 13,875.b. Calculate Real GDP in each of the three years, using 2006 as the base year.SOLUTION:Real GDP is equal to the sum of the base year price current year quantity of all the goods.2006: (7 400) (8 225) (10 175) 2,800 1,800 1,750 6,350.2007: (7 550) (8 250) (10 275) 3,850 2,000 2,750 8,600.2008: (7 900) (8 275) (10 275) 6,300 2,200 2,750 11,250.c. Calculate the GDP deflator for each of the three years.SOLUTION:The GDP deflator is equal to (Nominal GDP / Real GDP) 100.2006: 100. Because 2006 is the base year we know the deflator has to equal 100 even withoutdoing any calculations.2007: (9,450 / 8,600) 100 109.9.2008: (13,875 / 11,250) 100 123.3.10
d. Calculate the rate of inflation for 2007 and 2008 using the GDP deflator as your price index.Assume that 2006 is still the base year.SOLUTION:Inflation is equal to the growth rate of the GDP deflator. The growth rate formula is:𝐆𝐃𝐏 𝐝𝐞𝐟𝐥𝐚𝐭𝐨𝐫 𝐨𝐟 𝐘𝐞𝐚𝐫𝟐 𝐆𝐃𝐏 𝐝𝐞𝐟𝐥𝐚𝐭𝐨𝐫 𝐨𝐟 𝐘𝐞𝐚𝐫𝟏 𝟏𝟎𝟎𝐆𝐃𝐏 𝐝𝐞𝐟𝐥𝐚𝐭𝐨𝐫 𝐨𝐟 𝐘𝐞𝐚𝐫𝟏2007: ((109.9 – 100)/100) 100 9.9%.2008: ((123.3 – 109.9)/109.9) 100 12.2%.e. Using the quantities from 2006 for your market basket, and 2006 as your base year, calculatethe CPI for 2006, 2007 and 2008.SOLUTION:To calculate CPI, First: Fix the market basket. This means that the quantities you choose shouldnot change for this part. For part a. the fixed basket is: 400 fish, 225 pounds of pork and 175pounds of beef. Step two is to find prices. The prices are given in the problem, and the priceswill change. Step three is to compute the cost of the market basket:2006: ( 7 400) ( 8 225) ( 10 175) 2800 1800 1750 6,350.2007: ( 8 400) ( 7 225) ( 12 175) 3200 1575 2100 6,875.2008: ( 9 400) ( 6 225) ( 15 175) 3600 1350 2625 7,575.(Note: When calculating market basket cost for CPI only the prices change; the quantities areheld constant as specified by the market basket.)Once we have the cost of the market basket, step four is to calculate the CPI.The formula for CPI is: (Current year cost / Base year cost) 1002006 CPI: (6350/6350) 100 100.2007 CPI: (6875/6350) 100 108.3.2008 CPI: (7575/6350) 100 119.3.f. Using the CPI calculate the rate of inflation.SOLUTION:The way that CPI is determined makes the inflation rate simply the growth rate of CPI. Thegrowth rate formula is:𝐂𝐏𝐈 𝐨𝐟 𝐘𝐞𝐚𝐫𝟐 𝐂𝐏𝐈 𝐨𝐟 𝐘𝐞𝐚𝐫𝟏 𝟏𝟎𝟎𝐂𝐏𝐈 𝐨𝐟 𝐘𝐞𝐚𝐫𝟏2007 Inflation: ((108.3-100)/100) 100 8.3%.2008 Inflation: ((119.3-108.3)/108.3) 100 10.1%.11
g. Recalculate CPI and inflation using the 2006 quantities for your market basket but with 2008as your base year.SOLUTION:When you change the base year, there is no need to recalculate the market basket cost, becausethe basket has not changed. You simply need to recalculate CPI.2006 CPI: (6350/7575) 100 83.8.2007 CPI: (6875/7575) 100 90.8.2008 CPI: (7575/7575) 100 100.Then recalculate inflation:2007 Inflation: ((90.8-83.8)/83.8) 100 8.3%.2008 Inflation: ((100-90.8)/90.8) 100 10.1%.(Note: These inflation numbers are exactly the same as the ones in part f.)h. Now calculate CPI and inflation using 2008 quantities as your market basket and 2006 asyour base year.SOLUTION:In this part, the market basket has changed, so we need to recalculate the cost. Remember whencalculating the market basket cost, the quantities remain fixed.2006: ( 7 900) ( 8 275) ( 10 275) 6300 2200 2750 11,250.2007: ( 8 900) ( 7 275) ( 12 275) 7200 1925 3300 12,425.2008: ( 9 900) ( 6 275) ( 15 275) 8100 1650 4125 13,875.The CPI calculation does not change:2006 CPI: (11250/11250) 100 100.2007 CPI: (12425/11250) 100 110.4.2008 CPI: (13875/11250) 100 123.3.Recalculate inflation:2007 Inflation: ((110.4-100)/100) 100 10.4%.2008 Inflation: ((123.3-110.4)/110.4) 100 11.7%.(Note: These numbers are very different than parts f. and g., the difference is significantand not due to rounding error.)i. Does which year you choose as a base year matter when using the CPI to compute the rate ofinflation? Does your choice of quantities for the market basket used to compute the CPI impactthe rate of inflation?SOLUTION:As you can see from the inflation numbers in parts f. and g., the choice of a base year does notaffect inflation at all. As a matter of fact the choice of a base year is completely arbitrary.12
However, changing the composition of the market basket is important. Notice that not all of theprices in this problem increased by the same amount over time. The price of fish increased by28.6% ((9-7)/7) 100, while the price of pork decreased by 25% ((68)/8) 100 and the price of beef increased by 50% ((15-10)/10) 100. Inflation would bedifferent if the market basket contained only beef, then if the market basket contained only fish.Therefore, the choice of a market basket is very important in calculating the rate of inflation.j. Compare your answers from part d. with your answers from part f. If they are the same, whyare they the same? If they are different, why are they different?SOLUTION:The rate of inflation is different depending on the method that you use to calculate it. Notehowever that the numbers are similar. With the GDP deflator we are keeping prices fixed andchanging quantities, with CPI we are keeping quantities fixed and changing prices.10. The World Bank and the International Monetary Fund provide a lot of data that is readilyavailable for us to use. Go to the following website to get the data this question calls TL?locations US&name desc falseAt this link you can see time-series data for the U.S. CPI from 1960 to 2016 where the base yearis 2010. This means that in 2010 the CPI for the U.S. is equal to 100. This data set also providesCPI data for many countries (see the list below the graph at this website) and for each countrythe CPI base year is 2010. This means that the CPI in 2010 for every single country is going tobe 100.a. The G20 (or G-20 or Group of Twenty) is an international forum for the governments as wellas the central bank governors from 20 major economies. Currently, these major economies inalphabetic order are: Argentina, Australia, Brazil, Canada, China, France, Germany, India,Indonesia, Italy, Japan, Mexico, Russia, Saudi Arabia, South Africa, South Korea, Turkey,United Kingdom, United States, and the European Union. Founded in 1999, the G20 aims todiscuss policy issues pertaining to the promotion of international financial stability. Except forArgentina and European Union, construct a summary table of the CPI in 2005 and the CPI 2015for each country in the G20. Express your answers in percentage terms to one place past thedecimal. This implies that you will need to go to this website and collect the available CPI datafor each country listed in the table below and for the two dates in the table.AustraliaBrazilCanadaChinaFranceCPI (2005) with base year201086.479.691.975.492.7CPI (2015) with base year2010112.2138.4108.7100.0105.613
GermanyIndiaIndonesiaItalyJapanMexicoRussiaSaudi ArabiaSouth AfricaSouth KoreaTurkeyUnited KingdomUnited 30.1109.8146.1111.8108.7b. Let’s suppose that 2005 is the base year instead of 2010: this means that you will need tocompute new CPI values for all these economies. Provide a general description of how you willcalculate these new CPI values for these countries and then entered them in the table below.SOLUTION:To alter the base year to 2005 we need to take [(each country’s CPI value for 2005 with baseyear 2010)/(each country’s CPI value for 2005 with base year 2010)](scale factor) for thenumbers in the 2005 column.To alter the base year to 2005 for the CPI values for 2015 we need to take [(each country’s CPIvalue for 2015 with base year 2010)/(each country’s CPI value for 2005 with base year2010)](scale iaIndonesiaItalyJapanMexicoRussiaSaudi ArabiaSouth AfricaSouth KoreaTurkeyUnited KingdomCPI (2005) with base year2005(86.4/86.4)*100 100(79.6/79.6)*100 100(91.9/91.9)*100 100(75.4/75.4)*100 100(92.7/92.7)*100 100(92.5/92.5)*100 100(65.8/65.8)*100 100(68.7/68.7)*100 100(91.0/91.0)*100 100(100.4/100.4)*100 100(80.5/80.5)*100 100(61.4/61.4)*100 100(77.2/77.2)*100 100(71.6/71.6)*100 100(86.2/86.2)*100 100(65.9/65.9)*100 100(87.3/87.3)*100 100CPI (2015) with base year2005(112.2/86.4)*100 129.9(138.4/79.6)*100 173.9(108.7/91.9)*100 118.3(100.0/75.4)*100 132.6(105.6/92.7)*100 113.9(106.9/92.5)*100 115.6(147.7/65.8)*100 224.5(132.3/68.7)*100 192.6(107.5/91.0)*100 118.1(103.6/100.4)*100 103.2(119.4/80.5)*100 148.3(151.5/61.4)*100 246.7(118.2/77.2)*100 153.1(130.1/71.6)*100 181.7(109.8/86.2)*100 127.4(146.1/65.9)*100 221.7(111.8/87.3)*100 128.114
United States(89.6/89.6)*100 100(108.7/89.6)*100 121.3c. Based on your answers in part (b), which country experienced the greatest fall in thepurchasing power of the dollar between 2005 and 2015?SOLUTION: Russia had the greatest decrease in the purchasing power of the dollar over thistime period since its CPI rose the most between 2005 and 2015.d. Let’s suppose that 2005 is the base year. Based on your answer in part (b), which country didexperience the smallest fall in the purchasing power of the dollar between 2005 and 2015?SOLUTION: Japan had the smallest decrease in the purchasing power of the dollar over thistime period since its CPI rose the least between 2005 and 2015.e. Suppose you can have a chance to work as an economist for a multinational giant firm. Thisfirm has economic research centers in all of the countries we have considered in this question.You have nominal monthly payroll information for 2015 which are described in the table belowand you know that the purchasing power of the dollar is same among countries in 2005 (that isthe CPI in all of the countries in 2005 is equal to ndonesiaItalyJapanMexicoRussiaSaudi ArabiaSouth AfricaSouth KoreaTurkeyUnited KingdomUnited StatesNominal Monthly Payment in 2015 Dollars 9,700 8,700 8,850 5,300 5,700 7,000 9,000 12,500 6,500 6,200 7,450 12,000 10,000 8,200 9,000 11,000 9,000 9,500Suppose your only criteria for where you work is having the largest real monthly salary. Giventhe above information and your information on the CPI calculate which country has the highestreal monthly salary. Explain how you did this calculation.15
SOLUTION:The bottom line is that we have to get each country’s purchasing power in actual dollars in 2005because it was assumed that the purchasing power of the dollar is same among countries in 2005.To find the real monthly payment we need to use the following formula:Real monthly payment [(Nominal monthly payment in each country in 2015)/(CPI in 2015 ineach country with base year yIndiaIndonesiaItalyJapanMexicoRussiaSaudi ArabiaSouth AfricaSouth KoreaTurkeyUnited KingdomUnited StatesNominal Monthly Payment in2015 Dollars 9,700 8,700 8,850 5,300 5,700 7,000 9,000 12,500 6,500 6,200 7,450 12,000 10,000 8,200 9,000 11,000 9,000 9,500Real Monthly Payment in 2005 Dollars9700/129.9 *100 74,7008700/173.9*100 50,0008850/118.3*100 74,8005300/132.6*100 40,0005700/113.9*100 50,0007000/115.6*100 60,6009000 /224.5*100 40,10012500 /192.6*100 64,9006500 /118.1*100 55,0006200/103.2*100 60,1007450 /148.3*100 50,20012000 /246.7*100 48,60010000 /153.1*100 65,3008200 /181.7*100 45,1009000 /127.4*100 70,60011000 /221.7*100 49,6009000 /128.1*100 70,3009500 /121.3*100 78,300Now that we have the data and have done the calculation we find that the highest real monthlypayment is in the United States16
and real GDP. Nominal GDP can increase because of changes in the price level and/or changes in real output. All that we know from the given information is that nominal GDP rose from 2011 to 2012 by 7%: this may mean that this economy is actually produ