Transcription
ARTICLESCalcium Green FlAsH as a genetically targetedsmall-molecule calcium indicatorOded Tour1,2, Stephen R Adams2, Rex A Kerr3,4,8, Rene M Meijer5, Terrence J Sejnowski1,3–5,Richard W Tsien6 & Roger Y Tsien1,2,7Intracellular Ca2 regulates numerous proteins and cellular functions and can vary substantially over submicron andsubmillisecond scales, so precisely localized fast detection is desirable. We have created a B1-kDa biarsenical Ca2 indicator,called Calcium Green FlAsH (CaGF, 1), to probe [Ca2 ] surrounding genetically targeted proteins. CaGF attached to atetracysteine motif becomes ten-fold more fluorescent upon binding Ca2 , with a Kd of B100 mM, o1-ms kinetics and good Mg2 rejection. In HeLa cells expressing tetracysteine-tagged connexin 43, CaGF labels gap junctions and reports Ca2 waves afterinjury. Total internal reflection microscopy of tetracysteine-tagged, CaGF-labeled a1C L-type calcium channels shows fast-risingdepolarization-evoked Ca2 transients, whose lateral nonuniformity suggests that the probability of channel opening varies greatlyover micron dimensions. With moderate Ca2 buffering, these transients decay surprisingly slowly, probably because most of theCaGF signal comes from closed channels feeling Ca2 from a tiny minority of clustered open channels. With high Ca2 buffering,CaGF signals decay as rapidly as the calcium currents, as expected for submicron Ca2 domains immediately surrounding activechannels. Thus CaGF can report highly localized, rapid [Ca2 ] dynamics.Selective activation of distinct cellular functions is often achievedthrough localization of calcium signals to regions ranging in size fromtens of nanometers (nanodomains) to micrometers (microdomains).Local calcium signaling is especially prominent at presynaptic activezones and postsynaptic densities—structures that are distinguished byhighly organized macromolecular arrays that yield precise spatialarrangements of calcium signaling proteins1.Fluorescence imaging is a major tool for studying micrometer-scalelocal Ca2 signals1,2, but nanodomains cannot be directly resolved bylight microscopy. Even on the microdomain scale, bulk cytosoliccalcium, [Ca2 ]c, as measured by diffusely distributed indicators,often fails to correlate quantitatively with biological responses suchas exocytosis or channel gating that have been assumed to be [Ca2 ]cregulated3,4. One can postulate either that the relevant local intracellular calcium concentration [Ca2 ]i is very different from the spatiallyaveraged concentration5, or that molecular mechanisms other than[Ca2 ]c also have major roles4,6. Because of such controversies, mucheffort has been put into experimental7–9 and theoretical3,6,10,11 studiesof localized intracellular calcium. These studies predict that the local[Ca2 ]c within nanometers of the mouths of Ca2 channels (Ca2 microdomains) is orders of magnitude larger and faster decaying thanthe volume-averaged [Ca2 ]c measured by traditional indicators distributed throughout the cytosol. One debate concerns whether a givenvesicle is predominantly triggered by Ca2 from one local channel12 orrather from a more widespread microdomain resulting from thesuperposition of the Ca2 contributions of several nearby channels13.Experimental measurement of localized [Ca2 ]c has been difficult andindirect even with high-resolution imaging14–17. As long as theindicator is diffusely distributed, fundamental barriers of limitedoptical resolution will prevent measurements with the required submicroscopic spatial resolution, and consequently there is a need fornew techniques that can probe calcium nanodomains.One way to circumvent the limited spatial resolution of lightmicroscopy is to specifically attach a calcium indicator to a targetprotein. The recombinant photoprotein aequorin was the first calciumindicator to be genetically targeted to specific compartments, including the mitochondria18, nucleus19, endoplasmic reticulum20 andplasma membrane8. However, technical limitations, including lowlevels of luminescence and the destruction of aequorin by Ca2 ,complicate aequorin measurements and prevent single-cell imagingand high time-resolution comparison with electrophysiology.Another approach is to use genetically targeted fluorescent proteinbased sensors of Ca2 such as the cameleons21. Cameleons arechimeric proteins consisting of cyan and yellow mutants of greenfluorescent protein (GFP), separated by calmodulin (CaM), and theCaM-binding domain of myosin light chain kinase (M13); changes in1Howard Hughes Medical Institute, 2Department of Pharmacology and 3Center for Theoretical Biological Physics, University of California, San Diego, 9500 GilmanDrive, La Jolla, California 92093-0647, USA. 4Computational Neurobiology Lab, The Salk Institute, 10010 N. Torrey Pines Road, La Jolla, California 92037, USA.5Division of Biological Sciences, University of California, San Diego, 9500 Gilman Drive, La Jolla, California 92093-0647, USA. 6Department of Molecular and CellularPhysiology, Stanford University School of Medicine, 279 Campus Drive, Stanford, California 94305, USA. 7Department of Chemistry and Biochemistry, University ofCalifornia, San Diego, 9500 Gilman Drive, La Jolla, California 92093-0647, USA. 8Present address: HHMI Janelia Farm Research Campus, 19700 Helix Drive,Ashburn, Virginia 20147, USA. Correspondence should be addressed to R.Y.T. (rtsien@ucsd.edu).Received 20 November 2006; accepted 16 May 2007; published online 17 June 2007; doi:10.1038/nchembio.2007.4NATURE CHEMICAL BIOLOGYVOLUME 3NUMBER 7JULY 2007423
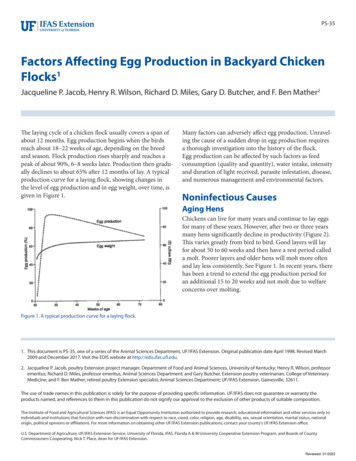
ARTICLES––2 CO2acfO20 µmFluorescence750dCys500250Fluorescence360160Kd 100 µMTen-fold dynamic rangee8040100Unbound500 520 540 560 580 600 620 640Wavelength (nm)0714Time (min)211.00.5Kd 50 µMKd 61 µM0.002.5RESULTSChemical properties of CaGF and tests on connexin 43Calcium Green (2) is a hybrid between 1,2-bis(o-aminophenoxy)ethane-N,N,N , N -tetraacetic acid (BAPTA; 3) and fluorescein (4)29in which Ca2 binding to the BAPTA inhibits photoinduced electrontransfer quenching of the fluorescein. FlAsH (5) is a fluorescein withtwo arsenic substituents such that binding of a tetracysteine motif tothe arsenics likewise inhibits photoinduced electron transfer quenching of the fluorescein26. Therefore we designed Calcium Green FlAsHas a triple hybrid combining a fluorescein with biarsenical substituents5.0and a BAPTA-like chelator (Fig. 1a; see Supplementary Methods online for CaGF synthesis): the upper domain provides the Ca2 binding site, the middle fluorescein structureis the fluorophore, and the bottom domain contains two arsenicatoms that form four covalent bonds with the two pairs of cysteines ofthe tagged peptide and thereby provide genetic targetability. Becausewe anticipated the need to measure very rapid Ca2 transients of 10sto 100s of mM, we derived the Ca2 binding site from the low-affinity,pentadentate chelator o-aminophenol-N,N,O-triacetic acid (APTRA;6)30 instead of octadentate BAPTA. To improve the Ca2 :Mg2 selectivity of APTRA, we amidated one of its carboxylates with avariety of primary and secondary amines to produce new, low-affinity(20–400 mM Kd) Ca2 chelators with minimal affinity (Kd 410 mM) for Mg2 (data not shown). The most promising chelatorcontaining a morpholine amide was conjugated with carboxyFlAsH (7) to give CaGF. As expected, CaGF fluorescence is highlyquenched when the dye is not bound to a tetracysteine peptide.Peptide binding increases the fluorescence by greater than four-fold,after which Ca2 binding enhances the fluorescence a further ten-foldwith a Kd ¼ 100 mM for Ca2 (Fig. 1b). The rate constants for Ca2 binding were too high to easily resolve experimentally, but using astopped-flow apparatus, we determined that the off-rate was above2,000 s–1 (Supplementary Methods). This is consistent with 420,000s–1 off-rates of structurally similar calcium-binding molecules withcomparable Kd’s31.To test CaGF in living cells, it was necessary to generate an AM esterderivative of CaGF because the multiple carboxylates render CaGF lessmembrane permeable than FlAsH or ReAsH (8)27. The CaGF/AM (9)penetrates living cells, and after esterase cleavage it is able to bind thetarget protein. To test the specificity of CaGF, we expressed in HeLacells a recombinant connexin 43 tagged with a tetracysteine motif inits C terminus (cx43-TC). Connexin 43 is tightly localized to gapjunctions, and CaGF staining of these cells showed strong fluorescencein gap junctions between cells (Fig. 1c). We also used a connexin 43tagged with Emerald GFP and an optimized tetracysteine peptide32(cx43-GFP-C4), with the GFP serving as both an internal fluorescentmarker for recombinant protein expression and a reference signal toestimate the completeness of labeling of CaGF. To test the calciumsensitivity, we expressed cx43-GFP-C4 in cells, briefly fixed the cellswith 3% paraformaldehyde to prevent motility, permeabilized them2 20 µmfluorescence resonance energy transfer (FRET) between CFP and YFPgive a ratiometric readout of Ca2 . Recently improved cameleons22,23have a larger dynamic range and a substantial reduction in theirsensitivity to endogenous calmodulin, both of which improve theperformance of cameleons targeted to the cell membrane. However,cameleons do have intrinsic limitations. At 650 amino acids in size, thecameleons are often bigger than the host protein to which they arefused. In addition, their dynamic response is often slower than thephysiological calcium signals they are supposed to report. A troponinbased indicator with a relatively fast off-rate response to Ca2 wasrecently reported24, but its off-rate is fitted by a double exponentialdecay with t’s of 142 ms and 867 ms, which are still more than twoorders of magnitude slower than a typical small-molecule calciumindicator. Recently, GCaMP2, another calmodulin-based fluorescentprotein-based sensor of Ca2 , was tethered to Na pumps to reportsubplasmalemmal Ca2 signals on timescales of minutes25. However,millisecond Ca2 transients within nanometers of Ca2 -handlingproteins have eluded direct experimental measurement.The genetic targetability of biarsenical dyes can be combined withthe fast kinetics and small size of organically synthesized calciumindicators by tagging the protein of interest with a very small peptidedomain containing a tetracysteine motif 26–28, which is then labeledin situ with a new biarsenical Ca2 indicator. In particular, we tagconnexin 43, the building block of gap junctions, and the a1C L-typevoltage-gated calcium channel and label these proteins in livingintact cells with CaGF.4246220Normalized fluorescence2 15,260 µM Ca1,06032g20 µmb14OCys Cys Cys51Figure 1 In vitro and intracellular titration ofCaGF fluorescence. (a) Structure of CaGF boundto a tetracysteine-containing peptide or protein.(b) In vitro calibration of CaGF; fluorescenceincreased Bten-fold (concentration is indicatedin red above the traces). (c) A large gap junctionbetween two HeLa cells expressing recombinantconnexin 43 tagged with a tetracysteine in itsC terminus and stained with CaGF. (d–g) Intracellular calibration of CaGF bound to cx43-GFPC4. A field of cells with an en-face and aperpendicular gap junction (red and blue arrows,respectively) bathed in zero calcium plus 1 mMEGTA (d); the same field in 15 mM calcium (e);raw data of CaGF titration (f). The calciumconcentrations are indicated by numbers:1 ¼ 15 mM; 2 ¼ zero calcium plus 1 mM EGTA;3 ¼ 25 mM; 4 ¼ 100 mM; 5 ¼ 400 mM and6 ¼ nominal zero estimated at 3 mM. (g) Doseresponse curves constructed from the data shownin f (red, Kd ¼ 50 mM; blue, Kd ¼ 61 mM).log10 Ca(µM)VOLUME 3NUMBER 7JULY 2007NATURE CHEMICAL BIOLOGY
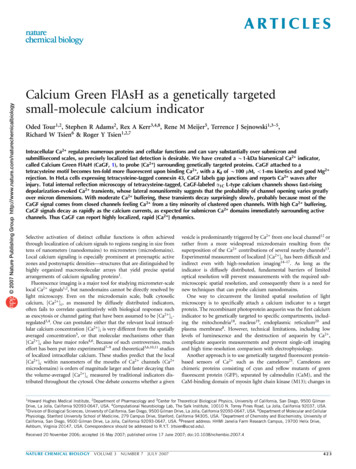
ARTICLESdCa2 IV0ExtracellularIII0IIIIntracellularTCTCCurrent (pA)aC– 80 mVTime (s)234– 80 mV–500–1,000 20 mV–1,500e125Fluorescenceb110075502510 µm0f32.071F/F0c1.5210 µm 461.05012Time (s)34with 20 mM digitonin (10) and compared fluorescence of gapjunctions through a range of imposed calcium concentrations. Thefluorescence signal was relatively dim when the cells were bathed inzero calcium plus 1 mM EGTA (11) (Fig. 1d) and much brighter in15 mM calcium (Fig. 1e). The fluorescence in six different concentrations of calcium yielded apparent Kd’s of 50–61 mM—about half thein vitro Kd (Fig. 1f,g). This modest discrepancy is probably due to theDonnan potential, the residual potential between the cytosol and theextracellular medium resulting from the net negative charge of thecytosolic macromolecules. A typical Donnan potential of –9 mV(ref. 33) means that when the membrane is permeable to all smallions, intracellular [Ca2 ] is twice extracellular [Ca2 ], which explainswhy 50 mM extracellular [Ca2 ] suffices to half saturate an indicatorwith 100 mM Kd. The relative amplitudes of the basal fluorescencesversus Ca2 -dependent increments in Figure 1f also suggestthat practically all the cx43-GFP-C4 molecules have bound CaGF(see Supplementary Methods for quantification of completenessof labeling).To verify that CaGF can report the dynamic of calcium changes inliving cells, we elicited calcium waves by using a sharp pipette to poketwo cells out of several that are shown in Supplementary Video 1online. The cells express cx43-GFP-C4 at localized gap junctions andhemichannels distributed diffusely on the membrane, and they wereimaged in high extracellular calcium solution. Two calcium waves thatpropagate between adjacent cells can be seen in response to the twopokes. The calcium concentrations registered in the impaled cell andits nonimpaled but coupled neighbor were as high as 120 mM and80 mM at regions adjacent to the gap junction; they graduallydecreased to a few micromolar at more distant regions. Notice thatour cx43-GFP-C4 continued to conduct Ca2 at concentrations nearthe upper end of the range reported to close gap junctions34.CaGF responses from L-type Ca2 channels are nonuniformMuch previous work has focused on calcium nanodomains aroundvoltage-gated calcium channels. Therefore, we made tetracysteinetagged a1C L-type calcium channels in order to image local Ca2 NATURE CHEMICAL BIOLOGYFigure 2 CaGF reports calcium dynamics of L-type calcium channelactivation. (a) A schematic representation of an a1C channel tagged withtwo tetracysteine peptides (2TC-a1C). (b,c) A typical bright field image ofHEK293 cells (b) and a TIRF image of the same field following CaGFstaining, illustrating seven numbered cells (c). Cells 1, 2 and 3 weresuccessfully transfected with the 2TC-a1C construct. Five ROIs are indicatedon cell 1 (small magenta ROI, blue, light blue, yellow and black), and onegray ROI is shown on cell 4. (d) The membrane potential of cell 1 wasclamped at –80 mV and subsequently stepped to 20 mV for 1.4 s.External Ca2 was set at 15 mM and FPL 64176 was added. (e) Rawdata for CaGF fluorescence is heterogeneous with micron-scale hot spots(magenta and blue) at one end of the cell. (f) A plot of F/F0 illustrates thatin this cell the signal rise is fastest and largest at the hot spots.VOLUME 3NUMBER 7JULY 2007domains near the channel mouths. In contrast to connexin 43, whichis highly concentrated and localized at gap junctions, the a1C channelsexpressed in human embryonic kidney (HEK293) cells are much moredifficult to image because of their lower density and more diffuseexpression pattern. Therefore, we used total internal reflection fluorescence microscopy (TIRF-M) to improve the signal/background ratioby confining the observation to a thin (B150-nm) section includingthe plasma membrane, while excluding the majority of intracellularnonspecific background staining (Supplementary Fig. 1 online). Thea1C channels were tagged at the intracellular N terminus either with atandem repeat of two tetracysteine motifs35 (2TC-a1C, Fig. 2) or witha GFP containing an optimized tetracysteine peptide (N4-GFP-a1C,Fig. 3). HEK293 cells stably expressing the b1 and a2d auxiliarysubunits were transiently transfected with the 2TC-a1C construct.Figure 2a shows a cartoon of the channel tagged with two tetracysteine motifs. Figure 2b depicts a typical bright field image of thesecells during patch clamping; Figure 2c is a TIRF image of the samefield after CaGF staining, illustrating seven numbered cells and sixregions of interest (ROIs). Cells 1, 2 and 3 were successfully transfectedwith the 2TC-a1C constructs: they expressed cotransfected mRFP1(ref. 36) (data not shown), had a higher CaGF basal signal (Fig. 2c),and showed a CaGF fluorescent response. The untransfected cells (cells4–7) had very low green fluorescent basal counts, no mRFP1, and noCaGF response (Supplementary Video 2 online).To activate calcium channels with high temporal precision, wepatch clamped individual cells. External Ca2 was set at 15 mM andFPL 64176 (12) was added to the dish to maximize calcium influx37.In Figure 2d, cell 1 from Figure 2c was held at –80 mV and given a1.4-s depolarizing step to 20 mV (see Supplementary Fig. 2 onlinefor more details). The current of 1,500 pA is typical; given an expectedsingle-channel conductance38,39 of 7 pS and driving force of 90 mV,this corresponds to 2,000–2,500 simultaneously open channels.In a different set of experiments, we estimated the number ofchannels expressed in transfected cells (Ncell) by comparing totalfluorescence from confocal reconstructions of cells expressingN4-GFP-a1C with fluorescence from a solution of GFP of knownconcentration. We also used the confocal images to estimate thefraction of fluorescent signal arising from channels at the plasmamembrane (Nmembrane) and found it to be 25–40% of the total signal.To avoid effects from photodamage, we did not patch clamp reconstructed cells, but we used the same criteria to select cells in each case.An alternative and independent method to estimate Ncell is to run tensof thousands of cells through a flow cytometer (FACSVantage) and touse a set of fluorescent beads (Bangs Laboratories) with a knownnumber of fluorophores as a fluorescent standard (see SupplementaryMethods for details on both procedures). Using both methods wefound that highly expressing cells had 1–2 million labeled channels onthe plasma membrane. Confocal reconstruction of these cells yielded a425
ARTICLESaCab2 IIIVI5Extracellular2III31IntracellularN4(TC)c–80 mV 110 mV4C–80 mV5 µmfpApA0–1,5000–80 mV–1,500 20 mV 20 mV–3,000 20 mV 20 mVg620580 10 mM Ca250034601h5005460F/F0Fluorescence2 540420e–3,000FluorescenceFluorescenced–80 mV4202500440138031.521.3421.1380was subsequently induced by application of an ionophore, tearingof the membrane with a sharp pipette, or introducing highconcentrations of calcium via the patch pipette (as exemplified inSupplementary Video 3 online), spatially uniform increases influorescence were observed instead. Thus, hot spots are not due todifferences in the ability of CaGF to sense calcium or the local densityof channels, but rather they reflect stable underlying variations in theprobability of channel opening in response to depolarization.6205600.93400.00.51.0Time (s)1.50.00.51.01.5Time (s)surface area of 1,000–2,000 mm2. Thus, transfected cells had a densityof approximately 1,000 channels mm–2. It is important to note the lowopen probability of these channels even in the presence of FPL 64176:only a few thousand out of several million opened in response to thedepolarization stimulus (0.1–0.3% of the total).During electrical stimulation, fluorescence was simultaneouslymonitored with TIRF-M (Fig. 2e,f). In the example shown, werestricted our analysis to cell 1, which was directly patched. However,cells 2 and 3, which were coupled via endogenous gap junctions to cell1, showed a complex fluorescent response (Supplementary Video 2).The baseline fluorescence of cell 1 was stronger at the center of the celland gradually became dimmer at the cell’s edges. In the simplest case,after depolarization we would expect the highest fluorescent responseto be in the region with the highest channel density (yellow and blackROIs). In contrast, as shown in Figure 2e, the fluorescent response isheterogeneous with micron-scale hot spots at one end of the cell(magenta and blue ROIs) and no obvious correlation between startingfluorescence and size of response (Supplementary Video 2; correlation coefficient R ¼ –0.1). A plot of F/F0 (Fig. 2f) illustrates that inthis cell the signal rise is fastest and largest at the hot spots at the upperright and decreases in both rate and amplitude downwards andleftwards. The extent of unspecific staining and autofluorescence canbe assessed from the signal at nontransfected cells (Fig. 2c, cells 4–7and Fig. 2e, gray ROI). Note that in TIRF mode the unspecific stainingand autofluorescence signals are low because most of the cell’s volumeis excluded from the thin imaged layer. The same experimentalprotocol was repeated three times on this cell with a two-minuteinterval between repetitions. In each repetition, the same hot spotswere activated. Experiments on other cells revealed cell-to-cell variations in the number, location and magnitude of hot spots, but hotspots remained stable within each individual cell. When Ca2 influx426Figure 3 Ca2 transients in response to three 20-ms depolarization pulses.(a) A schematic representation of an a1C channel tagged with GFP and theoptimized tetracysteine peptide N4 (N4-GFP-a1C). (b) A TIRF image showingthe locations of the color-coded and numbered ROIs. The black ROI is theentire cell (not shown). (c) Current trace with three short depolarizationpulses. Time is measured from the beginning of the first pulse. 1 mMBAPTA was present in the pipette; the external solution contains 15 mMCa2 and 10 mM FPL 64176. (d) Three fluorescent traces aligned in timewith the current trace. The imaging rate was 100 f.p.s. (e) Two additionalfluorescent traces registered at ROIs placed on hot spots. (f) A secondcurrent applied to the same cell, 2 min after the trace shown in c, using theprotocol of Figure 2d. (g) Fluorescent signals at the ROI shown in c inresponse to the 960-ms depolarization. (h) Comparison of the responses ofthe red ROI to the two protocols, depicted as F/F0 (the color of the tracefrom d .was switched to gray).Kinetics and the effects of Ca2 bufferingThe calcium signals observed in Figure 2, and in similar experiments,are complex in nature. CaGF is expected to be active on openchannels, but CaGF should also be activated on closed channels thatlie either within the nanodomain of an open channel or in a largerscale microdomain in which buffers have become saturated andbaseline calcium has increased over time. Additionally, a portion ofthe calcium increase may be caused by release from internal stores, aprocess known to exist in HEK293 cells40, and may be triggered by ourlarge a1C calcium influx. Indeed, in a subset of experiments we sawlarge fluctuations in CaGF signal over hundreds of milliseconds toseconds, which is consistent with slow release from internal stores(data not shown). We therefore refined our experimental protocol inorder to maximize the proportion of fluorescent signal from CaGFattached to open channels and reduce the possibility of release fromstores. To reduce the time for calcium accumulation, we stepped from–80 mV to 20 mV for 20 ms and then jumped to the calcium reversalpotential ( 110 mV) to terminate influx and avoid a large tailcurrent. Additional pulses of calcium were delivered by jumpingbriefly to 20 mV, and a final calcium influx was caused by the tailcurrent when we jumped back to –80 mV. We also changed thecalcium buffering in the patch electrode from 4.5 mM EGTA to 1 mMBAPTA; BAPTA is a faster buffer and is therefore more efficient inpreventing the spread of Ca2 around open channels. The protocol isdiagrammed in detail in Supplementary Figure 2.Figure 3a depicts a schematic representation of an a1C channeltagged with an optimized tetracysteine peptide (N4) and a GFP (N4GFP-a1C); Figure 3b depicts a TIRF image of a cell stably expressingN4-GFP-a1C and also highlights several ROIs on that cell. A typicalcurrent trace is provided in Figure 3c; peak currents remained in the1,500–2,000 pA range except for the transient tail current. Threefluorescent traces temporally aligned with the current trace arealso shown (Fig. 3d; see also Supplementary Video 4 online). Theneighboring red and blue ROIs are a hot spot and a cold spot,respectively, as compared with the whole cell (black ROI). Althoughthe two regions had about the same density of N4-GFP-a1C channels,as indicated by the similar starting fluorescence of all three regions, aVOLUME 3NUMBER 7JULY 2007NATURE CHEMICAL BIOLOGY
ARTICLES–1.0–0.5Figure 4 CaGF shows rapid kinetics. The upper panel depicts the currentelicited by the same protocol described in Figure 3c, except that timewas measured from the beginning of the tail current and 40 mM EGTAwas present in the patch pipette. Below is the corresponding fluorescentsignal, where F/Ffit is the photobleaching-corrected signal. The fluorescentresponse to the tail current (the fourth pulse) is the largest and has almostthe same fast time course as the current, which demonstrates the fast Koffof CaGF.0.0Current (pA)–500–1,500–2,500ROI hot spot, but the extended stimulation caused a fluorescencepeak after approximately 150 ms with a five-fold larger change influorescence (Fig. 3h). Because the current peak occurred within 20 ms,the extra fluorescence must be due to activation of CaGF bound toclosed channels. This confirms that the changes to our protocol reducethe proportion of the signal due to CaGF on closed channels.If only CaGF bound to open channels were activated, the fluorescence signal would approximately track the current. However, weobserved fluorescence that decays more slowly than the current, whichsuggests that most of the remaining signal was still due to CaGF onclosed channels. If the extra signal were caused by local saturation ofbuffers, increasing the concentration of buffers would reduce the extrasignal. A representative recording made with 40 mM EGTA in thepipette is shown in Figure 4. Similarly small (o1% F/F) and fasttraces that closely track the calcium current were recorded in all fiveexperiments with 40 mM EGTA in the pipette solution. This resultconfirms that the slow decays seen in the protocol of Figure 3c reflectthe underlying calcium dynamics, not an unexpected reduction in therate of CaGF unbinding.–3,5001.011.000.99–1.0–0.5Time (s)0.0spatially heterogeneous calcium response was observed once wedepolarized the cell. The relative scarcity of hot spots can be seen inSupplementary Video 4 and is also exemplified by comparing the redROI with the black ROI, which encompasses the entire cell and hasabout one seventh the peak response amplitude of the red signal.Furthermore, we observed heterogeneous responses at different hotspots. Two additional hot spots (Fig. 3e; brown and magenta ROI), aswell as the red ROI (Fig. 3d), showed a fast rise but differedextensively in the rate of decay. The red and magenta traces weremore representative (observed in eight similar experiments) and weresurprisingly slow. Because CaGF was engineered to have a fast Koff, thisslow decay suggests that calcium stays high at these ROIs for tens tohundreds of milliseconds.To examine whether the hot spots observed with this protocol arethe same as those seen previously, we gave one 960-ms depolarizationto 20 mV in place of the entire protocol that contained three briefsteps. The depolarization elicited a large prolonged calcium current(Fig. 3f). The same hot spots continued to show larger fluorescentresponses than the cell as a whole, whereas cold spots showed no (orsmaller) responses (Fig. 3g).By plotting signals as F/F0 (Fig. 3h) we compared on one graph thesignals at the red ROI elicited by two currents (Fig. 3c,f). As expected,both protocols gave a similar initial fluorescence increase for the redbFractional binding ordepletionFraction of dyebound1.00.80.60.40.20.0050100 150 200Distance (nm)c1.00.80.60.40.20.0250d3.0Free calcium (mM)aModeling of CaGF responsesTo better understand these rapid responses, we used a computermodel to simulate CaGF activation in the neighborhood of a singleopen channel (see Supplementary Methods for details). In agreementwith previous modeling work10,11,41, we found that a quasi–steadystate nanodomain of calcium is established around an open channelwithin 0.1 ms. The spatial extent of CaGF activation in this nanodomain is limited by its low affinity (Fig. 5a, gray line), is restricted stillfurther by 1 mM BAPTA or 40 mM EGTA (Fig. 5a, red and blacklines, respectively), and is visibly much smaller than the expectedactivation of a hypothetical dye with a 100-fold higher affinity tocalcium (Fig. 5a, magenta and cyan). Although the CaGF on the activechannel was predicted to be constantly calcium-bound, at observedchannel densities of B1,000 mm–2, we predicted that an average ofnine additional CaGFs on nearby closed channels would be active forevery one on an open channel. This recruitment of neighboring2.5Fractional CaGFactivationF/F fit1.022.01.51.00.50.200.150.100.050.000.0300 600 900 1,200 1,5000Distance from channel cluster (nm)0.250150300450600Distance from channel cluster (nm)24816 32Cluster size64128Figure 5 Simulation of CaGF signals. All panels show results after 20 ms of depolarization for 7 pS calcium channels with 100 mV driving force. Channels orclusters of channels are assumed to be uniformly distributed. (a) CaGF activated by an isolated open channel. Shown is the predicted fractional activation ofCaGF as a function of lateral distance from the channel (red squares, 1 mM BAPTA; black circles, 40 mM EGTA; blue triangles, 4.5 mM EGTA; gray invertedtriangles, small-molecule buffers absent) and a hypothetical dye with 100-fold higher affinity (1 mM BAPTA, magenta diamonds; no buffer, cyan circles).(b) Fraction of bound CaGF (thin lines, open symbols) and depletion o
Calcium Green FlAsH as a genetically targeted small-molecule calcium indicator Oded Tour1,2, Stephen R Adams2, Rex A Kerr3,4,8, Rene M Meijer5, Terrence J Sejnowski1,3-5, Richard W Tsien6 & Roger Y Tsien1,2,7 Intracellular Ca2 regulates numerous proteins and cellular functions and can vary substantially over submicron and submillisecond scales, so precisely localized fast detection is .