Transcription
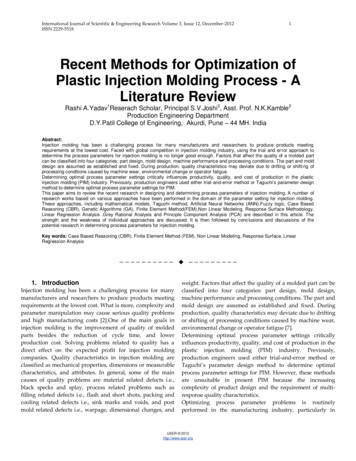
Proceedings of the International Conference on Industrial Engineering and Operations ManagementBandung, Indonesia, March 6-8, 2018Quality Improvement in Plastic Injection Molding Industry:Applying Lean Six Sigma to SME in KuwaitAlaa Alshammari, Sahar Redha, Shahad Hussain, Tuleen Nazzal, Zahraa Kamal, andWalid SmewIndustrial Engineering DepartmentAmerican University of the Middle East (AUM)Eqaila, KuwaitWalid.Smew@aum.edu.kwAbstractIn this paper, Lean and Six Sigma were applied to a Small and Medium-Sized Enterprise (SME),Company XYZ for plastic manufacturing in Kuwait, to reduce the variation in their injection moldingprocess. Variation exists within any process and when this variation goes beyond certain limits, nonconforming parts are produced and the company will face increased percentage of waste, operational cost,and reduced customer’s satisfaction. Many of the XYZ Company plastic fittings were rejected as theywere defective or having defects such as internal surface marks, flash, and bubbles. Floor Traps 6x4x2fittings accounted for the highest rejection rate in XYZ Company. Six Sigma DMAIC combined with the5S were applied to tackle this problem. DMAIC is a general engineering design approach that can beapplied for many production or service problems that need practical solutions. It is an acronym stands forDefine, Measure, Analyze, Improve, and Control. Results show that by implementing Six Sigmacombined with the 5S program, Company XYZ achieved an improvement in its Sigma Level and Defectsrate (DPMO) which lead to significant cost savings and increased its competitiveness.KeywordsLean Six Sigma, DMAIC, SME, Injection Molding, Variation, Cause and Effect Matrix, SPC, DOE,Desirability Function Approach1IntroductionManufacturing is the action of making things. It is the process of transforming materials into items with greatervalue. Most materials used in manufacturing are classified into four categories: metals, ceramics, polymers andcomposites. Polymers are divided into two categories: plastics and rubbers. Thermoplastics and thermosets are twotypes of plastics. Unlike thermosets, thermoplastics can be subjected to heating and cooling cycles repeatedlywithout degrading. This property allows thermoplastics to be used in plastic injection molding, which is the primaryfocus of this study (Valles, Sanchez, Noriega, & Nunez, 2009).“Injection molding is a process in which a polymer is heated to a highly plastic state and forced to flow under highpressure into a mold cavity, where it solidifies. The molded part, which is called a molding, is then removed fromthe cavity,” (Groover, 2013, p. 238). Within any process there exists variation. When this variation goes beyondcertain limits, defected parts, and waste may be produced. Lean and Six Sigma are principles that aim to reducevariation and eliminate waste as much as possible (Montgomery, 2013).Lean is a way of thinking that aims to reduce waste, improve throughput, promote work standardization, andorganize the workplace to be more effective and efficient (Lee & Wei, 2010). While Six Sigma is a principle, anidea of improving a process by reducing process variation related to the quality characteristics of the product; itdescribes how a process deviates from the target.The main idea of Six Sigma is to fit six standard deviations between the mean (target) and the specification limit(Blount et al., 2000). Anything out of the specification limits is considered as defective and is measured by parts permillion (PPM) or defects per million opportunities (DPMO). IEOM Society International2856
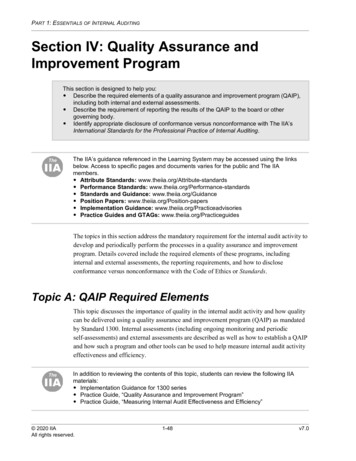
Proceedings of the International Conference on Industrial Engineering and Operations ManagementBandung, Indonesia, March 6-8, 2018Lean and Six Sigma are not mutually exclusive as they can be applied side by side. The implementation of leancombined with the Six Sigma principle aim to prevent defects rather than detecting them. Lean Six Sigma is aneffective way of improving a process by reducing variation and waste as much as possible (Montgomery, 2013).2LITERATURE REVIEWDifferent case studies were studied, linked, and compared. Before applying the DMAIC methodology, we had tounderstand how Lean Six Sigma can be applied in plastic injection molding.Two similar case studies, one by (Lo, Tsai, & Hsieh, 2009) and another by (Bharti, Khan, & Singh, 2011), bothaimed to improve the quality of their injected molded products. The product produced in (Lo, Tsai, & Hsieh, 2009)study was plastic lenses while (Bharti et al., 2011) focused on nylon-6 bush. Inappropriate settings of the injectionmolding process parameters resulted in defects, some of which were: stress marks, warpage, over-shrinkage, sinkmarks, and stress cracking problems. In both case studies the process conditions were changed only. Tools likePareto chart, process capability charts, fish bone diagram, Taguchi and many more were used in both case studies.Implementation of DMAIC was successful in both case studies as the process capability index of (Lo et al., 2009)increased from 0.57 to 1.75, and the sigma levels of the process of (Bharti et al., 2011) increase from 2.38 to 5.18.Another bush study that is similar to (Bharti et al., 2011) was done by (Mansur, Mu'alim, & Sunaryo, 2016). Thisstudy was more detailed and thorough with their findings and solutions. The aim of this study was to apply Lean SixSigma to minimize the defects produced and reduce the waste. The wastes were classified into four types. The typesof defects were classified into eight. The data measured and collected was also classified into attribute data andvariable data. Based on attribute data of the bush product the sigma level was 4.6 and the DPMO is 988.42. Thevariable data on each dimension has its own DPMO and sigma level. Similar tools to (Lo et al., 2009) were used.A study conducted in Malaysia by (Kairulazam, Hussain, Zain, & Lutpi, 2014) was done due to the high rejectionrate of high gloss plastics produced by the process injection molding. The rejection was due to technical adjustment,sink mark, flow mark, and others. Tools such as fishbone diagram, Pareto chart, FMEA, and function developmentmatrix were used to identify possible factors. Gage R&R and T-Test were used to test for significant difference.They managed to improve the process from 1.74 to 3.00 .3MethodologyThe DMAIC methodology was used in this study to improve the injection molding process. DMAIC is an acronymthat stands for Define-Measure-Analyze-Improve-Control. “These phases lead a team logically from defining aproblem through implementing solutions linked to underlying causes, and establishing best practices to make surethe solutions stay in place” (George, Rowlands, Price, & Maxey, 2005, p. 1).3.1Define PhaseThe first phase of DMAIC is define, where the problem is stated along with the inputs and outputs of the system.The projects goal, objective and customer requirements are also stated in this phase.Fig. 1 shows that the process of injection molding contributes to around 75% of the company’s sales. Thus,improving the quality of an injected molding product will highly affect the company’s profits.Figure 1. Percentage of company XYZ salesIn Company XYZ, the product with the highest percentage of rejection was Floor Trap 6x4x2; thus, the boundary ofour project was to focus on this product. IEOM Society International2857
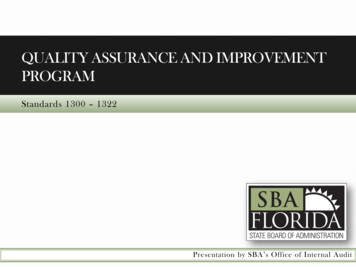
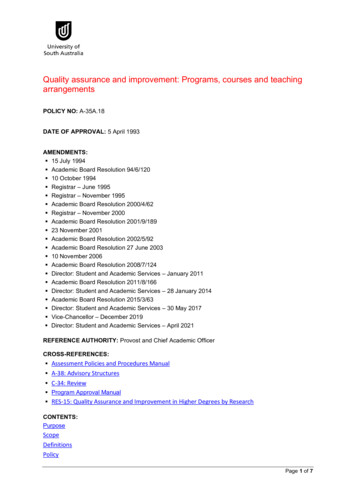
Proceedings of the International Conference on Industrial Engineering and Operations ManagementBandung, Indonesia, March 6-8, 2018A project charter was constructed to illustrate the project’s objective, scope, team members and the due dates toaccomplish each phase of DMAIC. The project charter was used to provide the management of Company XYZ withthe direction in which our project was going. In addition, it served as an agreement between the Lean Six Sigmateam, and the management of the company. The goal and scope of this study was to reduce the defect rate of FloorTrap 6x4x2 fittings up to 50%.Furthermore, a SIPOC diagram was constructed to identify relevant elements of the project, in which it gives generalinformation and an overview of the project. SIPOC is an acronym that stands for suppliers, inputs, process, outputs,and customers. The SIPOC diagram is shown in Fig. 2.Figure 2. SIPOC diagramIn the define phase of DMAIC, SIPOC helped us to agree on the project’s boundary, and identified the stakeholders.Stakeholders are those who are related to the project; anyone that benefits from the project, or gets affected by it isconsidered a stakeholder.3.2Measure PhaseThe second phase is measure. In this phase a baseline is set to understand the current performance of the process.The baseline will be useful later on in the improve phase when we want to compare the improvements made(Jirasukprasert, Garza-Reyes, Soriano-Meier, & Rocha-Lona, 2012).First, we needed to understand the procedure that the Floor Trap fitting goes through. A deployment flowchart, alsoknown as swim lane flowchart, was constructed to show the steps of the process and the interactions between peopleor departments. This is shown in Fig. 3.Figure 3. Swim lane flowchart IEOM Society International2858
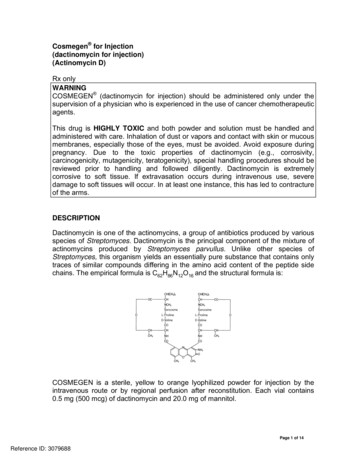
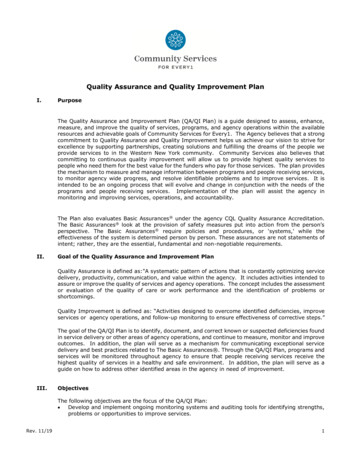
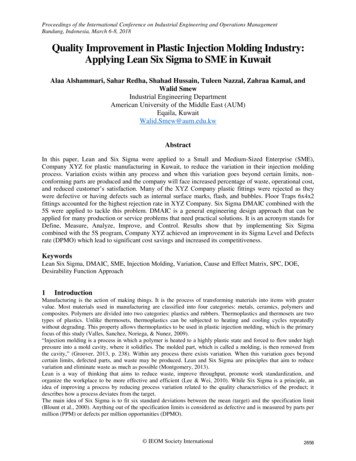
Proceedings of the International Conference on Industrial Engineering and Operations ManagementBandung, Indonesia, March 6-8, 2018In the lane of the operator, the operator inspects the products and decides whether to accept or reject it. Measuringattribute data in terms that rely on human judgment may cause problematic measurement system issues (Linderman,Schroeder, Zaheer, & Choo, 2003). Since the judgment of the operator is nominal, we have used the Kappa Statistic.Kappa is a type of attribute Measurement System Analysis (MSA) which measures the degree of agreement of theassessments that are made by different appraisers when assessing the same samples. We have used Minitab softwareto generate an output for the Kappa Statistics which consists of four categories. Fig. 4 displays two of the categories.As it can be seen in Fig. 4, the percentages of agreement are all 90% or above which states consistency and almostperfect agreement.We have concluded from the attribute agreement analysis, the operators’ judgment is acceptable; therefore it statesAssessment Agreementthat the source of variation is fromthe process itself.Date of study:Reported by:Name of product:Misc:Within Appraisers1 9/4/201 7Si x Sigma TeamFloor Trap 6x4x2 Fitting ProductKappa AnalysisAppraiser vs Standard95.0% CIPercent95959090PercentPercent95.0% CIPercent85808580Operator AOperator BOperator AAppraiserOperator BAppraiserFigure 4. Attribute agreement analysisA random sample of 400 products was gathered to specify the types of defects and defectives that were caused bythe process. The Pareto chart in Fig. 5 shows that internal surface marks, flash, and bubbles were the vital few andthe rest were considered as the trivial many.Figure 5. Pareto chart of the types of defects and defectivesThe defect rate was interpreted into two levels. The two levels were DPMO and sigma level. Table 1 shows thecurrent and expected DPMO, sigma level, and loss in terms of money.Table 1. Current and expected valuesEstimations for Floor Traps 6x4x2 FittingsSigma LevelDPMORejected Quantity/DayRejected Percentage (%)Rejected Loss in KWD/YearCurrent1.4516,5008118%6343.35 IEOM Society InternationalExpected 2 256,250409%3171,672859
Proceedings of the International Conference on Industrial Engineering and Operations ManagementBandung, Indonesia, March 6-8, 20183.3Analyze PhaseThe third phase is analyze. The aim of this phase is to identify problems in the injection molding process that wouldcontribute to the production of defects; the data gathered from the Measure phase was used to pinpoint the cause ofthese defects. In addition to identifying the root causes of the problem, the aim of the analyze phase is to provideinsight into how to eliminate these causes.A Cause and Effect diagram, also known as Fishbone diagram or Ishikawa diagram is a graphical tool that is used tosort the potential causes of any problem, in order to identify its root causes. It is illustrated in Fig. 6.Figure 6. Fishbone diagramThe most critical causes in the Fishbone diagram were selected, and were further analyzed; they turned out to be:working parameters, monitor of the machine, contamination of the material, amount of the material, dryness of thematerial, surface of the mold, cleanness of the mold, environment of the workplace, and operator’s behavior andhealth.3.4Improve PhaseThe fourth phase is improve. After identifying root causes in the analyze phase, we move onto the improve phase. Inthe improve phase, we generate possible solutions, select the best solutions, test the solutions and then evaluate theimprovement in terms of sigma level. From the analyze phase, potential root causes were identified.One of the root causes was the working parameters. The working parameters can be adjusted through design ofexperiments (DOE). Before applying DOE, we needed to minimize the amount of working parameters, and find outwhich are critical enough to be used as the factors in DOE (Anderson & Whitcomb, 2005).Cause and effect matrix was used to identify the few key input variables that must be addressed to improve thevariables of the process output. Fig. 7 displays the relationship between the inputs and the outputs. We concludedfrom the cause and effect matrix that three out of the nine inputs, and one output will be tested using DOE. The threeinputs were: injection speed, injection pressure, and melting temperature, while the output was the number ofdefects.Figure 7. Cause and effect matrixAfter selecting our inputs and the corresponding output, we conducted Factorial Design of experiments (DOE).According to (Montgomery, 2005) “is a systematic method to study and determine the relationship between factors IEOM Society International2860
Proceedings of the International Conference on Industrial
understand how Lean Six Sigma can be applied in plastic injection molding. Two similar case studies, one by (Lo, Tsai, & Hsieh, 2009) and another by (Bharti, Khan, & Singh, 2011), both aimed to improve the quality of their injected molded products. The product produced in (Lo, Tsai, & Hsieh, 2009) study was plastic lenses while (Bharti et al., 2011) focused on nylon-6 bush. Inappropriate .