Transcription
CHIEF INVESTMENT OFFICECapital Market OutlookMarch 14, 2022All data, projections and opinions are as of the date of this report and subject to change.IN THIS ISSUEMACRO STRATEGY Macro Strategy—No Respite For The Weary: After two years of a pandemic, the worldnow has to deal with an escalating conflict between Ukraine and Russia. Even assumingcooler heads prevail, and a diplomatic solution unfolds, the conflict has the potential tosow the seeds of a global recession.Chief Investment OfficeMacro Strategy TeamThe Russian economy is small, yet its exports account for disproportionately large sharesof critically important commodities. The conflict has created serious downside risks toworld growth and upside risks to inflation. From disruption to business, financial, andglobal trade activities to energy supplies, food scarcity, and heightened risk of cyberattacks, a protracted conflict between the Western world and Russia could only benegative for economic growth prospects. While the yield curve remains consistent withcontinued U.S. expansion, the world economy is unlikely to come out of the conflictunscathed.Niladri MukherjeeManaging Director and Head of CIO PortfolioStrategyMarket View—The Changing Forces Driving Asset Allocation: Prior to 2020, theeconomy was in the midst of a slow expansion era characterized by low inflation, weakerbusiness spending, accommodative monetary policy and anemic growth. The coronavirusushered in a pandemic disruption era that saw historic increases in money supply, fiscalsupport, inflation and nominal growth.The Great New Dawn era will likely consist of tighter financial conditions, persistentinflation, lower returns from traditional assets, higher volatility, and geopoliticaluncertainty. Throughout these shifts in the economic backdrop, the key forces drivingasset allocation have continuously evolved.Thought of the Week—What Happens in Europe Doesn’t Stay in Europe: AnEarnings Hit to the U.S.? We are keeping a close eye on macro trends in Europe becausethe harmful combination of weak European growth, and stronger dollar versus the eurocould trim U.S. earnings in the next few quarters.Even before tensions erupted in the heart of the continent, the pace of growth wascooling across the pond, notably in Europe’s largest economy: Germany. Unbeknownst toinvestors, U.S. ties in Europe run deep.Merrill Lynch, Pierce, Fenner & Smith Incorporated (also referred to as “MLPF&S” or “Merrill”) makes available certain investmentproducts sponsored, managed, distributed or provided by companies that are affiliates of Bank of America Corporation (“BofA Corp.”).MLPF&S is a registered broker-dealer, registered investment adviser, Member SIPC and a wholly owned subsidiary of BofA Corp.Investment products:Are Not FDIC InsuredAre Not Bank GuaranteedPlease see last page for important disclosure information.May Lose Value45039593/2022MARKET VIEW Emily AvioliAssistant Vice President and InvestmentStrategistTHOUGHT OF THE WEEK Joseph P. QuinlanManaging Director and Head of CIO MarketStrategyMARKETS IN REVIEW Data as of 3/14/2022,and subject to changePortfolio ConsiderationsWe continue to prefer high qualityacross the board, areas of solid dividendgrowth, and low earnings variability. Wereaffirm our positive view on Equitiesrelative to Fixed Income with apreference for U.S. Equities relative toInternational. Maintain diversificationacross and within asset classes asvolatility remains elevated. For qualifiedinvestors, we currently see favorableopportunities for select Hedge Fundstrategies, and we believe Private Creditstrategies should benefit from theconcerns of higher interest rates, asmany of these investments are morecredit- than interest rate-sensitive.
MACRO STRATEGYNo Respite For The WearyChief Investment Office, Macro Strategy TeamGeopolitical events continue to overshadow otherwise favorable U.S. economic data. The UkraineRussia conflict has strained food and energy supplies, global growth and financial marketconditions. Indeed, despite its small economy, Russia is a major exporter of critically importantcommodities, including energy, grains, palladium, steel, aluminum, nickel, rare gases, and fertilizer.Ukraine is a major grain exporter and exports a disproportionate volume of neon gas used forsemiconductor production, an industry already exceptionally strained during the pandemic.Given its role in the world economy, the economic sanctions imposed on Russia have increasedrisks to growth and inflation. Europe is particularly at risk because of its disproportionately largedependence on Russian energy and an already tight global energy market. Its economy wasalready constrained by natural gas shortages. As a result, Europe is reportedly scouring forAustralian and South African coal as it seeks to extend the life of coal-based power generationplants, while the German government is pleading with consumers to conserve energy given thecircumstances, another negative for growth.While the spike in European gas prices this winter has been sobering, the situation would havebeen worse if U.S. LNG exports to Europe had not nearly doubled between November andJanuary, according to the Energy Information Administration (EIA). The surge in exports droveU.S. natural gas inventories down and prices higher, though still about 10 times lower than inEurope. The EIA expects strong LNG demand and expanding export capacity to boost U.S.exports by another 16% this year.Oil prices have increasingly become burdensome for consumers around the world. If sustainedabove 120 per barrel, oil will exacerbate an already elevated inflation environment, sharplyboosting the share of U.S. consumer spending on energy to the highest since 1985. Combinedwith surging prices for other commodities, including agricultural commodities, the economicsituation is starting to become quite problematic both here and abroad. The outcome will clearlydepend on how long the crisis lasts, although the rapid escalation of the conflict—with anincreasingly large number of European countries, Canada and the U.S. sanctioning Russia—suggests long-lasting negative effects. The sudden withdrawal of numerous major Westerninternational oil companies from Russian investments and projects (at the cost of tens ofbillions in asset impairments) meaningfully worsens the long-term outlook for world energysupply given already low global inventories, diminished surplus production capacity, insufficientinvestment due to aggressive green-energy policies and objectives, and the Organization of thePetroleum Exporting Countries (OPEC) difficulty meeting its own production targets. It wouldtake time to find new sources of supply even in the absence of heightened geopolitical risks,uncertainty and financial market volatility. Sweeping financial sector sanctions against Russiaalso have the potential for a significant squeeze on global liquidity, potentially weakeningfunding conditions for high-yield borrowers around the world and emerging market countriesreliant on global capital inflows.Investment ImplicationsSweeping Western sanctionsagainst Russia have seriousimplications for global growth,inflation, world food availability andpoverty. Already stretched duringthe pandemic, global commoditymarkets have little scope to offsetlosses stemming from the Russiaeconomic sanctions in the short tonear terms. Thus, inflation will likelyworsen and global growth weaken,in our view. The effects onindividual countries will depend onhow long the crisis lasts andwhether they are net commodityimporters or not. The conflictsuggests a ramp-up in defensespending and outperformance byinflation beneficiaries, while riskassets are likely to face headwindsfrom the rising probability of globalrecession. A growing probability ofnegative credit events also cloudsthe investment outlook.Severely curtailing Russian energy industry's access to the capital and technology that helpedboost its production to 10% of global supply before the war (the third-largest in the world afterthe U.S. and Saudi Arabia) puts its 11 million barrels per day (mb/d) oil output at risk of notbeing sustained. Planned LNG export facilities are also at risk of delays or of never materializing.With banks also refusing to finance business with Russian companies and with refiners aroundthe world shunning Russian oil, the country’s exports have already fallen sharply despite deepprice discounts. All in all, in an already tight oil, gas and coal market, there are few alternatives toRussian energy supply cuts, especially in the short to near terms. The long-term outlook is alsobecoming increasingly dire given the reluctance of fossil fuel producers to invest in new projectsgiven strong green energy transition pressures. That said, Bloomberg news reports that China isalready considering stepping in to buy stakes in Russian energy and commodity companies. Also,Western financial sanctions have created an opportunity for China to expand its nascent crossborder international payments system (CIPS), as Russia needs an alternative to the WesternSWIFT payments system. Western sanctions could be basically speeding up the deglobalization2 of 8March 14, 2022 – Capital Market OutlookRETURN TO FIRST PAGE
trend already underway and the creation of a separate sphere of influence in competition withthe West.The U.S. is in a much better position than Europe to weather the energy crisis, though not in aposition to help the world fully offset sanctioned Russian supply. U.S. natural gas prices are atenth of those in Europe, and oil production is increasing. According to the EIA, U.S. crude oilproduction increased to 11.6 mb/d in recent weeks, the most since April 2020, with productiongenerally expected to average about 12.3 mb/d in 2022 and 12.9 mb/d in 2023 (above the 12.3mb/d prepandemic annual record in 2019), as surging prices are incentivizing small independentproducers to expand drilling. Large publicly traded producers, on the other hand, are sticking totheir newfound capital discipline. According to a February 2022 Wall Street Journal article, thethree-largest shale companies have recently reported that they would continue to limitproduction growth this year despite decade-high profits in order to return more cash toshareholders after years of poor returns. As noted above, many producers are hesitant to investin light of strict greenhouse gas emission targets widely embraced by governments andinternational organizations around the world over the past year.In addition, industry costs are reportedly rising by double digits due to labor shortages, tightsupply chain, and other factors. For example, while the rig count has increased in response torising oil prices over the past year, the easiest-to-access fields are increasingly exhausted. Higherand rising prices are needed to justify ramping up production outside of “sweet spots” (highproductivity, easy-to-explore fields). Also, most of the best rigs and fracking fleets are reportedlyalready under lease, with limited equipment availability and marginal rigs not fit to meetincreasingly long lateral drilling. According to industry sources, strong competition for the mostsophisticated drilling gear is seen hindering U.S. oil supply expansion this year. Thus, part of the oilprice surge reflects higher inflation and less productive/more difficult fields.With U.S. oil production unlikely to expand much faster than had been planned before theconflict in Ukraine, according to industry reports, and not expected to offset much of theimpaired Russian supply, the International Energy Agency (IEA) has announced the release of 2mb/d for 30 days from the Strategic Petroleum Reserve to help alleviate an immediate supplycrunch. In addition, the U.S. is turning to Iran and Venezuela for help with boosting oil supplycrunch, with potentially more to come. Expectations for an Iran deal on nuclear activities havehelped restrain somewhat the war oil price premium, although an estimated 1.5 mb/d in extraexports from Iran would still not be enough to offset a big drop in Russian oil production andexports. Also, according to industry reports, it would take about six to nine months aftersanctions are lifted to bring back Iranian production and exports to pre-sanctions levels, so atleast a short-term energy crunch is unavoidable, in our view.Surging energy prices have significantly added to the cost of producing and distributingmetals. They also affect food prices, as rising fertilizer and transportation costs are directlypassed through to consumers. Both Russia and Ukraine are major wheat, sunflower oil andcorn exporters. Combined, they provide about 25% of global wheat exports, for example. Theeffect of the conflict on food prices is aggravated by already low fertilizer supplies andsoaring prices. Natural gas shortages have constrained fertilizer production in Europe, whileHurricane Ida and electricity cuts in China also contributed to low supplies and surgingfertilizer prices over the past year. Boycotts of Russian fertilizer exports combined with thesuspension of fertilizer exports until April by the Russian Trade ministry are exacerbating theshortages. Brazil is highly dependent on imported fertilizer, so fertilizer shortages are raisingdoubts it will be able to offset much of the anticipated drop in Ukrainian and Russian grainexports. Insufficient fertilizer sharply reduces crop yields, while the surge in fertilizer pricesincreases crop prices. Either way, global food availability is at risk. Russia is also a leadingproducer of soybeans. With already tight inventories, rising corn and soybean prices suggesthigher costs for animal feed and further price increases for meat. Recent news of tight grainsupply and the Chinese winter wheat crop potentially being the worst in history point to apotentially serious global food supply crisis brewing.To the extent the countries that abstained from endorsing the U.N. resolution condemningthe Russian invasion (India, China and other countries, accounting for the majority of theworld population) replace the void left by Western sanctions on Russia, their effect will bediluted and the conflict prolonged. Still, a sharp break into separate of economic spheres ofinfluence and a new trade war are not encouraging for economic growth prospects.3 of 8March 14, 2022 – Capital Market OutlookRETURN TO FIRST PAGE
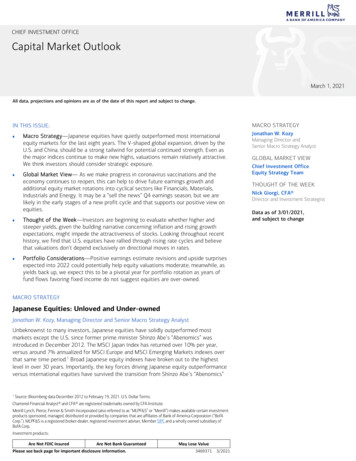
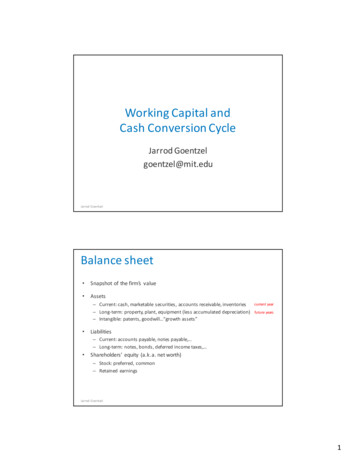
MARKET VIEWThe Changing Forces Driving Asset AllocationNiladri Mukherjee, Managing Director and Head of CIO Portfolio StrategyPortfolio PositioningEmily Avioli, Assistant Vice President and Investment StrategistIn our view, 2022 marks thebeginning of a new era in whichthe primary drivers of assetallocation will shift to tighterfinancial conditions, persistentinflation, lower returns fromtraditional assets, higher volatility,and geopolitical uncertainty. Froman investment perspective, wesuggest exposure to areas offeringhigh-quality sustainable dividendgrowth and pricing power, as partof a balanced portfolio.The global economy and the attendant financial markets are in a new and unique phase, withvery different characteristics from the 2016–19 and the 2020–21 time frames. Amid thiscontinuously shifting economic backdrop, we examine how the fundamental elements of assetallocation have evolved (Exhibit 1).Exhibit 1: Key Forces Driving Asset Allocation By Era.Real GrowthInflationMoney supplyFed funds rateFed balance sheetThe Slow Expansion Era(2016-2019)Remained anemic near 2%Generally below FederalReserve’s (Fed) targetNormal 3–7% expansionGradual increase to 2.50%Increased to 4.5 trillionFiscal stimulusTax cuts to improve U.S.corporate competitivenessCompanyfundamentalsU.S. earnings outpacedInternational; shareholderreturns favored over capitalexpenditures (capex)companies maintainedleverage over laborThe Pandemic Disruption Era(2020-2021)Historically high near 4–6%Rose to over 7% for consumerprice indexExploded higher to 13–25%At zero boundIncreased to 9 trillionStimulus to support households,state & local governments, smallbusinessesProfit margins rose; largecompanies fared better frompandemic disruptions; technologybegan to reshape businessmodels; capex roseThe Great New Dawn Era(2022 – beyond)Should glide lower to trend levelsPersistently highLikely slows substantiallyMultiple hikes expectedQuantitative tighteningFiscal drag given less likelihood ofnew spendingCyclical earnings revival; dispersionbased on pricing power andeconomic moat; acceleratingcreative disruption; labor gainsleverageSources: Chief Investment Office. Data as of 3/9/2022.The Slow Expansion Era (2016–2019)In this era, the U.S. economy was in the back half of a 128-month-long economic expansion,the longest in history dating back to 1854. 1 While the duration of this expansion was aboveaverage, the pace was unusually slow, with real annual gross domestic product (GDP) in theU.S. expanding by 2.3% 2 on average in the years leading up to 2020. Inflation consistently fellshort of 2%, business spending was sluggish, and the global economic outlook was cloudedwith uncertainty amid increasing trade tensions between the U.S. and China. Monetary andfiscal policies remained supportive, and sentiment continued to steadily improve. The labormarket finally recovered from the 2008 crisis, with unemployment hovering near 4% for thelast 24 months of the expansion. 3During this period, U.S. Equities averaged a 14% annual return, outpacing the rest of the worldby about 3%. 4 Earnings grew by an average of 5% annually, and valuations gradually movedhigher, with the S&P 500 Index ending the period with a forward price-to-earnings (P/E)multiple of 18x. Given the lower profile for interest rates, investors exhibited a strongpreference for long-duration Growth stocks, which outperformed Value stocks by about 30%from 2016 to 2019, according to Bloomberg. Bonds also benefited in this environment, asfrequent bouts of deflationary headwinds made Fixed Income appear more attractive, with theICE BofA U.S. Broad Market Index returning 16% cumulatively over the period.Primary drivers of asset allocation: Low inflation, supportive monetary and fiscal policy, low butpositive real rates, U.S. growth shines but trade/technology war creates uncertainty.The Pandemic Disruption Era (2020–2021)The slow expansion era came to a grinding halt in March 2020, when the coronavirus usheredin the sharpest global recession in history. In the U.S., the ensuing recovery marked a paradigmshift in monetary policy as the Fed let the economy “run hot” in an effort to spur labor market1National Bureau of Economic Research, June 8, 2020.Federal Reserve Economic Data, annual average growth rate for real GDP from 2016 to 2019.3Center on Budget and Policy Priorities, March 8, 2022.4Bloomberg, Annual equivalent rate total returns for the S&P 500 Index and the MSCI World Index from December31, 2015 to December 31, 2019.24 of 8March 14, 2022 – Capital Market OutlookRETURN TO FIRST PAGE
growth, ending the disinflationary trend of the previous cycle. The Fed’s balance sheetincreased to roughly 38% of GDP as record levels of fiscal stimulus were deployed, leavingconsumers flush with cash and advancing personal savings to levels not seen since World WarII. Business spending recovered as companies responded to the scarcity of labor by investing inproductivity-boosting digitization, with the technology-led capex cycle topping 1 trillion by theend of 2021. 5 Amid the confluence of these events, growth came roaring back, with real U.S.GDP expanding by 5.7% in 2021 and inflation hitting the highest levels since the 1980s.Equities handily outperformed Fixed Income after the economy started to reopen andsupercharged nominal GDP growth of 7 to 10% powered corporate earnings to 25% aboveprepandemic levels. A 40% growth in money supply pushed up the valuation for the S&P 500Index into the 20x–22x range, the highest levels since 2000. A rotation to cyclical and Valueoriented sectors started to gather steam toward the end of this period, driven by the longignored Energy and Financials sectors, which returned 54% and 35% in 2021, respectively. 6Primary drivers of asset allocation: Rising inflation levels adding to nominal growth, historicmoney supply growth, low and negative real rates, higher commodity prices, generally lowmarket volatility post March-2020 selloff.The Great New Dawn Era (2022 and beyond)In our view, 2022 marks the beginning of a new era involving some hangover from thepandemic excesses, a more normal pace of economic growth, geopolitical uncertainty andmassive innovation and technological advances. Fiscal spending of 3.6 trillion since the startof the pandemic will turn into a fiscal drag, while central banks in developed economies tightenpolicy by raising rates and shrinking their balance sheets. Inflation will remain persistently highgiven commodity shortages and accelerating wage growth, in our view. The pace of economicgrowth will likely moderate, but activity should remain supported by increasing capitalinvestment, productivity growth, consumer pent-up demand for services, and continuedprogress toward a full labor market recovery.Volatility should persist given the wide range of outcomes for the conflict in Eastern Europe,inflation, rates and monetary policy—the Chicago Board Options Exchange's (CBOE) VolatilityIndex (VIX) recently spiked above 35 and is likely to remain elevated, in our view. In the nearterm, U.S. Equities will be in a grind-it-out phase, but remain attractive on a risk-adjusted basiscompared to international stocks amid heighted geopolitical risk. For the S&P 500, the ongoingcorrection has fully erased the valuation expansion during the 2020–21 era, creating a moreattractive entry point for long-term investors. Profit growth should persist, with earnings forthe S&P 500 expected to grow in the mid- to high-single digit range in 2022, though theremay be more dispersion at the individual company level based on pricing power. Areas such asValue, high-quality, dividend-growth, exposure to underlying real assets like Commodities arelikely to outperform, in our opinion.Primary drivers of asset allocation: Tighter financial conditions, persistent inflation, lower returnsfrom traditional assets, higher volatility, geopolitical uncertainty.ConclusionA different set of macro drivers will likely keep average levels of market volatility higher in2022 and 2023 than the years preceding the pandemic. We would not suggest makingsentiment-driven shifts in portfolio allocations given recent geopolitical events but monitoringchanges in the profit cycle and the central banks’ reaction function to inflation data. We believeinvestors will need to be “nimble” along with the Fed as the endgame for inflation remainsuncertain. Rebalancing opportunities may come up with long-term investors looking to increaseexposure to High-Quality Equities at lower prices every now and then, income-seekinginvestors looking at better yields in the bond market, and savers starting to see morereasonable returns from their cash holdings.56U.S. Bureau of Economic Analysis, December 31, 2021.Bloomberg, Total return for the S&P 500 Energy Sector Global Industry Classification Standard (GICS) Level 1Index and the S&P 500 Financials Sector GICS Level 1 Index from December 31, 2020 to December 31, 2021.5 of 8March 14, 2022 – Capital Market OutlookRETURN TO FIRST PAGE
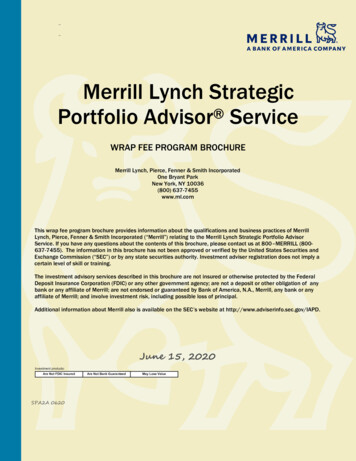
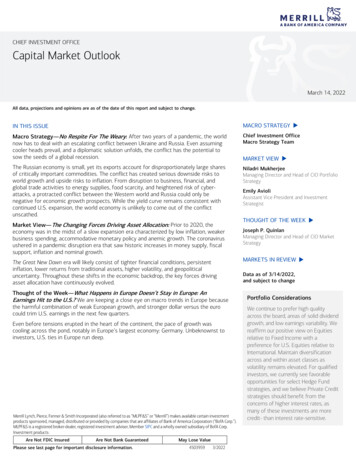
THOUGHT OF THE WEEKWhat Happens in Europe Doesn’t Stay in Europe: An Earnings Hit tothe U.S.?Portfolio ConsiderationsJoseph P. Quinlan, Managing Director and Head of CIO Market StrategyWeaker-than-expected growth inEurope could emerge as adownside earnings surprise forU.S. firms; sectors most exposedinclude Technology,Pharmaceutical, Food andBeverages, Energy, and CapitalGoods.Europe has emerged as the weak link in the global economy, staggered by the conflict inUkraine and soaring energy costs. Even before tensions erupted in the heart of thecontinent, the pace of growth was cooling across the pond, notably in Europe’s largesteconomy: Germany. 7 The upshot: Weaker-than-expected real growth in Europe, coupled witha stronger U.S. dollar versus the euro could spell some downside S&P earnings pressures inthe months ahead.As the accompanying exhibits highlight, Europe matters to the bottom line of CorporateAmerica, with the region accounting for over 60% of foreign affiliate income, a proxy forglobal earnings. Asia ranks a distant second (21%), followed by North American Free TradeAgreement (NAFTA) partners Canada and Mexico (10%), according to the Bureau ofEconomic Analysis. Why Europe? Because the region is large, wealthy and relativelyintegrated. It also possesses a large pool of skilled labor, a business environment in sync withAmerica’s, and is a world leader in innovation and knowledge-based activities. What’s not tolike about Europe?Europe’s importance to U.S. multinationals is disguised by traditional trade figures. Notefrom Exhibit 2 that U.S. exports to Europe (goods and services) have flat-lined for the pastdecade; however, also note that what the U.S. exports to Europe ( 622 billion in 2020) is justa fraction of what U.S. affiliates sell directly in-country ( 3.1 trillion in 2020, the last year ofavailable data). Trade figures—the standard benchmark of Wall Street to gauge globalintegration—don’t even begin to capture the depth and integration of Corporate America inEurope, and hence the risk to U.S. earnings. The U.S. sectors most leveraged to Europe:Technology, Pharmaceutical, Food and Beverages, Energy, and Capital Goods.Exhibit 2: Europe as a Wildcard to U.S. Earnings.A) Passport for ProfitsB) Sales of U.S. Affiliates in Europe vs. U.S. Exports to EuropeU.S. Affiliate Income Earned AbroadShare of Global Total 2000-3Q2021 Billions3,500Middle East, 2.5%South America, 3.5%Africa, 1.5%U.S. Foreign Affiliate Sales in EuropeTotal U.S. Exports to Europe3,0002,500NAFTA,10.1%2,0001,500Asia & Pacific,21.1%1,000Europe, 61.0%50008789919395979901030507091113151719 20Majority-owned nonbank affiliate’s data: 1987–2008. Majority-owned bank and nonbank affiliates: 2009–2020. *Foreign Affiliate Sales: Estimates for 2020. Latest data available.Source: Bureau of Economic Analysis. Data as pulled on 3/9/2022.7The definition of Europe includes: EU-27 (remaining 27 member states of the European Union), the U.K., Norway,Switzerland, Baltic states, Turkey, Russia, Ukraine and smaller states along periphery of developed Europe.6 of 8March 14, 2022 – Capital Market OutlookRETURN TO FIRST PAGE
MARKETS IN REVIEWEquitiesDJIANASDAQS&P 500S&P 400 Mid CapRussell 2000MSCI WorldMSCI EAFEMSCI Emerging MarketsTotal Return in USD mic Forecasts (as of 7Fixed Income†Total Return in USD (%)Current WTDMTDYTDCorporate & 5-2.73Municipals2.15-1.13-1.35-4.39U.S. Investment Grade Credit 8High Yield6.19-1.54-1.89-5.5590 Day Yield0.360.310.290.032 Year Yield1.751.481.430.7310 Year Yield1.991.731.831.5130 Year Yield2.352.162.161.902021A6.05.74.73.65.40.07Real global GDP (% y/y annualized)Real U.S. GDP (% q/q annualized)CPI inflation (% y/y)Core CPI inflation (% y/y)Unemployment rate (%)Fed funds rate, end period (%)Q1 2022E1.07.96.33.80.38Q2 2022E3.58.35.63.50.88Q3 2022E2.57.35.13.31.38Q4 2022E1.85.94.53.21.882022E3.63.37.35.43.5-The forecasts in the table above are the base line view from BofA Global Research. The Global Wealth & InvestmentManagement (GWIM) Investment Strategy Committee (ISC) may make adjustments to this view over the course of theyear and can express upside/downside to these forecasts. Historical data is sourced from Bloomberg, FactSet, andHaver Analytics. Past performance is no guarantee of future results. There can be no assurance that the forecastswill be achieved. Economic or financial forecasts are inherently limited and should not be relied on as indicatorsof future investment performance.A Actual. E/* Estimate.Sources: BofA Global Research; GWIM ISC as of March 11, 2022. BofA Global Research is research produced by BofASecurities, Inc. (“BofAS”) and/or one or more of its affiliates. BofAS is a registered broker-dealer, Member SIPC, and whollyowned subsidiary of Bank of America Corporation.Asset Class Weightings (as of 3/1/2022)Asset ClassCIO ViewUnderweight Neutral OverweightCIO Equity Sector ViewsSectorCIO ViewUnderweight Neutral OverweightSlight overweight greenGlobal Equities Slight overweight green Energy FinancialsIndustrials Neutral yellowU.S. Large Cap Growth Slight overweight green Slight overweight greenU.S. Large Cap ValueCommodities & CurrenciesCommoditiesBloomberg CommodityWTI Crude /Barrel††Gold Spot 1.09117.296.36 Slight overweight greenTotal Return in USD (%)Current 460.94.28.7Total Return in USD (%)PriorPriorWeek EndMonth End1.091.12114.82115.006.336.31 U.S. Small Cap Growth Slight overweight greenU.S. Small Cap Value Neutral yellowInternational Developed Neutral yellowEmerging MarketsSlight underweight orangeGlobal Fixed Income Slight overweight ionary Real Estate Healthcare CommunicationServicesSlight underweight orange2020Year End1.14115.086.36U.S. Mortgages Slight overweight greenNeutral yellowNeutral yellowSlight underweight orangeU.S. GovernmentsSlight overweight greenNeutral yellow Slight overweight greenU.S. Corporates Slight underweight orangeHigh YieldU.S. Investment GradeTax ExemptU.S. High Yield Tax Exempt Neutral yellow ConsumerStaplesSlight underweight orange Underweight redSlight under
Jan 10, 2022 · cyclical stocks during the first half of 2022. [0 /XYZ 19 780 0.00] 3 of 8 January 10, 2022 – Capital Market Outlook RETURN TO FIRST PAGE Pandemic-related monetary and fiscal policies have not only sent the developed world from recession to overheatin