Transcription
CommunityHealth NeedsAssessmentCentral DuPage HospitalJuly 2013Always thinking. Always caring.
Ta b l e o f C o nt e nt sTable ofcontents3Executive summary8Cadence Health10 CDH community health needs assessment11Section 1 – Demographic and socioeconomic indicators19Section 2 – Maternal and child health21Section 3 – Adult morbidity and mortality: leading causes of death and years of potential life lost26 Section 4 – Chronic conditions and diseases34 Section 5 – Infectious and sexually transmitted disease36Section 6 – Mental health38Section 7 – Nutrition, physical activity and obesity40 Section 8 – Access to dare42 Section 9 – Health collaboratives and key community stakeholders46 CDH priority initiatives48 Additional areas of need49 Creating strategies in response to need – the next step2
Executive SummaryExecutive summaryMaintaining awareness of a community’shealthcare needs is imperative in anenvironment as dynamic and diverse asChicago’s western suburbs and requiressignificant planning and accommodation.Our aging population will require more advanced acutecare services including stroke, heart and vascular,orthopedic, and cancer care. Wellness and preventionprograms targeting middle-age and older adults will beneeded to mitigate the impact of these conditions.At the same time, the influx of young working familieswill require outstanding women and children’s services,wellness programs, and preventive care. A growing anddiverse lower income population will require access toaffordable, culturally-sensitive services. The communitywill also need accessible health care facilities and anadditional language interpretation capacity to serve theincreasing number of individuals with limited Englishlanguage proficiency.Central DuPage Hospital (CDH) is well positioned torespond to many of these growing community needs. Weare able to do this in part because CDH is a not-for-profithospital and we reinvest every dollar earned beyondexpenses back into services that benefit our community.The successful implementation of a community benefitstrategy requires a comprehensive assessment of needand an understanding of how to respond to thoseneeds which have been identified. CDH conducts acomprehensive community health needs assessment(CHNA) every three years, and develops a targetedstrategy plan (Community Benefit Plan) to respond to thepriority needs identified.CHNA information is gathered from government andprivate studies as well as directly from communitymembers and key stakeholders to help identify andprioritize needs to be addressed by the hospital. The planis reviewed annually and updated to reflect any newinformation or changes in the community. The resultingCHNA not only provides guidance for formulating CDH’sannual Community Benefit Plan, but also guides ourclinical service and strategic planning processes.3
Executive SummaryNo one institution can comprehensively address all healthof low-income households has increased sharply. Theneeds of a community – nor can it work independently ofpercentage of residents earning below 200 percent of theother key community stakeholders and existing outsideFederal Poverty Level grew nearly 28 percent from 2000initiatives. Therefore, this community needs assessmentto 2005, according to the DuPage Federation on Humanalso considers the strengths and expertise of CDH in theServices Reform. The recent economic downturn hascontext of other community resources. Based upon theaccelerated this trend, and has sharply increased thesummary data provided in this report, we have identifiednumber of unemployed and uninsured as well. Becauseand given priority to the needs we are uniquely suitedDuPage County lacks a public hospital system, privateto address and have also identified those which arehospitals, including CDH, and other providers will bebetter addressed in partnership with other health carechallenged to provide affordable care as this low-incomeproviders, community groups and government agencies.population continues to grow.The foreign-born and non-English speaking populationsBy 2030, the number of DuPageCounty residents age 60 and overwill have increased 133% from 2000.of DuPage County are also rising, with 26 percent ofresidents speaking a language other than English athome. Informing this population of available services andcommunicating with them to deliver services requiresadditional resources.Child and maternal healthDemographics and vital statisticsBy 2030, the number of DuPage County residents age60 and over will have increased 133 percent from 2000,according to estimates by the U.S. Census Bureau. Thiswill drive community need for a range of acute careservices including heart and vascular, stroke, and cancercare. The need for resources to manage the chronicconditions more commonly found in older populationsand to promote healthy lifestyles will also increasesignificantly.The minority population of DuPage County, particularlythe Hispanic population, is also expected to continuegrowing. This is likely to create greater need for outreachand culturally-sensitive clinical programs that addressthe unique needs of an increasingly diverse population.Challenges of rising poverty and limited EnglishproficiencyWhile DuPage County traditionally has been amongthe most affluent in Illinois, in recent years the numberBecause of the relatively small sample size, the DuPageCounty infant mortality rate fluctuates. While themortality rate has averaged about 5.2 deaths per 1,000births in recent years, it has also peaked at 7.4 in 2006,then declined sharply to a low of 4.6 in 2007. Theaverage since 1991 is below the Healthy People 2020target of 6.0 deaths per 1,000 births; however, the spikesin recent years indicate instability in these averages.There is a need for additional effort to improve prenataland perinatal care, and to target high-risk groups suchas teenagers and older women of childbearing age.Also, infant mortality rates among African-Americansare historically higher than for Caucasian residents ofDuPage County, suggesting that interventions targetingthis population may help.Heart disease, cancer and accidents leading tolosses of lifeIn recent history, heart disease and cancer have been theleading causes of death among adults in DuPage County,accounting for nearly half of deaths. However, accidents,the fifth leading cause of death overall at just 3.4 percent,4
Executive Summarywere the second leading cause of years of potential lifeproper management and patient education. Adequatelost because on average, accident victims were muchpreventive and wellness care, education on the impactyounger. Accidents, particularly auto accidents, were theof chronic disease, and lifestyle changes that canleading cause of death among adults age 18 to 44, withhelp control chronic conditions are needed. The ratesrates among men substantially higher than women.and distribution of chronic disease within DuPageCounty also indicate a need for targeted outreach toThe prevalence of heart disease, stroke, and cancer ascauses of death among older adults combined with thedisproportionately affected groups.need for acute care and screening services, as well asInfectious and sexually transmitted disease ratesabove targetsprevention, chronic disease management, and wellnessDespite the availability of vaccines, pneumonia andprograms. The fact that accidents disproportionatelyseasonal flu are significant causes of hospitalizationaffect younger and male community members suggestsand death in the United States and DuPage County.a community need for education and outreach targetingSimilarly, outbreaks of vaccine-preventable diseaseshigh-risk behaviors in these groups.including measles, mumps, and pertussis continue. Newaging population in DuPage County, suggests a growingthreats also appear regularly from emerging infectiousdiseases. In recent years these have included West NileVirus, Severe Acute Respiratory Syndrome (SARS), AvianChronic conditions are responsiblefor 70% of deaths and 75% of healthcare spendingInfluenza A, and H1N1 Influenza.Maintaining high levels of vaccination in the populationis the best way to control these diseases. Vaccine ratesfor pneumonia and flu among older DuPage residentsare below national targets. Improving vaccine ratesfor established diseases requires public outreach andChronic disease increasingChronic conditions are responsible for 70 percent ofdeaths and 75 percent of health care spending nationally,according to the U.S. Centers for Disease Control.These include diabetes, high blood pressure, highcholesterol, heart disease, chronic lower respiratorydisease, and obesity. The incidence and prevalence ofchronic disease is increasing in DuPage County, andrates for many conditions are above national targetscoordination among providers. Meeting emergingdisease threats also requires highly coordinated rapidmobilization of public health and provider resources.While still below national and state levels, rates ofsexually transmitted disease have risen in DuPageCounty in recent years. Education and outreach as wellas access to confidential and affordable treatment areneeded to address these diseases.set by Healthy People 2020. Moreover, chronic diseasesMental health gapsdisproportionately affect minority and low-incomeNationally, one in four adults experience a mentalpopulations, which are among the fastest growing inDuPage County.While the cost and disability burden of chronic diseasesare high, they can be significantly reduced throughhealth disorder in any given year, according to theNational Institute of Mental Health. In 2011 and 2012,21.6 percent of adults reported symptoms of depression,and the DuPage County Health Department’s MentalHealth Services unit serves nearly 3,700 adults and 1,7505
Executive Summarychildren for conditions including depression, anxiety,and schizophrenia. Demand for these services has risenin recent years. In addition, the suicide rate in DuPageCounty has not declined over time, however, the suiciderate of 7.5 deaths per 100,000 population is below theHealthy People 2020 target of 10.2.Early intervention and ongoing treatment with medicationand psychosocial support can be highly effective inOutreach and interventionstargeting children and highrisk adult populations areessential to reduce obesityin the community.improving the function of people with mental disordersand in preventing conditions from worsening. There issignificant community need for additional mental healthAccess to careservices in DuPage County. In particular, the MentalAccess to care for low-income and uninsured patients,Health Coalition has identified gaps in services for non-as well as patients with mental health problems is aemergent chronic mental illness and mental illness ingrowing issue in DuPage County. The number of low-children. Low-income and unemployed individuals alsoincome persons seeking assistance through the DuPagehave limited access to care.County Health Coalition’s Access DuPage programObesity a growing problemObesity is a growing health problem in DuPageCounty. Rates are rising with over 60 percent of adultscountywide either overweight or obese. Of particulargrew 43 percent from 2005 to 2007 while the number ofMedicaid enrollees in the county jumped 38 percent from2006 to 2009. In 2012, 14,402 persons were enrolled in theAccess DuPage program at some point in the year.concern is the rising rate of obesity among children. ForCDH priority needs identifiedexample at one local school, 33 percent of children wereAt CDH we believe the best way to achieve ourfound to be overweight or obese. Between 2007 and 2009,community benefit mission is not only to respond directly25.2 percent of DuPage County children were overweight,to the needs identified within our community, but also to17.7 percent of which were obese, well above the Healthypartner and coordinate with other groups and individualsPeople 2020 target of 14.6 percent. And like many chronicwith similar health improvement goals. These includehealth conditions, obesity is more prevalent among lowerlocal governments, schools, park districts, churches,income and less-educated populations. Obesity increasesbusinesses, nonprofit community groups, and otherthe risk of many conditions, including diabetes, hearthealthcare providers. Partnering helps generate the bestdisease, lung disease, stroke and cancer.return on our collective resources by helping us all do aPreventing and reducing obesity has the potential togreatly improve public health, reduce healthcare costsbetter job of identifying and meeting community healthneeds, and avoiding wasteful duplication of services.and restore economic losses due to disability. OutreachWith that philosophy in mind, CDH has identified fourand interventions targeting children and high-riskpriority needs that we believe we are best positioned toadult populations are essential to reduce obesity in theaddress. In particular, we looked for health needs thatcommunity. In addition to medical care, resources torequire a coordinated response across a range of healthincrease exercise, make healthy foods available, andcare and community resources that can benefit frompublic education are required.6
Executive Summarythe integrated nature of our organization, our networkproviders, and our community partners.In alignment with the MAPP prioritization model usedby DuPage County Health Department and public healthagencies throughout the state, we have selected fourpriority needs which we believe we are best positioned tohelp address.Comm u ni t y hea lt h p r io r i t iesAccess to careObesityMental healthChronic diseaseAdditional information is contained within this reportthat details our approach to responding to thesehealthcare needs.A thank you to our partnersWe would like to thank all of our community partnerswho work together to identify and meet health needsthroughout our community. In particular, we thank theDuPage County Health Department and the DuPageCounty Health Coalition for their generous sharing ofstatistical data, insight, and technical advice in preparingthis report. We would also like to thank the MetropolitanChicago Healthcare Council and Professional ResourceConsultants for their assistance in updating the CHNAmaterials.7
C a d e nc e H e a lth S y s t e mCadence HealthOverview of our service area and service deliverymodelCentral DuPage Hospital, part of Cadence Health, islocated within DuPage County, and is situated 20 mileswest of the metropolitan Chicago area. The County iscentrally located within the Northeastern Illinois regionand occupies an area of 336 square miles. DuPage County,Central DuPage Hospitalprovides 735,965 patientvisits annually.*with its 917,000 plus residents is home to the secondlargest population (next to Chicago’s Cook County) amongall counties in the State of Illinois. DuPage County isThe Cadence Health network has established partnershipsalso home to CDH’s primary service area and much of itswith other health-related organizations to promotesecondary service area.wellness in the communities we serve.The hospital’s primary service area includes theThese pa r t ner ships inc lu de :communities of: Wheaton, West Chicago, Warrenville,Carol Stream, Glen Ellyn, and Winfield which are locatedadjacent to our sister hospital, Delnor Hospital. CDH’ssecondary service area includes: Bartlett, Bloomingdale,Ann & Robert H. Lurie Children’s Hospital of Chicago atCadence HealthCharlestowne Medical Office BuildingGlendale Heights, Hanover Park, Lisle, Lombard,Naperville, Roselle, and Streamwood.Community Alliance Home HealthCDH offers a broad array of state-of-the-art key servicesRush-Copley Medical Centerand relationships including: the CDH Cancer Center, CDHProton Center – A ProCure Center, Cadence ConvenientCare centers, Cadence Physician Group, Cadence HealthFoundation, Central DuPage Business Health, CNS HomeHealthTrack Sports and WellnessWheaton Sports CenterHealth and Hospice, and HealthLab.*Inpatient and outpatient combined.8
C a d e nc e H e a lth S y s t e mLife Time Fitnesscommunity stakeholders and residents. Upon completionof the needs assessment careful consideration is givenSuburban Surgery CenterAlexian Brothers Medical Center and a Consortium of PhysiciansThe Center for Surgery partnering with Edward HealthServices Corporation and a Consortium of Physiciansto the prioritization of needs identified within thestudy. Prioritization is generally in alignment withlocal public health expert analysis and consideration isgiven to addressing needs that we are uniquely suitedas a healthcare provider to address – either solely or incollaboration with community partners. Consideration isalso given to existing collaboratives to avoid duplication.In short, our services and relationships with otherThree to four health priorities are generally chosen. Ourlocal healthcare entities embody our belief that ourCHNA is conducted every three years and reviewed andcommunities are most effectively cared for throughupdated annually as needed.like-minded partnerships that provide state of the art,high-quality, evidenced-based care to the residents ofThe next phase in our community benefit processDuPage County.includes the development of a strategy (CommunityCommunity benefit process overviewBenefit Plan) to effectively respond to the needs identifiedin the CHNA. Goals, objectives, methodology and desiredInvesting back into the community is a strong part ofoutcomes are developed for each priority initiative.Cadence Health and who we are. We do not assumeHealthy People 2020 goals and objectives for a healthylightly the responsibility of caring for our community.nation serve as baseline and the development of targetsServices and relationships are strategically-planned infor desired outcomes in addition to goals establishedrelationship to need, benefit and outcome. Every dollarlocally by the DuPage County Health Department andearned beyond expenses is rededicated back to servingother key initiatives. Objectives are operationalizedthe residents of DuPage County.by CDH staff and quantitative and qualitative data isCadence Health utilizes a 360-process framework andconceptual approach to strategically guide communitybenefit planning. The process begins with the compilationof a comprehensive community health needs assessment(CHNA), which includes not only a quantitative analysisof secondary data but also reflects input from keycollected throughout the year to measure our progresstowards outcomes. This data is reported annually in ourCommunity Benefit Plan Report. At the end of each year,key staff and leadership review the Plan Report assessingthe efficacy of our interventions, outcome data and returnon investment to ensure maximum use of the dollarscommitted to our community.9
C D H C o m m u n i t y H e a lth N e e d s A S s e s s m e ntCDH 2013-2015community healthneeds assessmentIn August 2010, the DuPage County Health DepartmentIn July 2012, CDH commissioned an additionalcompleted the 2015 IPLAN MAPP planning process.community health assessment through ProfessionalMAPP is a nationally-recognized, community-wideResource Consultants, Inc. (PRC) in collaboration withstrategic planning tool used for improving public healththe Metropolitan Chicago Healthcare Council (MCHC).by helping communities prioritize public health issues,In compiling this assessment, PRC spoke directly withidentifying resources for addressing those issues,354 area residents conducting a random health survey, asand taking action. The county progressed through awell as convened key community leaders, and consultedseries of six MAPP phases. Components of the MAPPexisting data sources.processes included a Forces of Change Survey, AssetMapping, Community Themes and Strengths Survey,Key findings from both the DuPage County IPLAN andand a comprehensive Community Health Assessment.the MCHC PRC report form the basis of our 2013-2015This data was gathered utilizing survey methodologies,Community Health Needs Assessment and are discussedcommunity meetings, key stakeholder input andbelow in addition to their implications for the health ofsecondary analysis of quantitative epidemiologic data.community residents within our service area.The Health Department used MAPP data to develop its2015 Community Health Improvement Plan. CDH waspleased to serve on the IPLAN Steering Committee.10
S e ct i o n 1 D e m o g r a p h i c an d S o c i o e c o n o m i c In d i cat o r sSection 1:Demographic andSocioeconomic IndicatorsCurrent population demographicsDemographics by ageDemographics by race/ethnicityImmigrant populationEnglish literacyEducationMedian household incomeHousingUnemploymentPovertyUninsuried and publicly insuredHomelessnessImplications of trends for health services planning11
S e ct i o n 1 D e m o g r a p h i c an d S o c i o e c o n o m i c In d i cat o r sOverviewA population’s demographic characteristics are indicativeof community health needs. Generally speaking, as ageincreases, the overall need for health services increasesas well. Genetics and culture also influence health needs.Blood pressure, cardiovascular disease, diabetes, cancer,eye disease, and other genetically linked conditions varysignificantly among different racial and ethnic groups.Socioeconomic statistics also affect the volume and typeof health needs in the community. These include income,education, English language literacy, employment,insurance, and immigration statuses. In general, lowerincome individuals require more assistance in accessingaffordable health care. Additionally, individuals withrange of acute care services including heart and vascular failure,stroke, and cancer care. The need for resources to manage thechronic conditions more commonly found in older populations,and to promote healthy lifestyles, will also increase.I nc r eased e t hnic di v er si t yThe minority population increased in virtually every age groupwithin DuPage County, especially Hispanics, which now comprise12.6 percent of the population. Additionally, the Asian populationhas increased by 270 percent from its 2000 population (72,628).The CDH service area is more homogeneous in terms of race andethnicity than the county as a whole, with White non-Hispanicsmaking up 69.8 percent of the population, Hispanics 13.6 percentand Asians and African-Americans each comprising 15.5 percentof the population.limited English language proficiencies may requireinterpretation and specialized outreach services.I nc r eased low- income , u nemp loy ed andu nins u r edDuPage County has seen vast modification in itsdemographic and socioeconomic trends in the past twodecades.These t r ends inc lu de :Risin g ag eBy 2030 the number of DuPage residents age 60 or over willhave increased 133 percent from 2000, according to estimatesby the U.S. Census Bureau. This will drive community need for aDespite the fact that DuPage County has a median householdincome of more than 72,470, 2012 PRC Health Rankings reportthe unemployment rate in DuPage County was 8.3 percent.From 2007 to 2011, poverty rates in the county increased to6.2 percent. The economic downturn has accelerated this trendand has sharply raised the number of unemployed and uninsuredresidents. Resources, planning, and coordination amongproviders, community groups, and government will be requiredto ensure access to affordable care for this growing low-incomepopulation.12
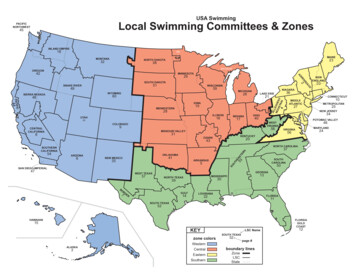
S e ct i o n 1 D e m o g r a p h i c an d S o c i o e c o n o m i c In d i cat o r s1.1 Current population demographicsThe population in 2010 was 917,000, with a population density of about 336 people per square mile, according to DuPageStatistical Profile. In 2010, the population breakdown was estimated to be 646,130 Caucasians, 41,024 African-Americans,91,793 Asians, and 121,506 Hispanic or Latino origin.1.2 Demographics by ageDuPage County is the overall seventh youngest county in Illinois, and it is notable for its age distribution. From 2000 to2010, the population increased by 1.4 percent, and the age distribution shifted rapidly. The median age in DuPage Countyis 38.2 years. The largest age group is the 18 to 44 year-olds, but the fastest growing segment of the population is 45 to 64year-olds.Population Changes in DuPage County 2000 – 2010Age Group2 0 0 0 -2 0 1 0 % o f C han g e0-19-6.0%20-44-12.7%45-6427.3%65 19.8%Total1.4%Source: DuPage County Health 262,26465 4Source: DuPage County Health Department13
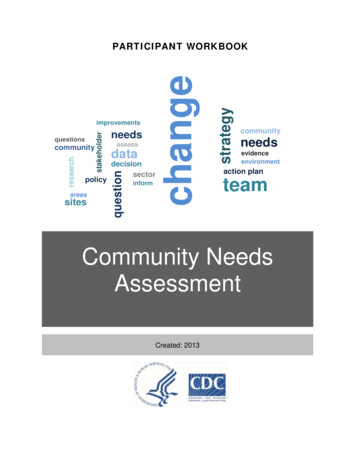
S e ct i o n 1 D e m o g r a p h i c an d S o c i o e c o n o m i c In d i cat o r s1.3 Demographics by race/ethnicityThe racial distribution in DuPage County has changed significantly from 2000 to 2010. Non-Hispanic Whites nowconstitute 70.5 percent of the total population, a drop from 79 percent in 2000, while Hispanics now comprise 13.3percent of the total population, an increase from 9 percent in 2000.Racial/Ethnic Make-up in DuPage County2000Not Hispanic or 5,41886.7%White alone711,96678.7%646,13070.5%Black or African American alone26,9773.0%41,0244.5%Asian alone10.0%70,9087.8%91,793American Indian and Alaskan Native alone9120.1%9920.1%Native Hawaiian and other Pacific Islander alone1800.0%1710.0%Some other race alone8700.1%1,1810.1%10,9821.2%14,1271.5%Spanish, Hispanic or Latino (of any 10.5%Puerto Rican4,7520.5%7,7360.8%Cuban1,8340.2%2,3450.3%Two or more racesSpanish, Hispanic or LatinoOther Spanish, Hispanic or LatinoTotal minority 9.5%Source: United States Census Bureau1.4 Immigrant populationBetween 2000 and 2009, the foreign-born population of DuPage County increased from 15.3 percent in 2000 to 18.4percent in 2009. Currently, the foreign-born population constitutes 18.3 percent of the total DuPage County populationwith 82,391 foreign-born residents.Residents Born Outside the United StatesDuPage County Foreign Born Population (as Percent of Total population)Percent foreign born2000200915.3%18.4%2009 Region of Birth of Foreign Born as Percent of Total Foreign Born %Latin America30.1%Northern America0.9%Source: DuPage County 2011 Statistical Profile14
S e ct i o n 1 D e m o g r a p h i c an d S o c i o e c o n o m i c In d i cat o r s1.5 English literacyFrom 1990 to 2007, the percentage of the DuPage population speaking a language other than English at home grew from13 percent to 26.1 percent. Within the foreign-born population the proportion speaking a language other than English athome was 89.4 percent in 2007. In 2012, there were 10.1 percent (86,551 people) over the age of five years reporting thatthey spoke English less than “very well.” According to County Health Rankings, 10.1 percent of the population in DuPageCounty is not proficient in English, while 6.6 percent of the population is illiterate.Language Spoken at Home (2007-2012)DuPageIllinois26.1%22.0%Language other than English spoken at home,percent age 5 , 2007 - 20112011Not proficient in EnglishDuPage 5110.1%Illinois State10%10%Source: County Health Rankings1.6 EducationIn 2012, the percent of the population in DuPage County with a high school degree decreased by 8 percent (92 percent)from 100 percent from 2011. Conversely, the percent of the population with a college, graduate, or professional degreeincreased by 45.6 percent. In DuPage County, 8 percent of residents age 25 and over have not graduated high school.Educational Attainment in DuPage CountyDuPageIllinois201020112012201020112012High school graduate92%100%92%80%80%84%Some college44%75%76%29%64%65%Source: United States Census Bureau1.7 Median household incomeThe 2012 median household income for DuPage County was 72,470. In 2009, DuPage County’s per capita personalincome was 125 percent of the Illinois average, and 132 percent of the national average, and DuPage County’s 2009median household income was 73,520.1.8 HousingThe number of households paying more than 19.3 percent of their income for rent, which is commonly defined asthe threshold of affordability for middle-income groups, has increased sharply. The Illinois Poverty Report stated that23.2 percent of DuPage County were renter households. The homeownership rate (2005 to 2009) is at 76.8 percent.15
S e ct i o n 1 D e m o g r a p h i c an d S o c i o e c o n o m i c In d i cat o r s1.9 UnemploymentHistorically, the DuPage County unemployment rate has run below the state and national levels. With 517,675 peopleunemployed in 2011, the unemployment rate was 8 percent, less than Illinois’ 9.8 percent, and the national rate of8.9 percent.Unemployment in DuPage County 2006-2011YearLabor ForceTotal EmployedNumberUnemployedUnemployedRateIL UnemployedRateUS ,2938.09.88.9Source: DuPage County Health Department1.10 PovertyAlthough DuPage County has one of the highest median incomes in the state, the number of low-income residents issteadily increasing. In 2011, the poverty rate in DuPage County was 6.2 percent which is less than the Illinois rate of13.1 percent. The 2010 American Community Survey reported the number of children in poverty is 17,995 or 8 per
to 2005, according to the DuPage Federation on Human Services Reform. The recent economic downturn has accelerated this trend, and has sharply increased the number of unemployed and uninsured as well. Because DuPage County lacks a public hospital system, priv